

John Hussman is the master of the understatement. Heed his warning:
“Markets move in cycles. Investors learned that by the 2002 lows, but only after terrible losses. They learned it again in 2009. They have already forgotten, so investors will have to learn it yet again.”
The show may go on for a few more weeks, but the stampede for the exits will be epic. Your “friends” on Wall Street have blocked the exits and caged you in.

Not In Kansas Anymore
John P. Hussman, Ph.D.
Having rested the case for a defensive investment stance in a series of recent weekly comments (see Closing Arguments for a summary), what remains is simply to update the status of those considerations. Importantly, our concerns are driven by the average outcomes that have accompanied similar evidence. We don’t need to forecast near-term direction, and while we have very strong views about long-term return prospects, there are likely to be numerous constructive opportunities along the way to more favorable valuations. Our approach is to align our investment position with the return/risk profile that we estimate based on observable evidence at the present moment. The fact that similar evidence has historically been so one-sidedly hostile is certainly worth noting, but in fact, no forecasts are required, and we have every expectation of moving with the evidence. What is most necessary here is simply the recognition that markets move in cycles, that investment conditions will change over time, and that returns born of euphoria are not easily retained.
On overvalued, overbought, overbullish conditions
Last week, Investors Intelligence reported that the percentage of bullish investment advisors moved to 54.2% (from 52.1% the prior week) with just 19.8% of advisors bearish. The Shiller P/E (S&P 500 Index divided by the 10-year average of inflation-adjusted earnings) reached 24.5. The S&P 500 is well-through its upper Bollinger bands (two standard deviations above its 20 period moving average) on weekly and monthly resolutions, in a mature bull market advance, with 10-year Treasury yields higher than they were 6-months prior.
None of these conditions in isolation has enormous impact; each usually only modifies expected returns. The problem is that when significantly overvalued, overbought, overbullish conditions have been observed together – particularly coupled with rising bond yields – the syndrome indicates a disease that none of the symptoms identify individually.
I’ve noted before that even a Shiller P/E above 18 combined with a wide spread of bulls versus bears at some point during the prior 4-week period is generally enough to outweigh trend-following considerations, such as the S&P 500 being above its 200-day moving average (see Aligning Market Exposure with the Expected Return/Risk Profile). I’ve also noted that some conditions can be more simply defined. For example, instances featuring bearish advisors below 20%, with the S&P 500 at a 4-year high and a Shiller P/E above 18 are limited to the present advance, May 2007, August 1987, December 1972 (though with an early signal in March-May of that year), and February 1966, all which were followed by significant bear market losses.
Various definitions of an overvalued, overbought, overbullish syndrome can capture slightly different instances. Less stringent definitions capture a larger number of danger zones, but also allow more false signals. Still, as long as the basic syndrome is captured, the subsequent market outcomes are almost invariably negative, on average. Presently, what we observe is among the least frequent and most hostile syndromes we identify. As I observed in the weekly comment that turned out, in hindsight, to accompany the 2007 market peak (see Warning – Examine All Risk Exposures):
“There is one particular syndrome of conditions after which stocks have reliably suffered major, generally abrupt losses, without any historical counter-examples. This syndrome features a combination of overvalued, overbought, overbullish conditions in an environment of upward pressure on yields or risk spreads. The negative outcomes are robust to alternative definitions, provided that they capture that general syndrome.”
The chart below highlights each point in history that we’ve observed the following conditions: Overvalued: Shiller P/E anywhere above 18; Overbought: S&P 500 at least 7% above its 12-month average, within 3% of its upper Bollinger bands on weekly and monthly resolutions, and to capture a mature advance, the S&P 500 well over 50% above its lowest point in the prior 4 years; Overbullish: a two-week average of advisory bulls more than 52%, and advisory bears less than 28%. Rising yields: 10-year Treasury yields higher than 6-months earlier. The instance in 1929 is based on imputed sentiment data, as bullish and bearish sentiment is correlated with the extent and volatility of prior market fluctuations.
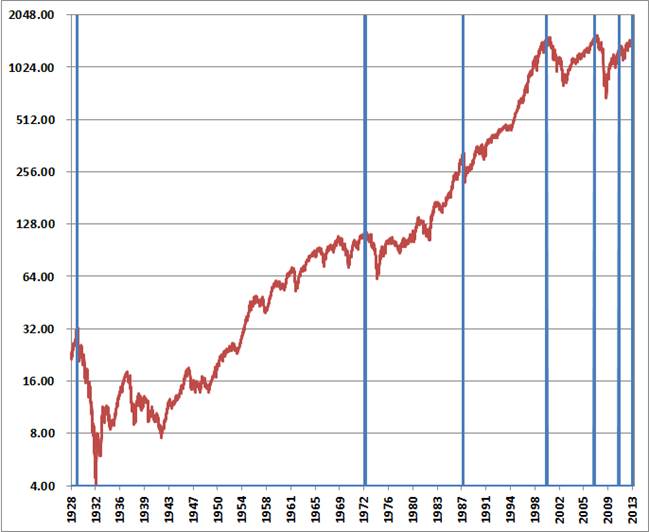
One of the difficulties with this sort of analysis is that instances that appear to be very clear peaks on an 85-year chart are actually periods where there was often a cluster of instances with further market advances for several more weeks. In 1929, the market advanced another 5% to its final peak in the two weeks following the first instance of this syndrome. In 1972, the market advanced a final 3% over 6 weeks. The 1987 and 2000 peaks occurred the same week that the syndrome emerged. In 2007, the S&P 500 advanced to within 2% of its final peak 3 weeks after this syndrome emerged, and crawled within 1% of that peak after 9 weeks. The S&P 500 then dropped nearly 10% over the next 4 weeks, and then staged a final 11% spike over 8 weeks to a marginal new high which actually marked the 2007 peak. In 2011 the market enjoyed a choppy 6% advance, dragged out over 16 weeks, before rolling into a 19% correction over the following 12 weeks. The present signal reiterates the first one that we observed in late-January, 17 weeks ago. To a long-term investor, this is the blink of an eye, but in the context of day after day of bullish euphoria, it seems like an absolute eternity.
In general, the initial decline from these peaks tends to occur as a sharp 6-10% market drop over a handful of weeks, typically followed by a partial recovery attempt toward the prior peak. This sort of activity both before and after major peaks gives the market the impression of near-term “resilience” that dilutes the resolve even of investors who know the history of these things.
I should note that present conditions are extreme enough that neither trend-following nor momentum factors can be used to separate out favorable outcomes from this small set of decidedly unfavorable ones. As I’ve previously noted, a great deal of our research during this advance has focused on this sort of “exclusion analysis.” I recognize that many investors have simply decided on the strategy of holding stocks until QE ends, or some similar formulation of “strategy,” but for better or worse, we do insist on approaches that we can validate in historical and out-of-sample data, and that have been strongly effective over full market cycles. When we examine the past few years, as well as long-term history, the most effective “exclusions” aren’t simple ones like “don’t fight the trend” or “don’t fight the Fed.” Rather, they are more subtle prescriptions like “stay with the trend in an overvalued market, but only until overvalued, overbought, overbullish conditions are established.” These considerations aren’t actually required to do well over complete market cycles, but quantitative easing has held off the resolution of historically unfavorable market conditions much longer than usual, and these subtle considerations would have undoubtedly made recent experience less frustrating.
If this bull market is to continue, I have little doubt that considerations like this will provide the opportunity to be constructive on the basis of well-tested evidence that actually supports a constructive stance. Here and now, a constructive stance is an experiment about whether QE can override market conditions that have always preceded unfortunate outcomes. My views and research should be of no impediment to investors with a different view, assuming that they have a reliable exit criterion that will precede the attempts of tens of millions of others to exit. It would be far easier to conduct that experiment without me than to convince me that it is a good idea.
As the respected technician Bob Farrell once noted, “exponential rapidly rising or falling markets usually go further than you think, but they do not correct by going sideways.” This is really all the 1987 crash was – a mass of investors trying to preserve profits from the preceding advance by acting on the identical trend-following exit signal simultaneously.
On valuations
Even in the event that quantitative easing is sufficient to override hostile market conditions in the near-term, it is worth noting that long-term outcomes are likely to be unaffected. We presently estimate a prospective 10-year total return on the S&P 500 Index of just 2.9% annually (nominal). See Investment, Speculation, Valuation and Tinker Bell for the general methodology here, which has a correlation of nearly 90% with subsequent 10-year market returns – about twice the correlation and nearly four times the explanatory power as the “Fed Model” and naïve estimates of the “equity risk premium” based on forward operating earnings.
We presently estimate that the S&P 500 is about 94% above the level that would be required to achieve historically normal market returns. If you work out present discounted values, you’ll find that depressed interest rates can explain only a fraction of this differential, even assuming another decade of QE – and even then only if historically inconsistent assumptions are made to combine normal economic growth with deeply depressed rates.
This chart gives a good overview of what has actually transpired in the stock market through post-war history. Points of deep undervaluation like 1942, 1950, 1974 and 1982 created foundations on which long secular bull market advances were built. The rich valuations of the mid-1960’s were enough to ensure that any return to undervaluation would result in a long period of poor market returns. The late-1990’s bubble took valuations far above any historical valuation norm, and ensured that even a return to valuations previously considered “rich” would produce devastating returns, and we saw that in 2000-2002. The advance to the 2007 peak did not go nearly as far, but still ensured that even a return to normal valuations would produce devastating returns, and we saw that in 2007-2009.
At present, valuations are less extreme than they were in 2000, approach levels that were reached in 2007, and remain well beyond those observed at the late-1960’s secular peak. The question is where valuations will go from here, and while other indicators can be applied to that question, valuations alone don’t provide the answer. Matching the valuations of the 2007 peak would require another 8% advance in the S&P 500. A return to historically normal valuations would imply a 48% market decline – the average cyclical bear market in a secular bear market period has typically represented a decline closer to 38%. A move to secular lows (about 0.5 as a multiple of fair value) would imply a Depression-like drop of about 75%, but such lows are typically associated with macroeconomic crises such as world war or uncontrolled inflation. Still, these are all valuations that we’ve actually observed in the post-war period. None of these calculations are indicative of where the market is going, but we should at least be aware of the extremes that are already in place.
On the economy
Among the better leading indicators of the economy, the Philadelphia Fed Index of economic activity deteriorated to 1.3 in April, and dropped to a disappointing -5.2 reading for May. The Chicago Purchasing Managers Index slipped from 52.4 to a contractionary reading of 49 in April, though the important “new orders” component held above 50, coming in at 53.2. The chart below shows data on a variety of national and regional surveys from the Fed and the Institute of Supply Management. Notably, the chart shows data only through April. The May reports released thus far are the Philly Fed and Empire Manufacturing surveys, both which surprised significantly to the downside.
As I noted last week, holding hours worked constant, the U.S. economy would have lost the equivalent of 550,000 to 600,000 jobs in April. Meanwhile, excitement about improvement in the federal deficit is largely driven by several one-off factors and quite rosy assumptions. These include special distributions, repayments from Fannie Mae and Freddie Mac, the expiration of accelerated depreciation deductions for investment, and capital gains realizations taken in advance of the “fiscal cliff.” Projections of further deficit reductions are predicated on assumptions that inflation in health costs will be controlled; that corporate tax revenues will increase by 57% by 2014 (and 88% by 2015); that the U.S. economy will avoid any recession in the coming decade; and that real GDP growth will increase to 4% (6% nominal) in the coming years, despite a 9% decline in discretionary outlays by the government next year. The CBO projections also assume that tax revenue as a percentage of GDP will move sustainably above the long-term average. I do expect that the Federal deficit will gradually come down over time. But barring a massive, domestically financed increase in gross real investment (which the data do not suggest is presently in the works), the 2-quarter lagged effect of a smaller government deficit is likely to be weaker corporate profit margins, for reasons I’ve articulated previously.
On quantitative easing
Over the past three years, the U.S. economy has repeatedly approached levels that have historically marked the border between expansion and recession. There is little question that massive quantitative easing by the Federal Reserve has successfully nudged the economy away from this border for a few months at a time. But as I’ve noted before, the belief that monetary easing solved the 2008-2009 financial crisis is an artifact of timing. The Fed was easing monetary policy throughout 2008, and while it is tempting to view the recovery as a delayed effect, the more proximate factors were a) the change in FASB accounting rules to dispense with mark-to-market accounting, which relieved banks of insolvency concerns even if they were technically insolvent, and b) the move to government conservatorship and Treasury backstop of Fannie Mae and Freddie Mac, which reduced concerns about default risk among mortgage securities.
The Pavlovian response of investors to monetary easing – as if it has anything more than a transitory and indirect effect on the economy – fails to distinguish between liquidity and solvency; between economic activity and market speculation; and between investment value and artificially depressed risk premiums. The economy is not gaining anything durable from these policies, and the conditions for the next bear market are already established. Meanwhile, the chart below updates the extreme that monetary policy has already reached (data points since 1929).
The 3-month Treasury yield now stands at a single basis point. Unwinding this abomination to restore even 2% Treasury bill rates implies a return to less than 10 cents of monetary base per dollar of nominal GDP. To do this without a balance sheet reduction would require 12 years of 6% nominal growth (which is fairly incompatible with sub-2% yields), a more extended limbo of stagnant economic growth like Japan, or significant inflation pressures – most likely in the back half of this decade. The alternative is to conduct the largest monetary tightening in the history of the world.
None of this is to suggest that speculation cannot go further – though present overvalued, overbought, overbullish extremes weigh against it. Still, valuations and monetary conditions are far removed from what is sustainable, and there is more evidence to indicate that the economy is weakening than support of the idea that it is strengthening.
Knowing where you are doesn’t mean that you’re leaving, but you should still know where you are. We’re not in Kansas anymore.
The foregoing comments represent the general investment analysis and economic views of the Advisor, and are provided solely for the purpose of information, instruction and discourse. Only comments in the Fund Notes section relate specifically to the Hussman Funds and the investment positions of the Funds.
Fund Notes
Last week, market conditions reiterated the most hostile syndrome of overvalued, overbought, overbullish, rising-yield conditions we identify. Strategic Growth Fund remains fully hedged, with a “staggered strike” hedge that raises the strike price of the index put option side of the hedge closer to market levels, but we continue to significantly lag those strikes below the market in order to minimize time decay. Presently, that staggered strike position represents less than 1% of assets in additional time premium looking out to mid-summer. This also means that until the market declines by more than several percent, most of the day-to-day fluctuation in Fund value is likely to be driven by differences in performance between the stocks owned by the Fund and the indices we use to hedge. Strategic International remains fully hedged. Strategic Dividend Value is hedged at about 50% of the value of the stocks held by the Fund. Strategic Total Return continues to carry a duration of about 3 years (meaning that a 100 basis point move in interest rates would be expected to impact Fund value by about 3% on the basis of bond price fluctuations), and just over 12% of assets in precious metals shares.
There are countless investment strategies that offer aggressive investment approaches, long-only exposure, and loads of various market risks for investors who desire them. We follow a specific, long-term discipline defined by an effort to accept market risk in proportion to the expected return/risk profile that we estimate based on prevailing conditions. We make every attempt to refine that discipline over time, but the Funds are defined by the specific investment objectives and disciplines that we promise to our shareholders. We constantly research promising indicators and investment considerations. Those that place heavy weight on trend-following and Fed-following are testable strategies, and their return/risk characteristics can be carefully evaluated. Once overvalued, overbought, overbullish conditions emerge, they don’t perform nearly as well over time as investors seem to believe. Quantitative easing is certainly “new” in the sense that such extreme policies have never been pursued. But data on interest rates, Fed action and the monetary base go back nearly a century, and even analyzing more recent experience with quantitative easing by Japan, England, the European Central Bank and the Federal Reserve leaves us with little confidence that QE does much more than to temporarily suppress periodic spikes in risk premiums.
Investors who wish to follow the Fed to the exclusion of other evidence should feel no compulsion to consider our own research, or our own performance in the years prior to the recent bull market advance. In my view, we are now in a very mature, unfinished half of a market cycle spectacularly distorted by monetary and fiscal imbalances. The prospects that the financial markets will face over the next few years are quite unlikely to mirror the lovely ones that they enjoyed while these imbalances were being established.
Nearly all of my own assets remain invested in the four Hussman Funds, with the largest allocation to Strategic Growth, because despite the challenges we’ve experienced in the advancing portion of this cycle, I have no doubt that the financial markets will experience cycles – not endless parabolas – over time. We accept a significant of “tracking difference” versus a buy-and-hold approach because our objective is to achieve full-cycle returns above the long-term norm for equities, with smaller losses than the general market over the full-cycle. There is no assurance we’ll achieve that objective, and the recent cycle has been an extraordinary challenge for reasons that I’ve frequently detailed. In contrast, I view the performance of Strategic Growth in the 2000-2008 period to be a reasonable reflection of those objectives in practice, even in an environment where the general market achieved no net gain.
With regard to the challenges of the most recent market cycle, my insistence on stress-testing our approach against Depression-era data in 2009 to early-2010 led to an unfortunate miss in the interim, but I believe that it will make us more resistant to extreme market conditions in the future. I also believe that we’ve addressed most (though probably not all) of the challenges created the monetary-driven speculation of recent years by incorporating what I’ve described as “exclusion analysis.” This involves refining the pool of periods where average expected outcomes are negative in order to “exclude” the largest set of constructive instances from that pool, and validating the exclusion criteria in out-of-sample data. For example, trend-following considerations can be important even in periods where our return/risk estimates are negative, but only in the absence of overvalued, overbought, overbullish syndromes. That refinement could have saved us some trouble in recent years, but such considerations still do not encourage a constructive position here. That may be a shame, or it may turn out to be a blessing. All we know with certainty is that nearly a century of evidence – even including trend-following and monetary factors – supports a defensive stance from our investment approach here.
This will change. Markets move in cycles. Investors learned that by the 2002 lows, but only after terrible losses. They learned it again in 2009. They have already forgotten, so investors will have to learn it yet again


The only way to “win” is to not play.
[img [/img]
In the end, by going along to get along, we are all very much complicit in this wanton uncreative destruction. The Lord openly warned us long ago not to go down this treacherous path, through the unlikely actions of his peace loving son, who in a fit of rage, violently flipped over the tables of the detestable usurious money changers wielding their wicked web in the sacred temple.
Alas, mankind never seems to learn the altruistic and enlightened righteousness of a forthright even-handed means of true money exchange, and once again we will be brutally humbled for our malicious manipulated mendacity, same as it ever was. We should have unquestionably known better and categorically repudiated the repugnant treachery. Our founding fathers deserved so much more from us. We have utterly and miserably failed them.
Shameful indeed Bernanke & Co, we will all pay dearly for your fiat money malfeasance which those of us that certainly knew better so submissively permitted and so cowardly accepted. The unhinged approach of monetary debasement has been repeatedly attempted throughout civilized economic history and has always ended in abject failure. There exist no historical exception to this solemn fact. The only viable protection against the most threatening global monetary repression of all time is direct ownership of physical gold bullion held completely outside the fraudulent financial banking system.
The Poisonous Printing Press
Bruno de Landevoisin
It’s painfully clear for all to see that the majestic United States is now firmly caught in the rapacious stranglehold of financial elites which have completely captured it in a grotesque gamed monetary process. Our country’s once idealistic and industrious free market economy has been hijacked and is undeniably being fraudulently and overtly financialized by the craven clutches and maniacal machinations of a contemptible self-seeking banking class. They have become nothing more than avaricious parasites disgustingly feeding from the grand trough of our treasured human ingenuity and self-respecting industry.
Unproductive asset classes of every shape and form are surging in price everywhere as the pumped up folly of the perpetually spewing free money fire hose incessantly flows. Both privileged institutional and private favored recipients of the free flowing Fed funds are climbing all over themselves snatching up existing assets of all kinds, in a vulgar and narcissistic ferocious feeding frenzy. The gluttonous menu includes: Housing, Commercial Property, Farm Land, Fine Art, Vintage Collectibles, Classic Automobiles, Equity Indexes, ETFs, REITs, Options, Currencies, Futures, Precious Metals and Commodities………………………etc.
The brilliance and magnificence of the United States was always characterized by its thriving, hard working and tremendously productive middle class. Today’s disgraceful paper printing artifice that we are currently witnessing is slowly but surely destroying that once proud, noble and unparalleled historic human achievement which was distinctively made in the USA. The diseased America has now set upon the degrading and ignoble course of abusing its hard earned reserve currency status via cheap and decadent monetary debasement in order to save its own deplorable hide, and much of the world is compelled to follow our disgraceful lead as the global financial system continues to circle the descending drain’s virulent vortex.
Astoundingly, even after the devastating economic hardship millions have recently endured, directly due to the destructive consequences of a deliberate, blatantly self serving and utterly unrestrained monetary policy, the Federal Reserve banking cabal remains entirely undeterred. Incredibly, our ignoble and reprehensible financial leadership has once again set out to grossly and irresponsibly inflate yet another set of still more disastrous asset bubbles via the sheer folly of their lethal ZIRP/QE overdose injections. However, this time around they have insanely outdone themselves, glibly generating two gigantic financial doomsday balloons which are rapidly flashing red warning signs of catastrophic consternation