“Fed has created a world where best action may be cash out, not buy high, and wait. Can’t squeeze water from rock. Wait for the rain.”
John Hussman


“Fed has created a world where best action may be cash out, not buy high, and wait. Can’t squeeze water from rock. Wait for the rain.”
John Hussman
That chart makes perfect sense to me.
::end /sarc::
Of course, I am a dumbass. Really.
Doug, keep posting your song, eventually it will become a hit. Constant play worked for el chombo:
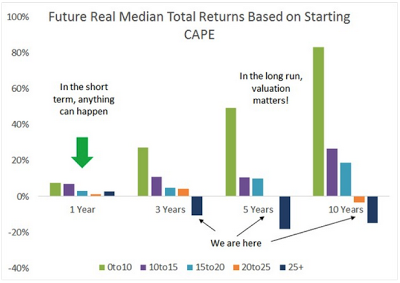
So… what do the colors represent? 0-10 …what? Some units would be helpful.
Froggy,
The colors correspond to the CAPE value. Green is a starting CAPE value of 0-10. So, the left-most cluster of bars represent the expected return one year later. For example, if the CAPE is currently at 0-10, one year later it averages a ~7% – 8% return. If the CAPE is currently at 10-15, the average return is slightly less. If the CAPE is currently at 15-20, the average return is expected to be around 4%-5% one year later. If CAPE is currently at 20-25, the average return is expected to be around 1%-2%. And if the CAPE is currently at 25+, the average return is expected to be around 3%-4% one year later.
Now, take those same time starting CAPE values, but extend the time frame from one year to five years later. What kind of average returns would the average investor expect to see? According to the chart, if the investor started investing when the CAPE was between 0-10, we could expect to see an approx 50% return–five years later. If the investor started investing when the CAPE was between 10
15 or 15-20, the average investor could expect to see average returns of around 10%, and a return of approx 0% if he started investing when the CAPE was between 20-25. And, not surprisingly, if the investor put money to work in equities when the CAPE was 25 or higher, then his expected average return would be a whopping negative return of almost 20%!
As of Apr 25, the CAPE was 25.16 (see: http://www.multpl.com/shiller-pe/ ). Can it go higher? Much higher? Sure; 1929 & 1999 bear witness to this. But look at the S&P500 index 3, 5, and 10 years after these two high points (see: http://www.multpl.com/s-p-500-price/ ). Not a pretty picture, is it?
farragut
That’s exactly what I thought it meant. I just wasn’t 100% positive.