

Submitted by Charles Hugh-Smith of OfTwoMinds blog,
The unintended consequences of the Fed’s unprecedented interventions will rip the heart and lungs out of the housing market
The housing “recovery” since 2010 can be summarized in four phrases: diminishing returns, unprecedented central state/bank intervention, unintended consequences, end-game. Three charts from our friends at Market Daily Briefing and one of the Case-Shiller Home Price Index tell the story.
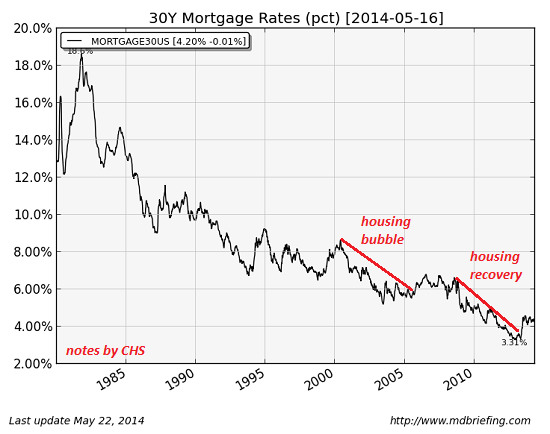
Let’s start with what we all know: declining mortgage rates, mortgage securitization, poorly regulated/unregulated no-document, no-down mortgages, easy credit policies of the Federal Reserve and massive Federal subsidies of housing and mortgages fueled an unprecedented housing bubble from 2001 to 2007.
The index of major housing markets rose from 80 to 227–a staggering 280% rise in a few years.
The housing bubble was a classic Ponzi Scheme. A recent article in Scientific American explains that Ponzi schemes do not require a fraud–all they require is the belief that another buyer will pay significantly more for an asset than we did: The Whole Economy Is Rife with Ponzi Schemes (subscription required; look for the June issue at your local library).
This bubble dynamic needs nothing more than a supply of greater fools willing to pay substantially more for assets that haven’t changed qualitatively or quantitatively, and our expectation that the supply of greater fools is endless.
Alas, the number of people willing and able to borrow immense sums to buy more houses eventually falls below the number needed to sustain the bubble, and the bubble promptly implodes.
The Federal Reserve responded to the bubble collapse with unprecedented intervention to prop up housing values: the Fed dropped short-term interest rates to near-zero (i.e. ZIRP, zero-interest rate policy) and bought roughly $2 trillion of mortgage-backed securities in two waves. (That’s about 20% of the entire U.S. mortgage market.)
In this chart, we see the original housing bubble and the echo bubble blown by the Fed’s unprecedented interventions.
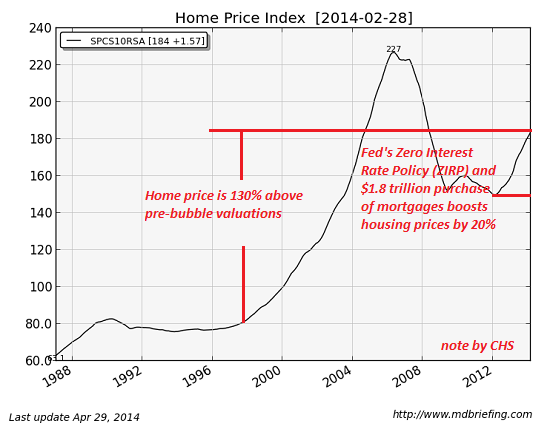
The home price index is now roughly 130% above its pre-bubble levels.
Not unsurprisingly, the housing market responded to the end of the Fed’s first wave of mortgage buying by tanking. The Fed quickly launched a second monumental wave of mortgage purchases, and this corresponded to a renewed surge in housing prices.
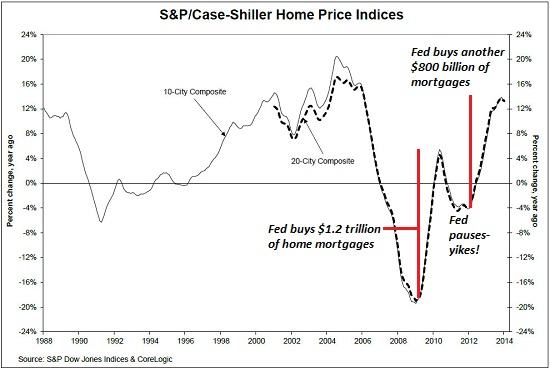
A decline of just over 2% in mortgage rates helped push the housing bubble to insane heights. The Fed’s unprecedented interventions pushed mortgage rates lower by almost 3% at the bottom, and housing prices rose by about 20%.
That’s called diminishing returns: The Fed has pulled out all the stops in its support of housing (as have the Federal housing agencies such as FHA), yet housing managed only a weak 20% expansion on the back of this extraordinary, multi-trillion-dollar manipulation (oops, I mean intervention).
The Fed’s policies of unlimited liquidity and zero-interest rates have generated an unintended consequence: the super-wealthy financiers closest to the Fed’s money spigot can borrow money to buy housing at absurdly low rates, while regular home buyers have been largely frozen out of the market as a result of 1) bidding wars with all-cash investors desperate for yield in a zero-rate environment and 2) banks that have tightened lending standards as rates have plummeted and risk has finally been priced into the housing market.
(Recall that virtually the entire mortgage market is Federally backed/subsidized; in effect, the mortgage market in the U.S. has been fully socialized, with taxpayers on the hook for all the debt guaranteed by Federal agencies.)
The echo bubble is entirely driven by all-cash purchases by investors desperately seeking some sort of yield in a Fed-engineered low-yield economy via rental housing. Investors driven to extremes by the Fed’s interevention are the greater fools, and the supply of these greater fools is finally diminishing. Once the pool of greater fools evaporates, the echo bubble will burst, just like the initial bubble burst.
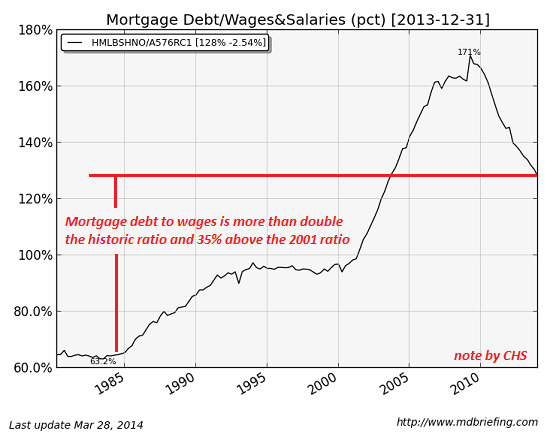
Meanwhile, back in the real world where mortgages are serviced by earned income (wages and salaries), the ratio of mortgage debt to wages/salaries is still roughly double historical ratios. The debt/wages ratio rose in the go-go years of the dot-com stock market bubble, as rising wealth encouraged the belief that higher debt levels would be offset by rising income and stock market wealth.
But the current ratio is still 35% higher than the late 1990s.
Now we discern the end-game: the pool of greater fools is evaporating as prices reach nosebleed territory and newbie rental-housing investors discover houses and renters have all sorts of real-world issues that paper wealth doesn’t have. In other words, that promised 6% net yield is not guaranteed, but is fraught with risks– especially in a recession, where renters stop paying and the pool of renters able to pay sky-high rents dries up.
Since average wage earners are effectively frozen out of the market, that leaves current homeowners who are selling and “moving up”. Oops: 20% of all homeowners are effectively underwater and cannot sell/buy another home. Housing debt still traps 10 million Americans.
The returns on the Fed’s unprecedented interventions are diminishing, the pool of greater fools is shrinking, households are either underwater or frozen out of the market, and the economy is supposedly healthy.
So what happens when investors lose their appetite for housing? What happens when the economy slips into recession? What happens when the Fed’s purchases of mortgages slacken or end?
The whole echo bubble is based on unsustainable extremes of interest rates, central-planning intervention and investor fantasies that the supply of greater fools will never decline. If history is any guide, rates will rise (albeit modestly), the economy’s “recovery” will end in recession, the Fed’s manipulation will cease having any positive returns while the unintended consequences of the Fed’s unprecedented interventions will rip the heart and lungs out of the housing market.

I sees no charts.
I posted, a few days ago, that derivatives outstanding were 75 quadrillion worldwide.
Correction:
According to the Bank for International Settlements, the total notional value of derivatives contracts around the world has ballooned to an astounding 710 trillion dollars ($710,000,000,000,000). Other estimates put the grand total well over a quadrillion dollars.
Then again, what does it matter if it’s $1 quadrillion or $710 trillion.
Since the collateral on that $710 trillion ranges from wishful to ethereal to non-existent, the entire sum is properly seen as deflation’s potential. That’s why inflationists are wrong to focus on higher prices paid for groceries, health insurance, college tuitions and such. Compared to the incipiently deflationary juggernaut represented by the derivatives markets, “lettuce bin” inflation is not even a drop in the bucket.
It does help when the charts actually show up.
Ecoman , the difference is 290 Gazillion. GOD ,your such a dumb ass.