

Off the microphones of Ron Patterson, Monsta and RE
Follow us on Twitter @doomstead666
Friend us on Facebook
Aired on the Doomstead Diner on July 31, 2014

Discuss this Interview at the Energy Table inside the Diner
Ron Patterson has a long history following the Peak Oil phenomenon, know by many veterans of The Oil Drum as Darwinian.
Since the demise of TOD, Ron has been running PeakOilBarrel.com, where he presents current analysis of what is coming down the pipe, literally.
Based on his current analysis, Ron expects that Peak Production on Crude Oil is current in 2013-15, and decline will begin seriously in 2016. Below you find the most recent list charts from Ron.
In the interview, we look at the data and projected possibilities and effects as the decline in production accelerates over time.
Further discussion with Ron on the possible outcomes of Peak Oil are explored in Part II, coming soon on the Diner.
Here is the most recent list of charts from Ron:
Anticipating the Peak of World Oil Production
These are indeed good times to be a Peak Oiler. All the peak oil deniers are dancing with wild exuberance, pointing to that spike of US shale oil production that they believe drives the final nail in the “Peak Oil Theory” coffin. And it is all happening right before reality slaps them in the face.
There is no doubt that world Crude + Condensate production, without that tight oil spike, has been on a ten year bumpy plateau.
But, you may ask, when the shale bubble burst, won’t that only mean we will still stay on that bumpy plateau? No for several reasons. First the bursting of the shale bubble will likely cause a decline in US production of perhaps half a million barrels per day per year for three to four years. Second Russia, whose production increase of over 1.5 million barrels per day over the past ten years has kept us on this bumpy plateau, is now in decline.
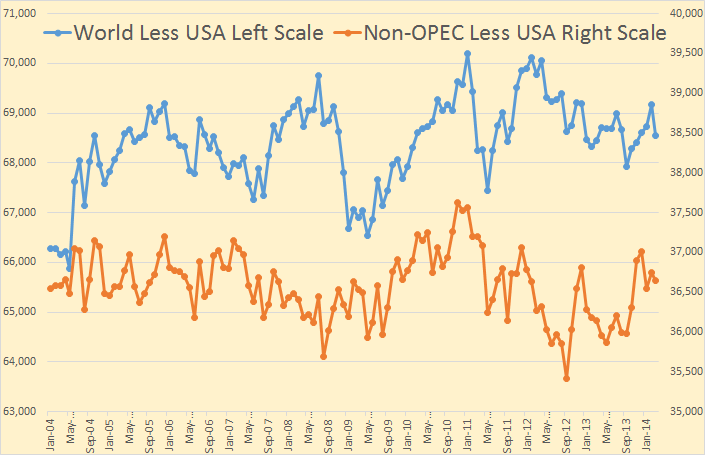
And third, five nations that have shown considerable increase over the past few years now seem to have peaked.
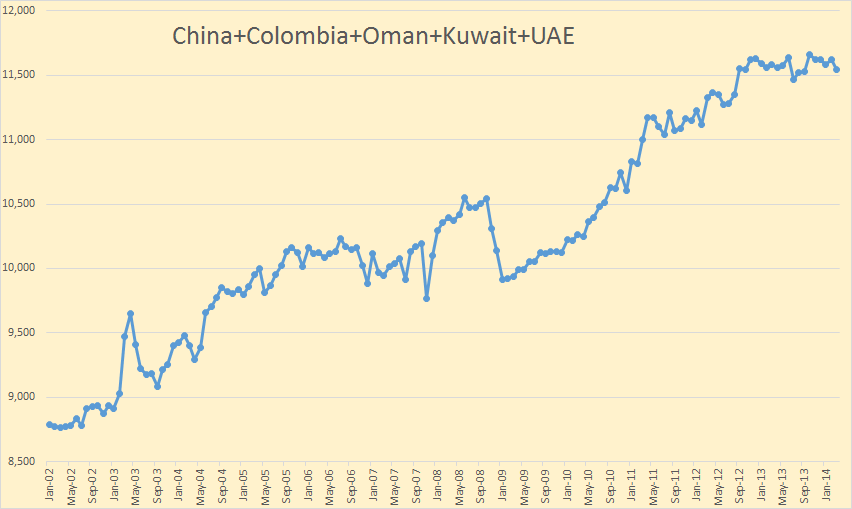
These five nations, who’s 2 million barrel per day increase since mid 2004, have also kept us on that plateau. Their combined production plateaued a year and a half ago. I don’t expect them to decline very fast but they will not add anything to world production in the next few years.
The only nations that are not at or near their peak are Canada, Kazakhstan and Iraq. Kazakhstan hopes to bring the much delayed and way over budget Kashagan field on line in 2016. The once hoped for 1.5 million barrels per day output from Kashagan now appears to be greatly downgraded. Downgraded perhaps to well under .5 million barrels per day.
Iraq, in light of the ongoing conflict there, is unlikely to increase very much if any at all in the next five years or so. In fact Iraq’s production will very likely fall in the near future. Canada will likely continue to increase tar sands production at a slower rate.
But back to Russia!
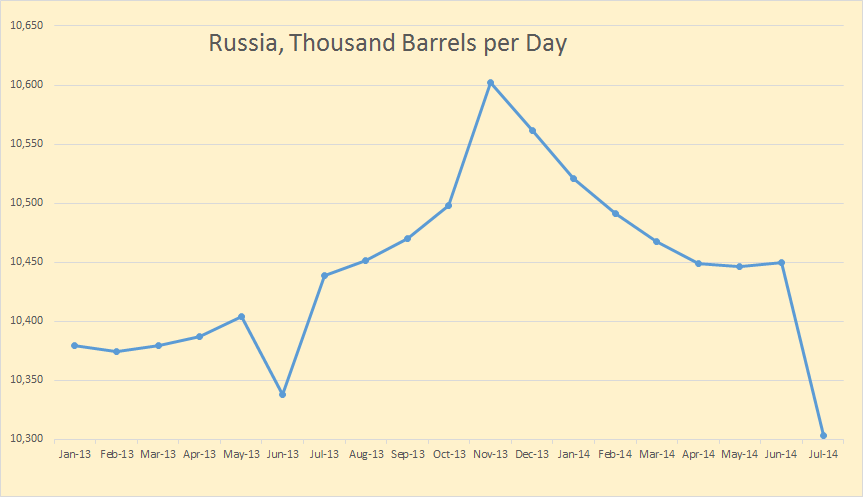
Jodi has Russia peaking in November 2013 at 10,127,000 bp/d. The EIA has them also peaking in November at 10,209,000 bp/d. The Russian web site CDU TEK has them peaking at 1,458,000 tons per day. Figuring 7.27 barrels per ton that comes to 10,602,000 barrels per day. I think the EIA figures are the closest but anyway….
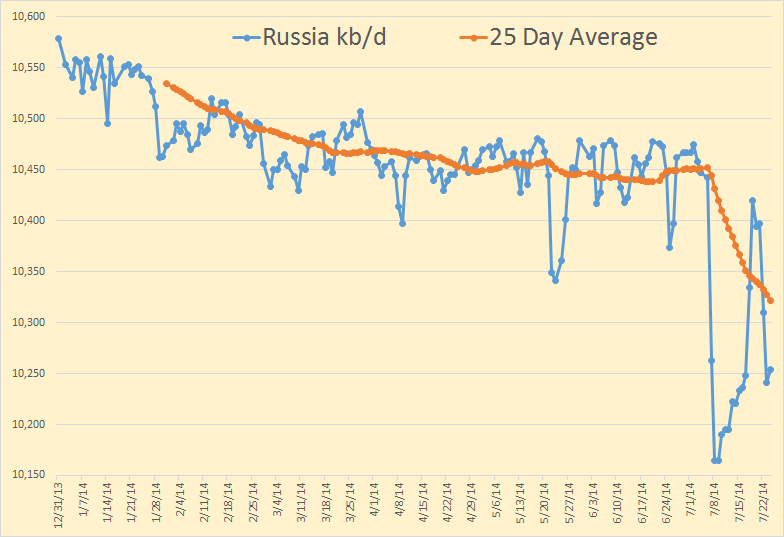
This is a daily chart of 2014 using 7.27 barrels per ton. Both this and the monthly chart are through July 24th. The spikes down in July are an anomaly, most likely caused by pipeline shutdowns due to Siberian wildfires. However I expect the August numbers to be considerably lower than the June production numbers.
Bottom line, there is no doubt that Russia is now in decline and with the political problems there now the problem is likely to get worse, perhaps a lot worse. Here is what Ambrose Evans-Pritchard writing in The Telegraph says, bold mine:
The proposed sanctions will target both the debt and equity of Russia’s major banks, effectively severing access to global capital markets. It also targets the technology for drilling in the Arctic and for opening up the Bazhenov shale basin, both needed to replace Russia’s depleting oil reserves.
Russia has a lot of gas, but gas trades at an oil-equivalent price of $60bn a barrel in Europe. It is not very profitable. Analysts suspect that Gazprom’s pipeline deal with China is at or below the break-even cost of production, assuming it ever happens.
The International Energy Agency says Russia needs $750bn of fresh investment over the next 20 years just to stop oil and gas output declining. This has already become unthinkable. Who is going to wager so much money, for such questionable returns, in the face of so much political risk?
Unthinkable indeed, and then this: Russia Oil Exports by Sea to Reach 6-Year Low
Seaborne crude shipments from the world’s biggest energy exporter via the state-run pipeline system in August will fall 9.2 percent from this month to 2.215 million barrels a day, according to loading programs obtained by Bloomberg News. That’s the lowest since Bloomberg began tracking the data in 2008. Russia’s two biggest crude terminals, Primorsk and Novorossiysk, will both export the least on record.
I don’t understand why these Russian oil production and export problems are not all over the news? They should be headlines but using google news “Russian Oil Production” you get almost nothing.
Okay we have discussed Russia, the USA, Kazakhstan, Canada and Iraq, and the five countries in the second chart up top, China, Colombia, Oman, Kuwait and the UAE, but what about the rest of the world? What can we expect from them?
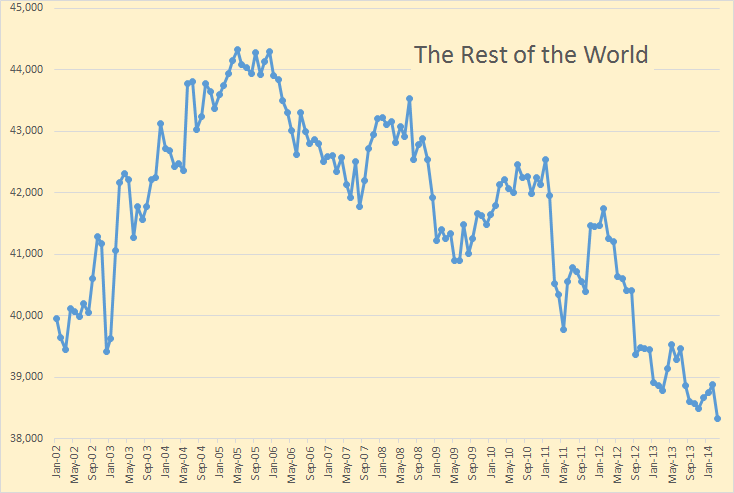
We can expect them to keep doing what they have done for since peaking in 2005, they will continue to decline. Combined they have declined 6 million barrels per day in the past nine years. I don’t expect that decline rate to slow.
I will close this post with one of Gail Tverberg’s charts from her latest post:
World Oil Production at 3/31/2014–Where are We Headed?
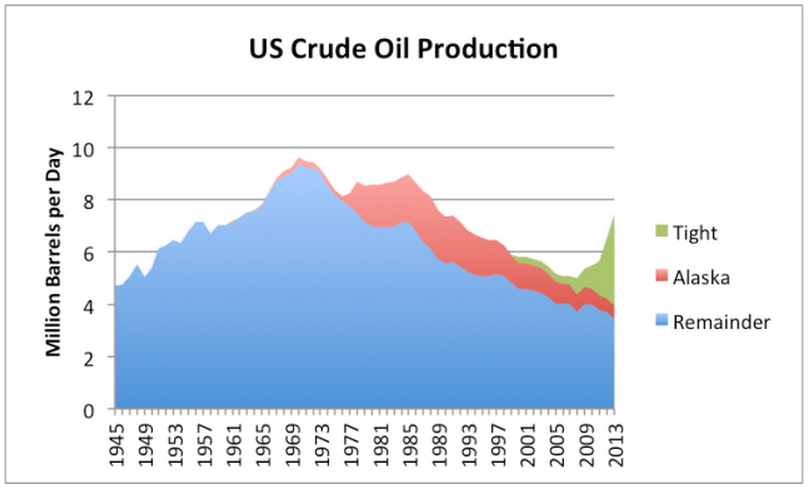
See that little green spike on the very right of the chart? That is what the peak oil deniers are all cheering about. That little spike is responsible for the death of peak oil, or so they think. Boy are they in for a shock.

RE,
You and this Doom Dinner peak oil BS, did you know that a tanker left Gulf of Mexico yesterday full of
unrefined oil for Korea. The shale oil retirement party is here and enjoy it while it last, as I’m afraid the party has peaked. Good rant.
The level of [b] BULLSHIT[/b] with respect to Energy Extraction Globally is beyond belief.
It is quite obvious that cheap energy is HISTORY.
Also obvious is that even with energy cheap, over the last century we worked up a bill that cannot be paid off.
[b]You can’t fix stupid though.[/b]
[img [/img]
RE
BAH
I really need to remember when to use HTML instead of BBcode.
Can we get an edit function here maybe?
RE
It strikes me that A) anyone with a history at TOD is a bit short of credibility from having claimed all this same stuff some 6 years ago now, and B) the key to US increased production isn’t its size, but its existence (according to ANY peak oiler circa 2007 or so) and C) it was easily visible prior to that because before 2007 you could see the shales building US natural gas production to a new peak oil…just as oil production appears to be headed.
So the question is, how many times can people make the same mistake? Based on past claims of peak oil that never happened, or DID happen…and then were reversed and yet new heights were achieved later…when do peak oilers start estimating THAT? How many more bad claims do they plan on making when it comes to their resource economic expertise? 2 more mistakes? 5?