

Based on the average of four separate valuation models that have been accurate in assessing whether the stock market is overvalued or undervalued over the last century, the stock market is currently over valued by 89%. The stock market was overvalued by 88% before the 1929 Crash. It was “only” overvalued by 74% in 2007 before the last Crash. It has only been more overvalued once in market history – 2000. I wonder what happened after that?
If you were paying attention in Statistics class in college, you know that when something reaches 2 standard deviations from the mean, you’ve reached EXTREME levels. The market valuation is now past 2 standard deviations. Anyone staying in the market or buying today is betting on the market to reach 2000 internet bubble proportions. I’ll pass. You will be lucky to “achieve” a negative 2% nominal return over the next ten years. After taking inflation into account you will likely end up with a -5% to -10% annual return, with a crash thrown in for good measure.
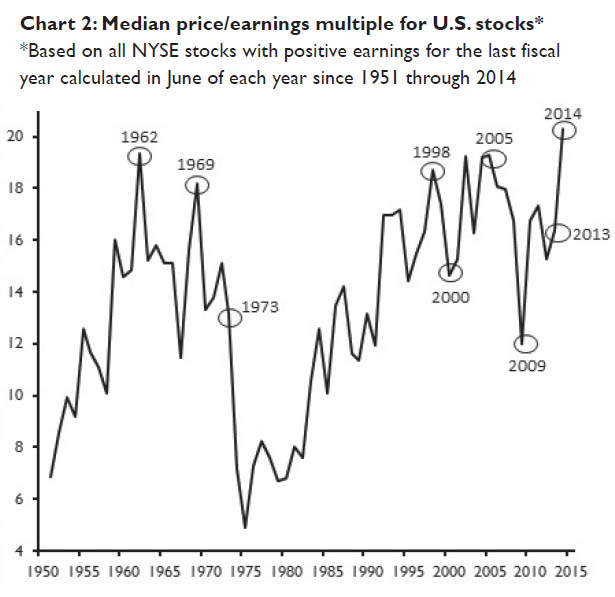
Betting on a 2000 level of overvaluation is even more foolish when you take into account the fact the overvaluation was centered solely on tech and internet stocks. Large cap value stocks were significantly undervalued in 2000. The chart below from former perma-bull Jim Paulson at Wells Fargo reveals the foreboding truth. The median price/earnings ratio is now the highest in U.S. history. It is 45% higher than it was in 2000. It is 15% higher than it was in 2007.
John Hussman answers a few pertinent questions below. But the gist of the situation is simple. The stock market is overvalued equal to or more than it was in 1929, 2000, and 2007. The reason it has gotten this far is the $3.5 trillion of Federal Reserve fiat handed to the Wall Street banks and the ridiculous faith in these Ivy League educated puppets to engineer never ending stock market gains.
Greed has been winning for the last five years. Fear has been creeping in, especially since QE3 ended in October. The increased volatility is a warning signal. Fear will be reasserting itself, and it will happen suddenly. Buying the dip will stop working. Faith in central bankers will dissipate and reality will be a bitch. This episode of delusion will end just as all the previous episodes of delusion ended. See the chart above. What goes way up, eventually goes way down.
Q: Doesn’t QE, zero interest rate policy and (insert your excuse for ignoring history here) mean that this time is different?
A: Not really. The main thing that has been legitimately “different” in the half-cycle since 2009 is that QE loosened the overlap and increased the delay between the emergence of extremely overvalued, overbought, overbullish syndromes and the onset of risk aversion among investors. The fact that QE-induced yield-seeking could induce such a sustained gap between these two was clearly a surprise to us. However, it remains true that once market internals and credit spreads indicate a shift in investor risk preferences, stocks are prone to abrupt losses – particularly when overvalued, overbought, overbullish conditions have recently been in place. This has been true even in instances since 2009.
Q: Why are market internals and credit spreads deteriorating?
A: Historically, the “catalysts” that provoke a shift in risk aversion typically become clear only after the fact. Our impression is that the plunge in oil prices and safe-haven Treasury yields, coupled with the rise in yields on default-sensitive assets such as junk debt is most consistent with an abrupt slowing in global economic activity.
Q: Is the market likely to crash?
A: We certainly wouldn’t rely on a crash, but frankly, we currently observe nothing that would prevent something that might feel like an “air pocket” or “free fall.” Crashes represent points where many investors simultaneously shift toward risk-aversion and too few investors are on the other side to buy the stock offered for sale – except at a sharp discount. They have tended to unfold after the market has already lost 10-14% and the recovery from that low fails. We would allow for that possibility, but our discipline is firmly centered on responding to observable market conditions as they emerge, and shifting as those conditions shift.
Read all of John Hussman’s Weekly Letter

Bring it on. This house of cards needs a hard wind to help the needed reset.
Bob Dylan was right:
“A Hard Rain’s A-Gonna Fall”
Oh, where have you been, my blue-eyed son?
And where have you been my darling young one?
I’ve stumbled on the side of twelve misty mountains
I’ve walked and I’ve crawled on six crooked highways
I’ve stepped in the middle of seven sad forests
I’ve been out in front of a dozen dead oceans
I’ve been ten thousand miles in the mouth of a graveyard
And it’s a hard, it’s a hard, it’s a hard, and it’s a hard
It’s a hard rain’s a-gonna fall.
Oh, what did you see, my blue eyed son?
And what did you see, my darling young one?
I saw a newborn baby with wild wolves all around it
I saw a highway of diamonds with nobody on it
I saw a black branch with blood that kept drippin’
I saw a room full of men with their hammers a-bleedin’
I saw a white ladder all covered with water
I saw ten thousand talkers whose tongues were all broken
I saw guns and sharp swords in the hands of young children
And it’s a hard, it’s a hard, it’s a hard, and it’s a hard
It’s a hard rain’s a-gonna fall.
And what did you hear, my blue-eyed son?
And what did you hear, my darling young one?
I heard the sound of a thunder that roared out a warnin’
I heard the roar of a wave that could drown the whole world
I heard one hundred drummers whose hands were a-blazin’
I heard ten thousand whisperin’ and nobody listenin’
I heard one person starve, I heard many people laughin’
Heard the song of a poet who died in the gutter
Heard the sound of a clown who cried in the alley
And it’s a hard, it’s a hard, it’s a hard, it’s a hard
And it’s a hard rain’s a-gonna fall.
Oh, what did you meet my blue-eyed son ?
Who did you meet, my darling young one?
I met a young child beside a dead pony
I met a white man who walked a black dog
I met a young woman whose body was burning
I met a young girl, she gave me a rainbow
I met one man who was wounded in love
I met another man who was wounded in hatred
And it’s a hard, it’s a hard, it’s a hard, it’s a hard
And it’s a hard rain’s a-gonna fall.
And what’ll you do now, my blue-eyed son?
And what’ll you do now my darling young one?
I’m a-goin’ back out ‘fore the rain starts a-fallin’
I’ll walk to the depths of the deepest black forest
Where the people are a many and their hands are all empty
Where the pellets of poison are flooding their waters
Where the home in the valley meets the damp dirty prison
And the executioner’s face is always well hidden
Where hunger is ugly, where souls are forgotten
Where black is the color, where none is the number
And I’ll tell and speak it and think it and breathe it
And reflect from the mountain so all souls can see it
And I’ll stand on the ocean until I start sinkin’
But I’ll know my song well before I start singing
And it’s a hard, it’s a hard, it’s a hard, and it’s a hard
It’s a hard rain’s a-gonna fall.
Ratio of US stocks vs rest of world at record high, exceeds dot-com bubble peak in 2001
[img :large[/img]
Even Warren Buffett Must Be Getting Concerned At This Market
Submitted by Thad Beversdorf via First Rebuttal blog,
I’ve recently taken on the challenge to work through various indicators that I believe are part of the giant con that America is still enjoying growing economic prosperity. The basis for doing this is that I have a very difficult time accepting that while real median incomes and real wages are declining that the nations standard of living or economic prosperity is increasing. The coexistence of such realities simply does not foot. Pouring over various datasets it becomes obvious that the ‘bridge’ between rising GDP and a declining economy is debt. Literally every relevant dataset I run over the past 50 years tells exactly the same story. That while demand has struggled due to real flat or declining income, economic ‘growth’ has been merely a function of debt principal, both national and consumer.
And as I’ve discussed in depth lately, GDP is supposed to equate to and thus represent total national income, however, it is being overstated because we are adding total additional debt into our change in GDP each period. The problem with that is for each additional dollar we have taken on since the mid 1970′s we’ve generated less than a dollar of output (i.e. income). And so we are losing money on each dollar requiring ever more debt to cover the losses and lack of natural growth. Further, calculating debt as income seems completely contradictory to what we do at the individual level. Certainly none of us add in the additional debt we take on each year and count that toward our income level. The reason we don’t is because we understand that at some point that has to be paid back with interest. And so we don’t identify additional debt as additional prosperity. It just doesn’t make sense.
In order to get to a GDP figure that more closely represents the nations true economic prosperity I adjust GDP and change in GDP for changes in debt at both the consumer level and at the Federal level. What we find is that we have not had true growth in economic prosperity since the early 1970′s with the exception of a four year period between 1996 and 2000. And we have seen a collapse in economic prosperity over the past 6 years. I find myself debating with people all the time who continue to tout the all time high market valuations are based on an improving economy and it really winds me up. I throw out facts and figures and get just a lot of conjecture in return, like my recent debate with the CIO of BMO.
One of the metrics people point to all the time is the Buffet indicator. They tell me things may be slightly overvalued relative to history but that we are still well below the overvaluations we saw in 2000. I’ve struggled with that one. I see they are right and I knew something seemed really off about it. Real median incomes have been declining since 1998, U6 unemployment rate for the past 6 years has remained at least double what the worst one period read was between 1998 and 2007 and the labour participation rate is lower than it has been since 1977 when few women were yet to venture outside the home. And forget about revenue. Despite 5% population growth ing the past 6 years real S&P sales are lower than they were 6 years ago. These should be devastating realities to the economy so then how is it that these all time high stock valuations can be lower than they were in 2000 relative to the economy?? Well thanks to a discussion with a good friend from North Carolina today (h/t Mr. McCabe) we talked right into the answer. It’s the same as every other economic distortion. Debt!
When we just think logically about it everyone knows we added $10 trillion of public debt over the past 7 years but no one ever seems to adjust any metrics for the insane amount of debt and the obvious implications and distortions that come along with it. We just keep on calming calculating with the blinders on. And so I’ve taken an adjusted GDP figure (excluding growth due only to additional debt principal) and run it against the Wilshire 5000 to get an Adjusted Buffet Indicator. And what we see is the true overvaluation of today’s markets. All data is pulled from St. Louis Fed except Wilshire data which I pulled from Wishire.com.
[img [/img]
[img [/img]
What we see is that the adjusted Buffet Indicator essentially mirrors the original Buffet Indicator from 1970 through 2000 when it dislocates slightly through 2008 at which point it completely dislocates. The adjusted indicator is nearing 3.72 standard deviations above the mean. Comparatively the original indicator had its highest overvaluation in 2000 at around 1.79 standard deviations above the mean. This suggests today’s true market valuation is more than twice the previous all time high in 2000.
This again makes sense when we start realizing we have to begin adjusting things for the incredible amount of debt we’ve taken on over the past 6 years. We simply cannot just turn a blind eye to the debt. And that is exactly what every government agency is doing. Where are they adjusting for the massive future drag on growth? Nowhere! You cannot borrow unlimited amounts of money and simply pretend like it isn’t happening!! If you could everyone would do it. Ask yourself where would GDP be if we hadn’t taken on $10 trillion of debt. And if you think it would be close to the same well then why in the hell did we take it on? Someone should go to prison because it’s costing us $250 billion per annum.
Hopefully you get the point that we MUST adjust our economic indicators for the enormous amount of debt. To simply pretend it doesn’t exist or has no material implication on the our prosperity is really beyond my ability of tolerance. I leave it with you to start thinking about how the additional $10 trillion in debt should start being adjusted out of the infinite ‘positive’ indicators of economic strength being thrown around by all the Krugman wannabes out there.
Stocks Post Steepest Post-Open Crash In Two Years
Submitted by Tyler Durden on 01/12/2015 09:51 -0500
Well that escalated quickly: This is the biggest drop in the S&P during the first few minutes of trading since at least 2012, a move which has all but erased the gains from Charlie Evans’ “catastrophe” call last week.
Admin,
Have you read Ann Barnhardt’s latest?….
Re: Citigroup money laundering
I can’t seem to do a link
Hi Maddie’s Mom
I don’t visit Ann’s site too often. Too much religious crap. Here is the link.
Thanks Admin.
Any thoughts?
Ann’s connecting of the dots certainly seems logical. Citi did write the language for the Cromnibus bill which put their derivatives on our backs. That Saudi prince does own a major chunk of Citi. This would explain why Saudi Arabia seems unconcerned about falling oil prices.
They should let Ann quiz Grandma Yellen at her next press conference.
Went to Yahoo to check the market today. Top story – who was wearing what at the Golden Globes. All is well.
wyoming Mike
Did you notice that some transgender show from Amazon won all the awards even though no one has ever seen it? Hollywood and their ilk are so transparent (the name of the show) in pushing their gay and feminist agenda. It makes you want to puke.
I have nothing against gays but the way the media pushes it, you would think every other person walking around is one. It’s kinda fucking annoying actually.
Re Spin & Admin: Seems to me the LGBT spin from Hollywood & the MSM is magnified by at least 20 to 1 over reality. Personally I think it’s a recruiting effort. Hell, even Judge Judy has way more LBGT as a percentage of “cases” than real world; I bet it’s a least 10 to 1.
I could care less what they do in their lives, but get it outta my face.
It chaps my ass they way they try to shove the homo agenda down everyone’s throat. They love to throw out the 10% gay bullshit like it is fact, when every study puts it more like 2%.