

Guest Post by Dr. Housing Bubble
The most widely used measure for inflation is the Consumer Price Index (CPI) put out by the Bureau of Labor and Statistics (BLS). Nearly a decade ago I discussed how poorly a job the CPI did in measuring home price increases while they were happening. In fact, during the raging housing bubble the CPI only measured moderate increases in home prices. Why? The measurement looks at something called the owners’ equivalent of rent (OER) that essentially considers what your home would rent for versus your actual housing payment.
So you could be paying $3,000 in a mortgage, taxes, and insurance but the actual rent would be something like $2,000. That is a massive differential. In the LA/OC market, this measurement did a horrible job. The argument of course is that rents eventually catch up and we are seeing some of that now. Yet Fed policy and other government decisions are made on the basis of the CPI and miss big changes by years. The latest CPI report is now showing this inflation creeping in but of course, it is late once again. And this is important to address because the largest component of the CPI is housing costs.
The problem with the CPI and housing
Housing makes up over 40 percent of the CPI tool which is a by far, the biggest component. So wouldn’t you want this instrument to accurately measure home value changes? We now have plenty of tools that can give a better indicator of home price changes like the Case-Shiller Index. There has been large pressure on home prices recently thanks to many years of slow home building and a lack of inventory. We also had the interesting phenomenon of investors diving into the market since the crash and being a dominant force.
First, it might be useful to look at how the CPI is composed:
Even looking at three categories in housing, education, and healthcare we know that costs are soaring. Yet the overall CPI has showed only tiny increases in prices. This is completely off base nationally and doubly so in bubblicious markets like California where people need to move into apartments with roommates as if they were crowding into clown cars to make the rent.
Housing is a whopping 42 percent of the CPI measure. Most people in the US own their homes (not in places like L.A. County). The measure looks at the nation overall. If you are trying to get a good measure, why not look at the Case-Shiller Index? Instead, it looks at what you could get in market rents for your home (and this indicator is weak at turning points as well). Just take a look at the OER component versus actual home price changes:
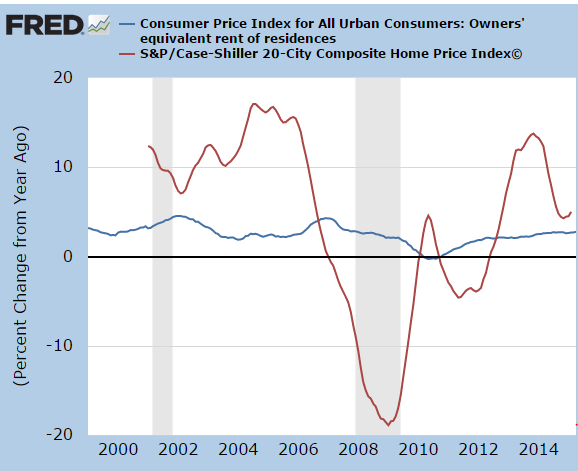
So from 2013 to 2014 home prices went up by double-digits but the OER went up 2 percent! The biggest component of the CPI is totally off base. Take for example this snapshot:
November 2013
Case Shiller Index y-o-y change: 13.7 percent
CPI OER y-o-y change: 2.3 percent
Even during the crash the measure was off:
February 2009
Case Shiller Index y-o-y change: -18 percent
CPI OER y-o-y change: 2 percent
You might as well set the OER at the proverbial 2 percent and forget it. How useful is that? Sure, it serves the Fed’s purpose of keeping monetary policy lax and money flowing. Yet this also fuels the mad speculation we are living through. Housing bubble 1.0 was a nationwide affair while housing bubble 2.0 is being driven by investors. In the end prices are going up for unbalanced reasons. Rents are going up strongly while wages are stagnant. What this means is more money is funneled into the banking, financial, REIT, and investor class. Not a good thing in our consumerist economy.
As I mentioned, the OER even does a bad job measuring rent changes:
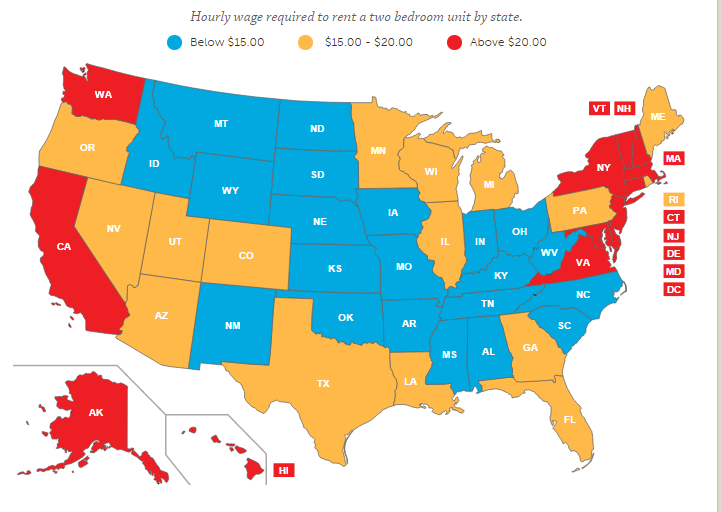
In many areas, people can’t even afford the local area rents, let alone buy. This is why we have 2.3 million adults living at home with parents in California. So of course the Fed continues to push forward with negative interest rates and continues this current trend. They keep talking about rate hikes but this has been going on for two years – like the boy calling wolf, no one is really listening anymore. In many ways, the Fed has backed itself in a corner. Yet they are using the CPI as reference that all is well on the inflation front. Just look at your monthly bills and see how accurate this. Better yet, take a look at your budget from 2000 and see where things are today.
One thing that does happen though is that rents do increase after a boom in home prices but lag the trend by a few years. That is why the recent CPI was a “shock” because now the rental increases are filtering into the CPI after a few years of solid price gains in home prices. The reality is now filtering even into juiced up metrics. Just take a look at the Case-Shiller annual changes versus the OER index changes. One looks like a boring flat line and the other looks like a wild tech stock. Easy money in the housing market is definitely the name of the game.

Government statistics are not produced to reflect reality; their purpose is to advance a narrative.
Price inflation will always be higher than CPI. GDP will be propped up no matter what happens in the real world. The same holds true for the ridiculous unemployment statistics.
Governments always lie. Simply assume ever stat is rigged. Better yet, ignore them altogether. It’ll keep you sane.
Steve , are you sure you know what you think you know?What you lack is a 10 dollar calculator.Now be a good boy and go to Wal-Mart.
bb……….Steve is correct, except that the statistical ‘lies’ are meant to install ‘Confidence’ in the public that the economy is just wonderful, all the time.