


Did you know that the percentage of children in the United States that are living in poverty is actually significantly higher than it was back in 2008? When I write about an “economic collapse”, most people think of a collapse of the financial markets. And without a doubt, one is coming very shortly, but let us not neglect the long-term economic collapse that is already happening all around us. In this article, I am going to share with you a bunch of charts and statistics that show that economic conditions are already substantially worse than they were during the last financial crisis in a whole bunch of different ways. Unfortunately, in our 48 hour news cycle world, a slow and steady decline does not produce many “sexy headlines”. Those of us that are news junkies (myself included) are always looking for things that will shock us. But if you stand back and take a broader view of things, what has been happening to the U.S. economy truly is quite shocking. The following are 12 ways that the U.S. economy is already in worse shape than it was during the depths of the last recession…
#1 Back in 2008, 18 percent of all Americans kids were living in poverty. This week, we learned that number has now risen to 22 percent…
There are nearly three million more children living in poverty today than during the recession, shocking new figures have revealed.
Nearly a quarter of youngsters in the US (22 percent) or around 16.1 million individuals, were classed as living below the poverty line in 2013.
This has soared from just 18 percent in 2008 – during the height of the economic crisis, the Casey Foundation’s 2015 Kids Count Data Book reported.
#2 In early 2008, the homeownership rate in the U.S. was hovering around 68 percent. Today, it has plunged below 64 percent. Incredibly, it has not been this low in more than 20 years. Just look at this chart – the homeownership rate has continued to plummet throughout Obama’s “economic recovery”…

#3 While Barack Obama has been in the White House, government dependence has skyrocketed to levels that we have never seen before. In 2008, the federal government was spending about 37 billion dollars a year on the federal food stamp program. Today, that number is above 74 billion dollars. If the economy truly is “recovering”, why is government dependence so much higher than it was during the last recession?
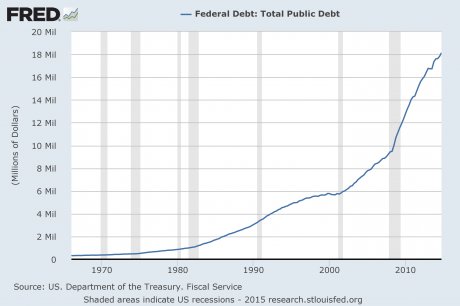
#4 On the chart below, you can see that the U.S. national debt was sitting at about 9 trillion dollars when we entered the last recession. Since that time, the debt of the federal government has doubled. We are on the exact same path that Greece has gone down, and what you are looking at below is a recipe for national economic suicide…
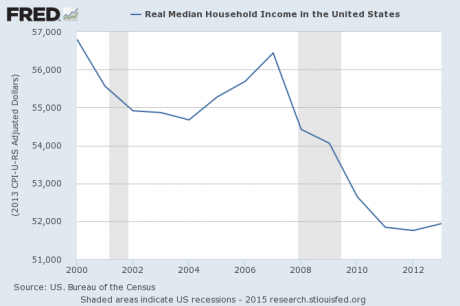
#5 During Obama’s “recovery”, real median household income has actually gone down quite a bit. Just prior to the last recession, it was above $54,000 per year, but now it has dropped to about $52,000 per year…
#6 Even though our incomes are stagnating, the cost of living just continues to rise steadily. This is especially true of basic things that we all purchase such as food. As I wrote about earlier this year, the price of ground beef in the United States has doubled since the last recession.
#7 In a healthy economy, lots of new businesses are opening and not that many are being forced to shut down. But for each of the past six years, more businesses have closed in the United States than have opened. Prior to 2008, this had never happened before in all of U.S. history.
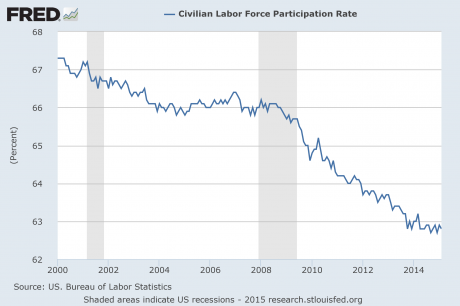
#8 Barack Obama is constantly telling us about how unemployment is “going down”, but the truth is that the percentage of working age Americans that are either working or considered to be looking for work has steadily declined since the end of the last recession…
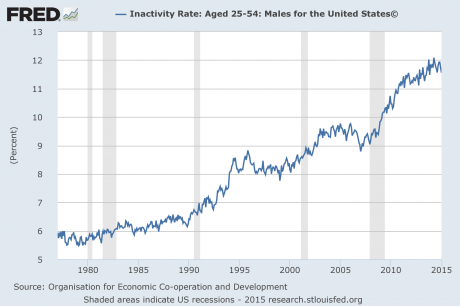
#9 Some have suggested that the decline in the labor force participation rate is due to large numbers of older people retiring. But the reality of the matter is that we have seen a spike in the inactivity rate for Americans in their prime working years. As you can see below, the percentage of males between the ages of 25 and 54 that aren’t working and that aren’t looking for work has surged to record highs since the end of the last recession…
#10 A big reason why we don’t have enough jobs for everyone is the fact that millions upon millions of good paying jobs have been shipped overseas. At the end of Barack Obama’s first year in office, our yearly trade deficit with China was 226 billion dollars. Last year, it was more than 343 billion dollars.
#11 Thanks to all of these factors, the middle class in America is dying. In 2008, 53 percent of all Americans considered themselves to be “middle class”. But by 2014, only 44 percent of all Americans still considered themselves to be “middle class”.
When you take a look at our young people, the numbers become even more pronounced. In 2008, 25 percent of all Americans in the 18 to 29-year-old age bracket considered themselves to be “lower class”. But in 2014, an astounding 49 percent of all Americans in that age range considered themselves to be “lower class”.
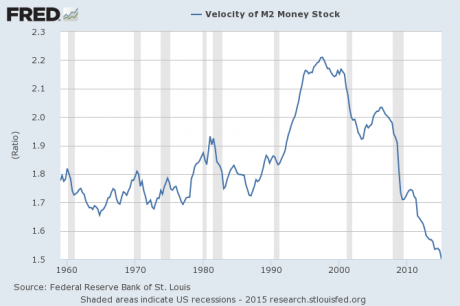
#12 This is something that I have covered before, but it bears repeating. The velocity of money is a very important indicator of the health of an economy. When an economy is functioning smoothly, people generally feel quite good about things and money flows freely through the system. I buy something from you, then you take that money and buy something from someone else, etc. But when an economy is in trouble, the velocity of money tends to go down. As you can see on the chart below, a drop in the velocity of money has been associated with every single recession since 1960. So why has the velocity of money continued to plummet since the end of the last recession?…
If you are waiting for an “economic collapse” to happen, you can stop waiting.
One is unfolding right now before our very eyes.
But what most people really mean when they ask about these things is that they are wondering when the next great financial crisis will happen. And as I discussed yesterday, things are lining up in textbook fashion for one to happen in our very near future.
Once the next great financial crisis does strike, all of the numbers that I just discussed above are going to get a whole lot worse.
So as bad as things are now, the truth is that this is just the beginning of the pain.


When the Rev. Jeremiah Wright yelled “God damn America” from the pulpit during a sermon at Chicago’s Trinity United Church of Christ, little did most Americans know there was a man in the pews to do the job.
This chart shows that Money Velocity now is slightly worse than it was in 1939 (the lowest) and I don’t see anything slowing down the fall now so the new bottom could be a whole lot worse. .
Total U.S. government and private debt is now 357% of GDP or $60 trillion, lowering consumption and investment in the future, this is a long slippery slope of recessions and the nation is headed for a cliff because the politicians can not afford a solution so its more can kicking.
We must have instant gratification and let the debt roll to next year, we are addicted to debt for whatever reason, liberals can say it’s because wages have not kept up with inflation and at the same time they tell you obama has brought inflation to it’s lowest level.
I have no idea what the outcome will be, but I do know politicians are just as clueless about a solution.
I agree mostly with this guy. Except #10. His comment “millions upon millions of jobs have been shipped overseas” is bereft of facts. He substantiates his position with facts on other points, but just tosses that one out there, unsubstantiated.
The trade deficit is funded by debt, which does not necessarily mean jobs have been shipped out.
A lot of lost jobs relate to the ever increasing efficiency of manufacturing.
BUT – although I disagree that the number of jobs sent out so far are “millions and millions” – I do believe that it is perhaps going to be TENS of millions shortly enough.
Tech will see the erosion of jobs to overseas at an ever increasing rate. And in combination with the continued decline in manufacturing jobs , there will be far fewer jobs affording a middle class income. Flipping burgers (at least until those jobs too are automated) do not pay well.
The future will be the rich, the near rich of say 10%, the upper middle class of say 10%, and then 80% working poor or really damn poor.
I recommend everyone do all possible to position themselves for that top 20% band, because everything else is going to be damn ugly.
Lloph ,How would you position yourself near the top 20% if you are middle age ( 45 to 55 ) with limited income and assets.Say less then 50,000 each.
Damn, Robert, I hope you are wrong, but. Think you are right.
bb – the short answer is I do not know exactly. This stuff generally takes a life-long effort to accomplish.
But for a 50 year old, I would say that they still have time to target some semblance of security. I would try to save hard, and search out a little retirement haven somewhere way away from the big cities where a small house and a few acres might be bought on the cheap.
Truck driver is not a bad career – I think that truck drivers 50 years old might – might – ride out the catastrophe. I think the really hard yards will be from 15 years from now going forward for a very long time. That is not to say there will not be a huge collapse before then, just that I think demographics are going to rule the day, and demographics are not good – starting now, but especially after 15 years. Truck drivers will benefit from the home-delivery trend.
Convert $ to hard assets – particularly a home/land where you can grow some food, raise a cow/pig/chickens etc. Five acres would be good. Ten or twenty better. With water. These can be had in certain areas relatively cheap. But got to look around hard.
Folks can start learning about being self-sufficient. HSF is a good example. Not everyone can do what he has done, perhaps, for lots of reasons. But someone with a few acres can come pretty close if they plan and learn. Try to get electric use down, get heating requirements down.
50 is running late, but the race is not over.
I think you mentioned being on $80k or somesuch. That is pretty good (stop getting tickets!). Sock as much away, and try to get yourself where you can avoid the general fallout that is coming.
It will be hard, but say you can save/invest $20k a year. You can save $300k, assuming no growth. That should get you a house and some land, somewhere. Plus some cash. Hopefully there will be some SS, etc., still available. No guarantee, so do not bank on it.
I just did a search on NC land, 10 acres, small houses. There are many properties with this criteria under $100k. South Carolina, Mississipi, Texas, TN, OK, NM, etc etc are all options.
I really think big cities will be a most unfortunate place to be 15 years from now.
Good luck.
Thanks lipoh , I’m still looking right now.I would have probably already been in a more private place butmy mom is very stubborn She will not leave the old house .Still nice place but the city is getting closer year by year.I afraid she will wait until they start building public housing and then the property will lose a lot of value.