Guest Post
NOAA Radiosonde Data Shows No Warming For 58 Years
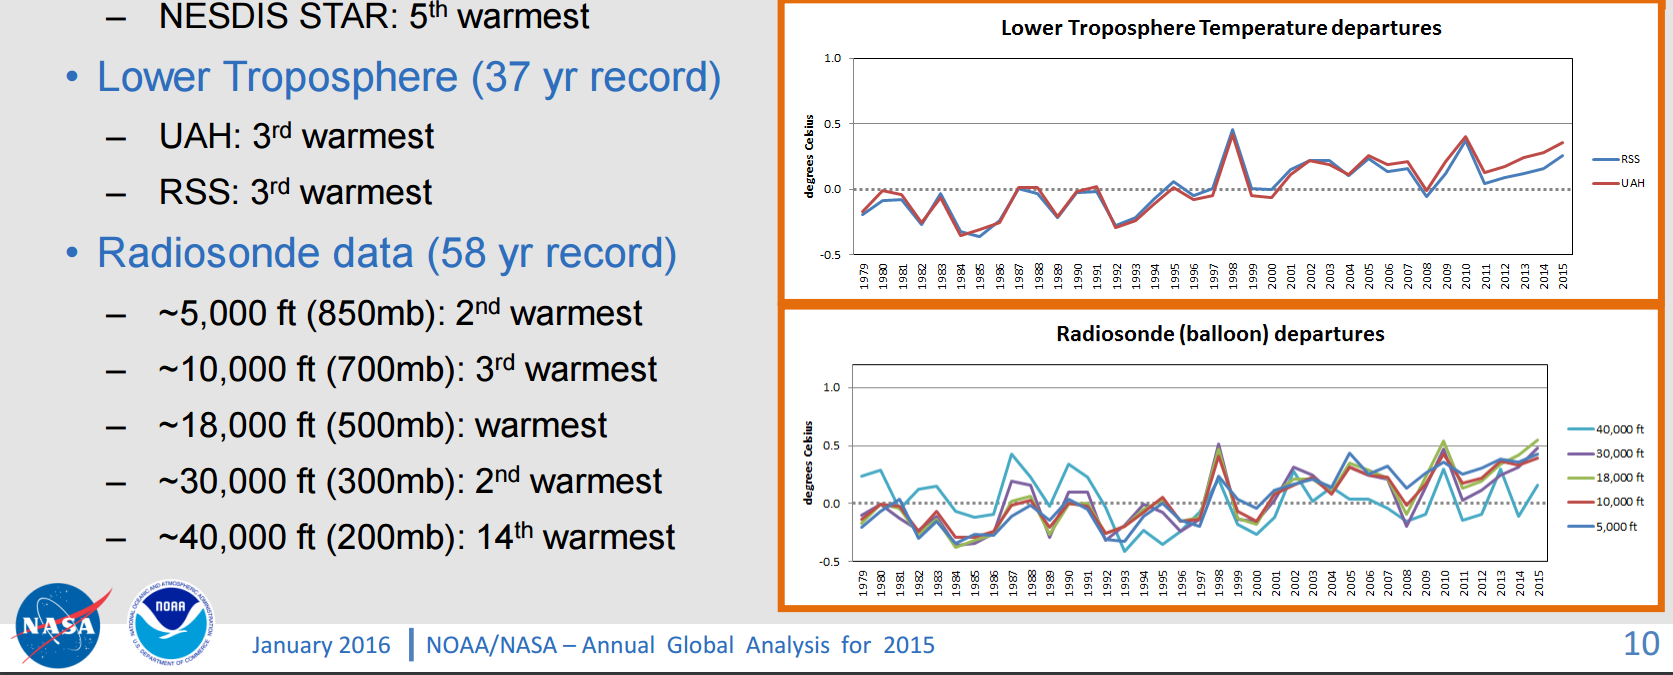
In their “hottest year ever” press briefing, NOAA included this graph, which stated that they have a 58 year long radiosonde temperature record. But they only showed the last 37 years in the graph.
NESDIS Strategic Communications
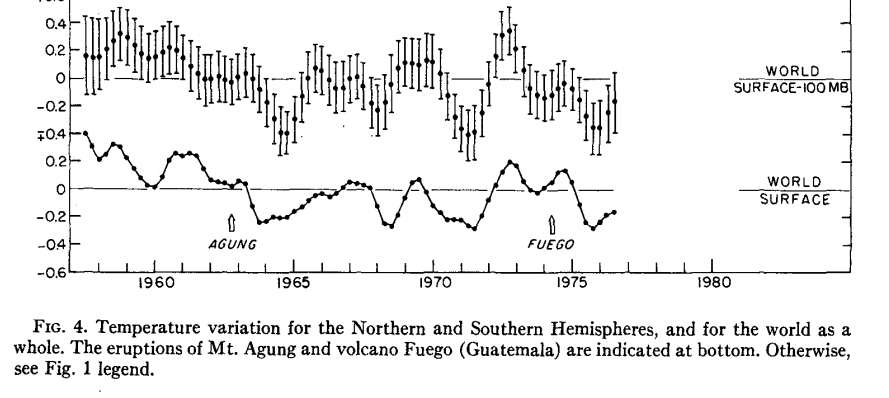
Here is why they are hiding the rest of the data. The earlier data showed as much pre-1979 cooling as the post-1979 warming.
1520-0493(1978)106<0755:GTVSMA>2.0.CO;2
I combined the two graphs at the same scale below, and put a horizontal red reference line in, which shows that the earth’s atmosphere has not warmed at all since the late 1950’s
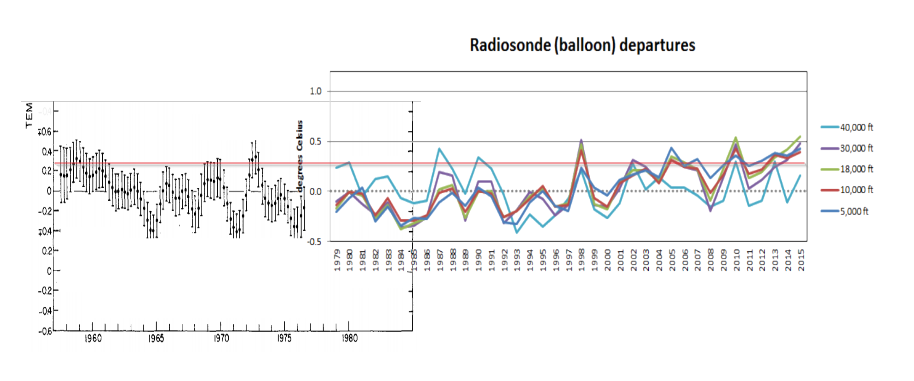
The omission of this data from the NOAA report, is just their latest attempt to defraud the public. NOAA’s best data shows no warming for 60 years.

The Magic Molecule (CO2) causes everything:
http://wattsupwiththat.com/2016/03/07/mongolia-deadly-cold-heavy-snow-blamed-on-global-warming/
This is not the whole story. They are measuring the temps in the wrong places. The heat is accumulating in giant heat sinks constructed by aliens . They are underground near Roswell . Don’t confuse the debate with made up facts.
As Tony Heller knows, this is known as NOAA ‘cherry picking’ the start date.
Physicist Happer Takes Us Down the Rabbit Hole of Climate Science
March 2, 2016
H. Sterling Burnett
Editor’s Note: William Happer, Ph.D., is an award-winning physicist and the Cyrus Fogg Brackett professor of physics, emeritus, at Princeton University. Happer served as the director of the Office of Energy Research at the U.S. Department of Energy from 1991 to 1993 and is a fellow the American Association for the Advancement of Science, and a member of the National Academy of Sciences. This interview was conducted after Happer was honored at the Tenth International Conference on Climate Change (ICCC-10) in June 2015.
Burnett: Please tell our readers a little about your research background and how you came to work on climate issues.
Happer: Much of my work as a physicist involved the interaction of radiation with matter. I am probably best known as the inventor of the sodium guide star, which is used on big modern telescopes to eliminate the blurring of stellar images by atmospheric turbulence. I served as the Director of the Office of Energy Research, now the Office of Science, in the U.S. Department of Energy, from 1990 to 1993, where I was responsible for all of the non-weapons basic research of the department. In addition to areas such as high-energy physics, materials science, [and] the human genome, I was responsible for DOE’s work on climate science. During my time at DOE, my office established the Atmospheric Radiation Measurement Climate Research Facility, [which includes] remote sensing observatories all around the world. The facility is still going strong and providing high-quality observational data on atmospheric physics.
Burnett: Degrees of skepticism exist regarding the theory humans are responsible for climate change and whether its impacts on human well-being and ecosystem health will be negative. Some don’t believe humans are playing any role in present climate conditions, others think they have had a modest impact, and still others think humans are affecting climate but that it’s not likely to have a dangerous impact, with some in this group saying they believe it could even be beneficial. Where do you fall on the spectrum?
Happer: Doubling the carbon dioxide concentration will probably cause a warming of around 1 degree Celsius, close to the theoretical, feedback-free value. A warming of 1–2 degrees Celsius will be beneficial in itself by lengthening growing seasons and cutting winter heating bills. Remember that most of the warming will be in temperate or polar latitudes—not in the tropics—and [the warming will mostly occur] at night, not during the day. The U.N. Intergovernmental Panel on Climate Change’s “most likely” warming estimate if carbon dioxide is doubled [is] 3 degrees Celsius[, which] is almost certainly much too large.
In addition to the direct beneficial effects of modest warming, there will be a huge benefit to agriculture from more carbon dioxide. By the standards of geological history, with hundreds of millions of years when carbon dioxide concentrations were several thousand parts per million, we have been in a carbon dioxide famine over the past tens of millions of years, with low concentrations of several hundred ppm. More carbon dioxide will increase crop yields, make plants more tolerant to droughts, and will shrink deserts. Yet, we keep hearing about “carbon pollution.” Carbon dioxide is beneficial, not a pollutant.
Burnett: At ICCC-10, your presentation compared the claims made by proponents of the theory humans are causing catastrophic global warming with the famous novel Alice’s Adventures in Wonderland. What parallels did you find?
Happer: Wonderland is the kingdom of the absurd, presided over by the Queen of Hearts. Desperate lackeys painted white roses red to please the queen. To please their masters before the [2015 Paris Climate Conference,] U.S. federal employees diddled the flat temperature record for the past decade or two into a robust warming. This was done with great fanfare, despite the fact the “pause” or “hiatus” was almost universally acknowledged, even by the IPCC. The infamous hockey stick temperature record of the past millennium was an analogous effort to erase the embarrassing Medieval Climate Optimum, when Vikings farmed Greenland and when wine grapes grew in Britain, but when not much fossil fuel was being burnt. The Earth’s climate has always changed and always will, no matter how many stupid laws are passed by governments and no matter how much “science” is made up to support the laws.
Burnett: Attacks on climate realists such as yourself have become personal in many instances. What have you found to be the most disturbing aspect of the way the climate change debate and climate policy have developed?
Happer: The Queen of Heart’s solution to any frustration was always the same: “Off with their heads!” Today, we hear demands by some politicians that any scientist who deviates from the governments’s party line on climate be prosecuted under the federal racketeering act. More extreme politicians want such “deniers” tried for treason. A servile media enthusiastically smears enemies of the climate establishment.
When I began my interest in climate research, it was not politics, but normal science, where skepticism is the most important guard against error. After all, the motto of Britain’s venerable Royal Society is “nullius in verba,” [which means], “Take no one’s word for it.” Apparently the Royal Society and many other scientific organizations in the United States have decided climate is an exception. A climate dogma has been promulgated, and heretics are punished. Someday, Ph.D. candidates will write dissertations on why so many educated elites embraced the myth of “carbon pollution.”
That’s a little misleading, trying to put those two charts together. The 1977 graph shows surface temperatures while the radiosonde chart shows five different altitudes.
More telling, in the linked report (here), page 5 shows surface temperatures since 1880. And, yes, they’re “higher” — all of 1.62 degrees F. Which could easily be a MOE with the equipment used.
Scale is everything.
Nice to have the whole chart:

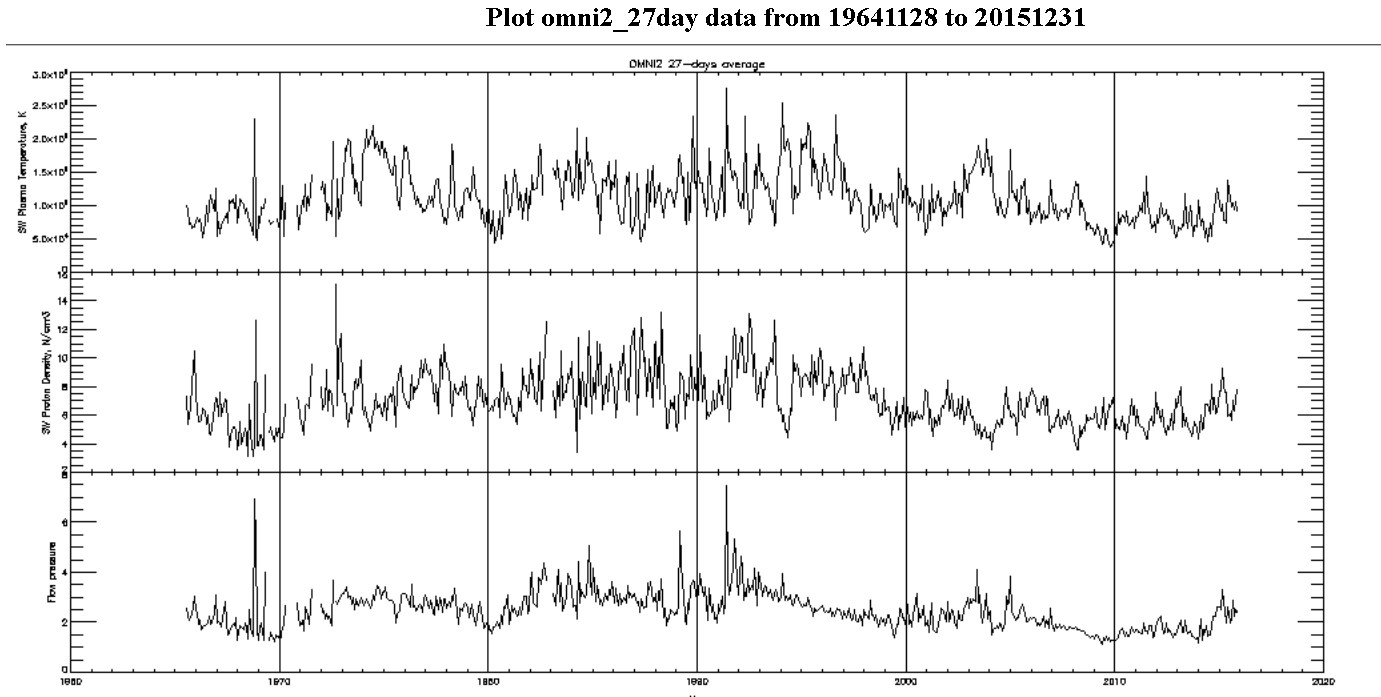
Anybody know what’s up with the cooling in the 70-30 range over the last 20 yrs?
jc
Sonic, the upper level cooling is the decline in upper level water vapour, that allows deeper penetration into the atmosphere of solar near infrared. It’s an AMO driven negative feedback to the decline in solar wind strength: