

We are now in month 83 of this so-called recovery. Yet there are still 45 million people on food stamps——one out of every seven Americans. The median real household income is still 5% below its level in the fall of 2007. There are still only 71 million full-time, full-pay “breadwinner” jobs in the nation—–nearly 2 million fewer than when Bill Clinton was packing his bags to vacate the White House.
At the same time, we have had monetary stimulus like never before. There has been 90 straight months of virtually zero interest rates. The balance sheet of the Fed has been expanded by $3.5 trillion. For point of reference, that is 4X more than all the bond-buying during the entire first 94 years of the Fed’s history.
So something doesn’t parse, and that’s to put it charitably. The truth is, the Fed’s entire radical regime of ZIRP and QE constitutes a monumental monetary fraud.
It has not “stimulated” a wit the struggling main street economy of flyover America. Instead, it has showered Wall Street speculators with trillions of windfall gains and gifted the bicoastal elites with a false prosperity derived from financial inflation and government expansion.
Herein follows an initial bill of particulars. We show that the “recovery” narrative endlessly trumpeted by the Fed and its fellow travelers on Wall Street and in the financial media does not remotely reflect on the ground economic reality; it derives almost entirely from a narrow band of badly flawed and thoroughly misleading labor market indicators and other faulty “incoming data” from the Washington statistical mills.
To begin with the most obvious example, consider the graph below on industrial production of consumer goods. The whole point of ultra-low interest rates is obviously to induce households to borrow and spend, and thereby trigger a virtuous cycle of rising demand, increasing production, more jobs and income and even more consumer spending. That’s Keynes 101.
Yet after seven years of massive monetary stimulus, domestic production of consumer goods is still 9.1% below its pre-crisis peak, and at a level first reached in early 1999!
Never once in its post-meeting blather about a steadily “improving” domestic economy has the Fed noted this fundamental rebuke to its entire ideology.
After all, if you are priming the pump with trillions of inducements for households to borrow and spend, why has consumer goods production remained in the sub-basement of its historical trend line and “recovered” at such a tepid rate?
The disconnect between the mainstream recovery meme and the chart above is implicit in the latter’s construction. That is, the industrial production index is a physical measure of output, and as such is not distorted by the flaws in the primitive measures of inflation published by the BLS.
As we showed a few days ago, the annual rate of consumer inflation during the last five years has been all over the lot depending upon which measure used and which time period observed.

This is important because based on the regular CPI, the official data implies that real hourly wages have risen by nearly 1% per annum since this turn of the century. So all things equal, households should have more financial resources to purchase real consumer goods.
But we do not think the standard CPI accurately measures the true cost of living, and especially not the 25% weighting given to the phony OER (owners equivalent rent). And that’s to say nothing of all the other tricks embedded in the numbers such as hedonics, which implies that bureaucrats have the capacity to assess the subtleties of product quality and consumer utility.
Accordingly, we think that BLS sub-index for total consumer services is more representative of living costs because it puts a heavier weight on medical care, education, child care, transportation, housing rents and other services which households must contend with week-in-and-week-out.
As shown in the chart below, hourly wages of nonsupervisory workers have grown at 2.7% per year since April 2000 compared to 1.9% for the CPI. In the conventional rendering, this results in an annual gain in real wages of just under 1% annually.
By contrast, the CPI sub-index for services has rising by 2.7% per annum during the last 16 years, implying no gain in real wages at all. And even that includes the distorting impact of the OER. If you substitute the market based index for housing rents we display in the first chart above, it is likely that services purchased by the average household have been inflating at upwards of 3% per year during this century, meaning that real wages have been steadily shrinking.
Since the financial crisis there has been another significant jolt to household spending capacity in addition to the implicit shrinkage of real wages suggested above. Namely, most main street households have hit Peak Debt, meaning that their spending capacity is no longer being supplemented with incremental borrowings.
Needless to say, that is a dramatic change from the pattern of the previous 30 years as displayed in the graph below. In effect, the easy money policies of the Fed—-especially between Greenspan’s arrival in August 1987 and the 2008 financial crisis—–induced the household sector to perform a giant LBO on itself.
So doing, it ratcheted up its leverage ratio from a historically stable rate of about 80% of wage and salary income to nearly 220% by the peak in 2007.

Since then, the ratio has dropped significantly, but still remain far above what had been healthy levels prior to the post-1987 household borrowing binge. This has been called “deleveraging” by the commentariat, but its true import has been totally obfuscated by the all is awesome meme .
Still, the untoward implication is hard to miss if you focus on something other than the monthly deltas. To wit, during the household sector’s LBO between 1987 and 2008, total credit market debt outstanding erupted from $2.7 trillion to $14.3 trillion on the eve of the financial crisis or by 5.4X.
Since then, it has not increased by a single dime!
What that means is that we have a Say’s Law economy, not the Keynesian one jabbered about by our monetary politburo and the mainstream financial media. And when production and income is in the saddle, not the one time anomaly of bloated credit based consumption, you have fish of an entirely different kettle.
Stated differently, money pumping and artificially cheap credit no longer stimulates household spending because the latter are tapped out. Another potent indicator of that truth is the fact that housing construction still remains in the sub-basement of history, notwithstanding the lowest real mortgage rates ever recorded.
Indeed, new starts of single-family housing units after all of this alleged “recovery” are still lower than they were during all but four months prior to the financial crisis during the last 33 years. Yet, historically the whole point of Keynesian money pumping was to stimulate new housing construction.
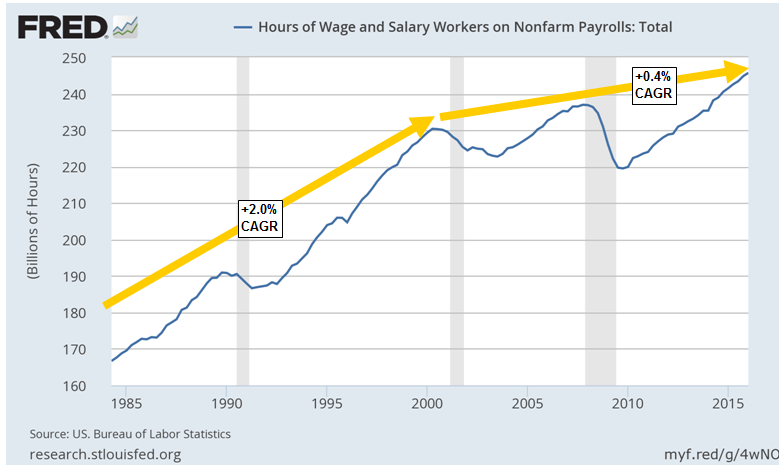
The same holds true with respect to labor hours employed in the nonfarm business sector. Since the turn of the century, labor hours in the nonfarm economy have advanced at an anemic rate of just 0.4% annually. That is only one-fourth of the 2.0% rate which prevailed during the prior 16 years.
Needless to say, that radical downshift is not due to demographics. The adult population has actually grown from 212 million in 2000 to 252 million at present.
At the same time, it puts the lie to the alleged virtuous circle of Keynesian stimulus. There has been no pump-priming of consumption spending, production, jobs, income, and more of the same.
Indeed, the Fed’s balance sheet has grown by 900% during the last 16 years, while labor hours have risen by only 6.7%. There is self-evidently a big time blockage in the transmission mechanism.
The same is true for business investment spending. The classic argument for Keynesian stimulus has always included the notion that businessmen are somewhat slow-witted, and therefore need government inducement to increase capital spending and take advantage of opportunities for future profit.
Low interest rates were supposed to do just that, and presumably the record low rates on corporate loans and bonds during recent years should have accomplished that turbo-charging effect in spades.
But it hasn’t. Bubblevision is always telling you about whatever tiny change in nonresidential business investment occurred or didn’t occur during the most recent quarter. What it never, ever reports is the trend line of real net business investment after current period depreciation. The latter, of course, measures the capital resources consumed in the production of current GDP.
Owing to the laws of arithmetic, this crucial measure of business sector health and growth—–real net investment–can not rise unless current period CapEx exceeds current capital consumption. As shown below, that has not remotely been happening since the turn of the century.
In fact, real capital consumption has risen by 53% over the last 16-years, while real net investment is down by 17%.
There is plenty more evidence where these examples came from, but the larger point is clear. The US economy has a giant supply-side problem that can’t be alleviated by demand-side stimulus.
As we have demonstrated repeatedly, monetary stimulus is a one-time parlor trick. It only works when there is business and household balance sheet space left to leverage, thereby permitting spending derived from current production and income in the manner of Say’s Law to be boosted with spending derived from incremental borrowings.
Under conditions of Peak Debt, therefore, the Keynesian credit magic ceases to “stimulate” the main street economy. Instead, it never leaves the canyons of Wall Street, where it cycles in an incendiary spiral of leveraged speculation and the systematic inflation of financial assets.
The graph below summarizes that story succinctly. The broadest measure of the stock market—–Wilshire 5000 index——has risen by 125% since 1999. The real median family income has fallen by 7%.
Stated differently, the bicoastal elites, who own most of the nation’s financial assets or who feed off the financial system and a debt-swollen central state in Washington, believe themselves to be in the pink of prosperity.

They do not understand, of course, that this is all a giant bubble which at length will burst in spectacular fashion, causing their own unearned windfalls to shrink in the process.
In the meanwhile, they may come to understand that the flyover zone of America has been left behind. The main street insurgency fueling Donald Trump’s shocking rise to the top of the Presidential race proves that much in spades.

I am working my ass off to develop an online scheduling solution for mobile services. It is location based and completely configurable for any type of business that goes to the customer. I have big hopes and dreams for my business. I see no other way for me to thrive. Your best wishes are sincerely appreciated.
Realy long winded but he is right. After years I moved from NYC to suburban Cleveland. I can state clearly, as a boots on the ground observation , that once you pass the NJ state line going west on I-80, the economy falls off a cliff. There are a few pockets of proseprity in the bigger cities of the Midwest, but once you get out of those, you essentially move into a 3rd world existence of trailer homes, cars on make shift jacks and despair. And I mean its EVERYWHERE. And yet the pols in this flyover zone are in denial and also spout off the recovery meme. The inabitants for the most part are either too stupid, in denial or both to realize what is happening. As I see it, the east coast wil collapse before the West as there are millions of unemployed, FSA dependent folks just waiting until the first check doesn’t show up. But make no mistake, this is coming to the whole country soon enough.
Jim is right. Nick and I chose to move into the Ozarks because I have family here and know that they retired here much for the same reason we did.
However, the local economy is very much supported by a large percentage of the population on disability payments or some other form of government assistance. The exceptions are the people like us who have moved here to get away from urban existence.
However, most of these people know how to hunt, fish and gather their own food, so they probably will be much better prepared than urban FSA folks.
What prosperity ever? I told my 90 year old neighbor Edgar Connell that Jefferson County Florida has been going backwards since I first saw it in 1965. He said it has gone backwards since he grew up during the Great Depression.
i think it boils down to “where do you want to be, when the music stops”.
introspection,
(the examination or observation of one’s own mental and emotional processes.
synonyms: self-analysis, self-examination, soul-searching, introversion, self-observation);
introspection is one of the hardest things to do. eventually you find all your warts and blemishes.
first introspection. second, figure out what you really want. the rest gets a whole lot easier. otherwise you are trapped in circular logic and never find a way out.