AND YELLEN IS CONCERNED ABOUT DEFLATION

So yesterday we find that retail sales are FALLING. Today we find out that prices are SOARING. Sounds bullish to me. Buy stocks. Don’t miss the train to riches. We already know the government massages every data point to extract the best possible view, so when they report an inflation number like they did today, you know the shit is hitting the fan. They’ve run out of hedonistic adjustments and the other bullshit they use to fake the inflation numbers.

Even the number they reported today is a lie. Look at the supposed March and April PPI for Energy. The BLS drones are telling you that energy prices have fallen by 1.1% over that time period. Let’s add a little reality to their bullshit storyline of declining energy prices:

  • National gas prices rose from $3.52 per gallon on March 1 to $3.66 per gallon on April 30. That is a 4% increase in two months.
  • Oil prices were $101 per barrel on March 1, averaged about $102 per barrel over the two months and finished at $101 per barrel on April 30. No drop there.
  • Natural gas on March 1 was $4.60 and on April 30 was $4.85. Based on my years of financial training, I believe that is an increase.

What energy product fell? Oil, gasoline and natural gas supply the vast majority of energy in this country and the prices of those products rose from March 1 through April 30, but the government tells you the prices fell. Who do you believe?

It’s all good. Yellen assures us the 3.6% year to date PPI is an aberration and QE hasn’t had any negative impact on the lives of average Americans. Tell that to the 85 year old widows getting $0 on their savings and eating Alpo for dinner. 

Producer Prices Surge Most In Over Four Years As BLS Discovers Food Inflation

Tyler Durden's picture

And just like that, the BLS is reacquainted with soaring food prices.

Moments ago the US government reported that producer prices, as part of a newly reindexed PPI series, spiked by 2.1% from a year ago, or a whopping 0.6% surge in April, the biggest monthly jump since January 2010, and up from the 0.5% increase in March.

So what caused this surge in producer prices? Why food costs of course, which in April soared by 2.7%.

Here is the explanation for the finished goods price surge:

Special grouping, Finished goods: The index for finished goods moved up 0.7 percent in April. (The finished goods index represents about two-thirds of final demand goods, through the exclusion of the weight for government purchases and exports. The finished goods index represents about one-quarter of overall final demand.) The broad-based increase was led by the index for finished consumer foods, which advanced 2.4 percent. Prices for finished goods less foods and energy and for finished consumer energy goods rose 0.3 percent and 0.5 percent, respectively. Within finished goods, higher prices for meats, gasoline, light motor trucks, residential electric power, processed poultry, and eggs for fresh use outweighed lower prices for residential natural gas, passenger cars, and soft drinks.

It wasn’t just finished goods that was burned by food prices. Processed goods by intermediate demand…

In April, the index for processed eggs jumped 25.3 percent. Prices for ethanol, meats, gasoline, and commercial electric power also increased. Conversely, the index for jet fuel declined 5.3 percent. Prices for diesel fuel, primary basic organic chemicals, natural gas to electric utilities, and soybean cake and meal also fell

Unprocessed goods too…

The index for unprocessed goods for intermediate demand rose 0.4 percent in April after edging down 0.1 percent a month earlier. Leading the advance, prices for unprocessed foodstuffs and feedstuffs moved up 3.6 percent.


In April, a 9.4-percent jump in prices for slaughter chickens led the advance in the index for unprocessed goods for intermediate demand. The indexes for slaughter hogs, corn, soybeans, carbon steel scrap, and crude petroleum also moved up.

And so on. The good news however is that as food prices soar, and as rents hit all time highs, wages are rising in lockstep. Oh wait, never mind.


What Food Inflation?

Tyler Durden's picture

Oh, this food inflation.

Incidentally, the last time food prices spiked by this much in one month, the resulting Arab Spring wave of revolutions tumbled governments across north Africa and the middle east.

Keep a close eye on those who are not exactly participating in the global central bank cartel’s “wealth transfer effect” , and suddenly find they can’t afford food again.

Source: BLS

WILL BOOMERS END UP EATING ALPO?

Another good article from http://www.mybudget360.com/.

At this point it doesn’t matter whether you were lured into the fantasy of a cushy retirement by Wall Street shysters or you decided to live for today with a leased BMW and a McMansion twice the size of what you needed or you thought you could retire off your internet stock profits and never ending equity in your house or you were just a dumbass and forgot to save for your retirement – YOU’RE PRETTY MUCH SCREWED. Stocks aren’t going up in the next decade. Bonds will fall in the next decade. And most of the Boomers have less than $100,000 saved for retirement. I hope they like the taste of Alpo.

Middle class retirement now largely a postcard fantasy – How Wall Street fabricated a buy and hold fairytale and jumped ship with taxpayer golden parachutes. Did baby boomers think about who they would be selling those 401k and pension stocks to?

The days of dreaming about long days playing golf on a green course and taking luxurious cruises around the world are appearing more and more like a foggy memory for those in the middle class planning for retirement.  As Wall Street bankers and hedge fund managers rob the public blind, the mission statement sold to baby boomers is starting to become a large bait and switch catchy enough to make it on a Hallmark card.  For decades Wall Street begged and lured the public in either directly or through pension funds into their web of easy money.  Save $100 a month and you’ll retire a millionaire!  As it turns out, the golden parachute was only available to a tiny fraction of the population while the oligarchy in the financial sector offloads their toxic bets onto the taxpayers struggling balance sheet.  The end game?  No retirement.  At least no retirement like those plastered on glossy mutual fund brochures.  What the Wall Street banking charlatans failed to tell you is that you eventually need to sell those stocks to use the money for real world spending.  What they also failed to mention is that the baby boomer generation is now going to sell into unrelenting headwinds of demographics bringing on a younger and poorer generation to purchase their stocks.  Of course Social Security is in the crosshairs of the financial elite since they already secured their financial piece of the pie.  You know things are bad when the Federal Reserve is stating that stocks are not exactly a winners bet in the years going forward.

Retirement becoming more of a postcard fantasy

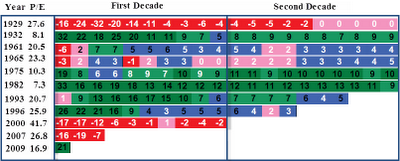
The middle class has been pillaged and ransacked by financial thievery for decades.  The debt bubble and mass delusion is now imploding.  The graft and con games taking place in the financial sector would be comical if they weren’t so real and economically tragic.  The Federal Reserve has given covert loans to big banks while big banks publicly stating all was well.  The Federal Reserve has grown their balance sheet to a stunning $2.8+ trillion of questionable assets and other junk with little redeemable market value.  It would have a hard time selling these items on eBay let alone the natural marketplace.  There is no easier way to make a profit than stealing from the taxpayer.  Of course the problems in the system are coming at the expense of the working and middle class.  For those who bought into the Wall Street mantra of buy and hold, making a profit has gotten much harder:

annualized rate of returns

This is fascinating data to look at.  This decade has been horrible for stocks.  The S&P 500 stands today where it did in 1998.  The massive stock volatility is simply a reflection of the problems deep in our financial system.  The above chart examines P/E ratios over time.  Really fascinating information but the Fed study finds that P/E ratios are likely to go lower because of demographic shifts and also the reality that we have a lower wage employment force dominating our economy.  The latest decade is a reflection of the bubble era machinery that has hoisted up the financial sector into an untouchable corner yet middle class Americans have taken it squarely in their stock portfolios.  Why?  Because Wall Street has been preaching buy and hold as if it were some patriotic mission but many of these hedge funds and banking managers have placed bets that openly aim against American middle class success.  In fact, some have made bets on flat out American failure and have made billions of dollars with lower tax rates that are given to hedge funds.

The stock market casino

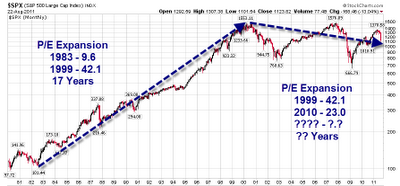
The stock market has been on a wild ride for well over a decade:

PE Expansion Contraction

Source:  Mish Global Economic Analysis Blog

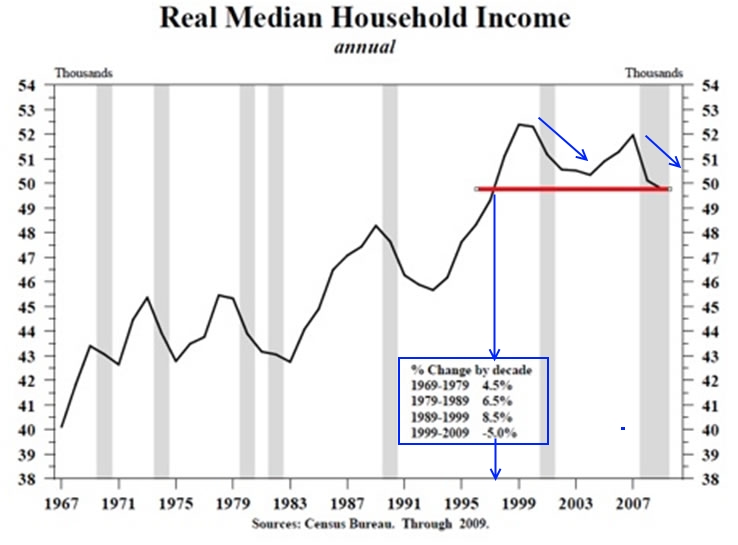
You have a crazy expansion in the 1980s and 1990s with the peak productive years of baby boomers but also the carefree attitude with the debt bubble and the “deficits don’t matter” mentality that has harmed this nation and is leaving the Eurozone in tatters.  Of course all of that has come to a crashing halt first with the tech bubble bursting and then the real estate bubble imploding.  So you have to ask, when these baby boomers sell out of their 401ks and pension plans who will buy the stocks?  The 46,000,000 Americans on food stamps?  Or what above the average per capita worker making $25,000 a year?  Household incomes have been stagnant for well over a decade:

real-household-median-income1

To use an often quoted cliché, this is the perfect financial storm.  For the financially and politically connected the free market rules do not apply.  For the working and middle class they do.  This massive contraction is happening when millions are entering the retirement pipeline.  Now it would be one thing if people had vibrant retirement accounts.  1 out of 3 Americans have no savings account.  But for those with a retirement account they likely do not have funds to support their life as they age and this is seen in a Transamerica retirement study:

“Workers estimate their retirement savings needs at $600,000 (median), but in comparison, fewer than one-third (30 percent) have currently saved more than $100,000 in all household retirement accounts.”

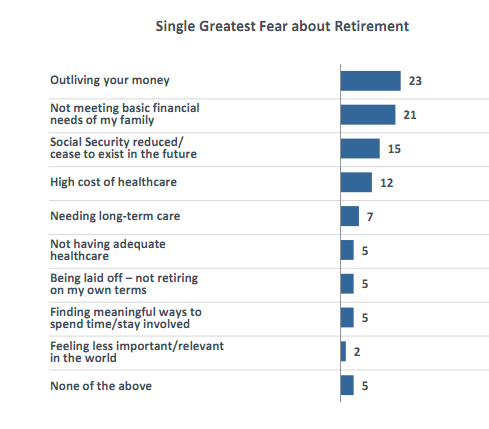
And the fears most have are based on real life issues:

retirement fears

Source:  Transamerica

These aren’t fears about not having enough yachts or trips to Paris but whether they will eat decent food or Alpo.  Workers are accurate in how much they need but less than one third have even saved $100,000 or more for retirement.  For a median household income pulling in $50,000 a year in working years, the funds would likely last 3 or 4 years.  The biggest fear is outliving the money while coming in at a close second is simply not meeting basic family needs.  The next fear is cuts to Social Security because of course, the bankers and investment banks had to get their bailouts first before setting the U.S. economy on fire.

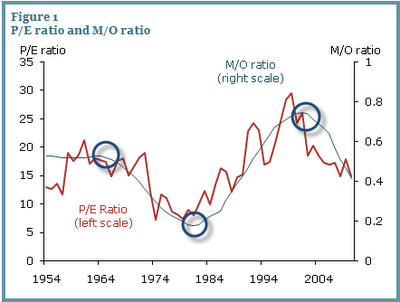
The Federal Reserve study found that P/E ratios are likely to become compressed as time goes on:

pe ratios moving forward

Between 1981 and 2000, as baby boomers reached their peak working and saving ages, the M/O ratio increased from about 0.18 to about 0.74. During the same period, the P/E ratio tripled from about 8 to 24. In the 2000s, as the baby boom generation started aging and the baby bust generation started to reach prime working and saving ages, the M/O and P/E ratios both declined substantially. Statistical analysis confirms this correlation. In our model, we obtain a statistically and economically significant estimate of the relationship between the P/E and M/O ratios. We estimate that the M/O ratio explains about 61% of the movements in the P/E ratio during the sample period. In other words, the M/O ratio predicts long-run trends in the P/E ratio well.”

In other words, lots of money chasing the Wall Street illusion yet there will be fewer (poorer) buyers ahead.  The P/E ratios surged when baby boomers entered their peak earnings years.  Given the massive problems in our economy the fact that P/E will take it on the chin is no surprise.  What is more stunning is the fact that no real financial reform has taken place and that the political system is so utterly broken.  Money has infiltrated politics to a degree never before seen.  We have career politicians in the SEC basically training for plush gigs at Goldman Sachs or Morgan Stanley.  A revolving door out of D.C. and into big investment banks and back to D.C.  No wonder why there has been no true enforcement of the investment banks when many are simply using it as a training ground for future jobs!  If the working and middle class actually saw what went on trading floors they would never even think about playing the stock market.  The fact that we have millions now needing to dump stocks into the open market is simply another issue we will be facing.  These are people that have to sell (you can’t eat your stocks or pay for a medical bill with a stock).  Many are now realizing after a lifetime of work that retirement only meant more work with fewer benefits to compensate for the big banking bailouts.