Real Estate Speculation – Boom – Bust – Just Insanity

Guest Post by Martin Armstrong

Barlow Mansion Maple ShadeReal estate depends on how far down the rabbit hole we go. If government does not blink and it just keeps raising taxes trying to support a system that is unsustainable, then we end up in the full crash and burn and you are compelled to walk away from real estate. Hopefully, with education understanding the past, we can for once avoid the same outcome and advance in this learning curve of civilization.

Vacation properties are the worst to survive. I bought such a place to live in at about 50% of its 2007 high. So while high-end properties in cities were rising, vacation spots on the beach declined. I wanted beach front. So understanding the cycle helps tremendously for entry and exit points.

The risk of mortgages declining is real. As governments get in trouble, long-term confidence starts to decline. Banks will not longer be able to package mortgages. As that unfolds, the lack of the availability of mortgages means the only cash rules.

Continue reading “Real Estate Speculation – Boom – Bust – Just Insanity”

Bust In The US Shale Patch—–$36 Billion Of Negative Free Cash Flow In The Bakken

Via Stockman’s Contra Corner

The Death of the Great Bakken Oil Field has begun and very few Americans understand the significance.  Just a few years ago, the U.S. Energy Industry and Mainstream media were gloating that the United States was on its way to “Energy Independence.”

Unfortunately for most Americans, they believed the hype and are now back to driving BIG SUV’s and trucks that get lousy fuel mileage.  And why not?  Americans now think the price of gasoline will continue to decline because the U.S. oil industry is able to produce its “supposed” massive shale oil reserves for a fraction of the cost, due to the new wonders of technological improvement.

I actually hear this all the time when I travel and talk to family, friends and strangers.  I gather they have no clue that the Great Bakken Oil Field is now down a stunning 25% from its peak in just a little more than a year and half ago:

Bakken Oil Field Production

Continue reading “Bust In The US Shale Patch—–$36 Billion Of Negative Free Cash Flow In The Bakken”

My Scary Chart

Jim Cramer and the rest of the captured MSM, along with their Wall Street puppet masters, captured political snakes, and crony capitalist corporate chieftains will tell you to ignore this scary chart. It’s different this time. The Fed has your back. The economy is booming. Stocks for the long term. Where else are you going to put your money? Trust us.

AND IT’S GONE!!!! 

Guest Post by Daniel Thorton

Hedgeye Guest Contributor | Thornton: My Scary Chart - Bubble bear cartoon 09.26.2014 1


I published the graph below in a recent essay titled, Why the Fed’s Zero Interest Rate Policy Failed, but the graph deserves special attention because of what it seems to imply for the economy going forward. The graph shows household net worth (wealth) as a percent of personal disposable income. Household net worth as a percent of disposable income increased dramatically in the mid-1990s. Its collapse precipitated the 2000 recession. It increased even more dramatically during the subsequent expansion only to collapse again, precipitating the 2007 – 2009 recession.


Hedgeye Guest Contributor | Thornton: My Scary Chart - thornton1


Once again, household net worth has increased dramatically. Since the end of 2012 it has increasing by nearly 100 percentage points to 640% of disposable income. This is scary; not just because it is an incredibly large rise in wealth in a short period of time, but because it happened twice before with very bad consequences.

Continue reading “My Scary Chart”

THIS TIME ISN’T DIFFERENT

Last year ended with a whimper on Wall Street. The S&P 500 was down 1% for the year, down 4% from its all-time high in May, and no higher than it was 13 months ago at the end of QE3. The Wall Street shysters and their mainstream media mouthpieces declare 2016 to be a rebound year, with stocks again delivering double digit returns. When haven’t they touted great future returns. They touted them in 2000 and 2007 too. No one earning their paycheck on Wall Street or on CNBC will point out the most obvious speculative bubble in history. John Hussman has been pointing it out for the last two years as the Fed created bubble has grown ever larger. Those still embracing the bubble will sit down to a banquet of consequences in 2016.

At the peak of every speculative bubble, there are always those who have persistently embraced the story that gave the bubble its impetus in the first place. As a result, the recent past always belongs to them, if only temporarily. Still, the future inevitably belongs to somebody else. By the completion of the market cycle, no less than half (and often all) of the preceding speculative advance is typically wiped out.

Hussman referenced the work of Reinhart & Rogoff when they produced their classic This Time is Different. Every boom and bust have the same qualities. The hubris and arrogance of financial “experts” and government apparatchiks makes them think they are smarter than those before them. They always declare this time to be different due to some new technology or reason why valuations don’t matter. The issuance of speculative debt and seeking of yield due to Federal Reserve suppression of interest rates always fuels the boom and acts as the fuse for the inevitable explosive bust.

Continue reading “THIS TIME ISN’T DIFFERENT”

Chart Of The Day: NASDAQ 2000 And Shanghai 2015 Resemble Hand-In-Glove

The Chinese authorities are desperately attempting to keep their staock market bubble inflated. The government bought stocks last night, driving it higher by 5% in the last hour of trading. Whenever central bankers and politicians allow the free market to decide, markets go into collapse mode. They can print more fiat to prop things up for awhile, but they are only making the ultimate collapse far worse.

Ludwig von Mises’ words of wisdom still apply today:

“There is no means of avoiding the final collapse of a boom brought about by credit expansion. The alternative is only whether the crisis should come sooner as the result of a voluntary abandonment of further credit expansion, or later as a final and total catastrophe of the currency system involved.”

Via David Stockman’s Contra Corner


This Is What Happens When The Government Cracks Down On Subprime Auto Loans

Who could have seen this coming? Oh yeah. Me.

Tyler Durden's picture

A running theme here has been the great rotation of bubble-blowing credit from subprime housing to subprime auto-loans. Amid government probes of underwriting standards and soaring delinquencies, it appears when the least-creditworthy Americans are cut off from debt servitude, bad things happen in car sales…

  • *FORD FEB. U.S. LIGHT-VEHICLE SALES FALL 2.0%, EST. UP 5.8% (miss!)
  • *GM FEB. U.S. AUTO SALES UP 4.2%, EST. UP 5.9% (miss!)
  • *NISSAN FEB. U.S. AUTO SALES UP 2.7%, EST. UP 3.8% (miss!)
  • *FIAT CHRYSLER FEB. U.S. AUTO SALES UP 5.6%, EST. UP 8.2% (miss!)
  • *HONDA FEB. U.S. AUTO SALES RISE 5%, EST. UP 11% (miss!)
  • *TOYOTA FEB. U.S. AUTO SALES RISE 13.3%, EST. UP 15%( miss!)

Of course, the real blame – as we will be told – is the weather… It seems Obama’s new American Dream of a brand new Ford or GM (or Maserati) in every driveway may be another broken promise.

  • *FORD SAYS WEAK TEXAS SALES MAY HAVE BEEN WEATHER RELATED

So did the analysts that forecast sales not know that there was weather? not know the seasonals in fleet sales?

This won’t end well…


Continue reading “This Is What Happens When The Government Cracks Down On Subprime Auto Loans”

BREAKING BAD (DEBT) – EPISODE THREE

In Part One of this three part article I laid out the groundwork of how the Federal Reserve is responsible for the excessive level of debt in our society and how it has warped the thinking of the American people, while creating a tremendous level of mal-investment. In Part Two I focused on the Federal Reserve/Federal Government scheme to artificially boost the economy through the issuance of subprime debt to create a false auto boom. In this final episode, I’ll address the disastrous student loan debacle and the dreadful global implications of $200 trillion of debt destroying the lives of citizens around the world.

Getting a PhD in Subprime Debt

“When easy money stopped, buyers couldn’t sell. They couldn’t refinance. First sales slowed, then prices started falling and then the housing bubble burst. Housing prices crashed. We know the rest of the story. We are still mired in the consequences. Can someone please explain to me how what is happening in higher education is any different?This bubble is going to burst.” Mark Cuban

 http://www.nationofchange.org/sites/default/files/StudentLoanDebt070313_0.jpeg

Now we get to the subprimiest of subprime debt – student loans. Student loans are not officially classified as subprime debt, but let’s compare borrowers. A subprime borrower has a FICO score of 660 or below, has defaulted on previous obligations, and has limited ability to meet monthly living expenses. A student loan borrower doesn’t have a credit score because they have no credit, have no job with which to pay back the loan, and have no ability other than the loan proceeds to meet their monthly living expenses. And in today’s job environment, they are more likely to land a waiter job at TGI Fridays than a job in their major. These loans are nothing more than deep subprime loans made to young people who have little chance of every paying them off, with hundreds of billions in losses being borne by the ever shrinking number of working taxpaying Americans.

Student loan debt stood at $660 billion when Obama was sworn into office in 2009. The official reported default rate was 7.9%. Obama and his administration took complete control of the student loan market shortly after his inauguration. They have since handed out a staggering $500 billion of new loans (a 76% increase), and the official reported default rate has soared by 43% to 11.3%. Of course, the true default rate is much higher. The level of mal-investment and utter stupidity is astounding, even for the Federal government. Just some basic unequivocal facts can prove my case.

There were 1.67 million Class of 2014 students who took the SAT. Only 42.6% of those students met the minimum threshold of predicted success in college (a B minus average). That amounts to 711,000 high school seniors intellectually capable of succeeding in college. This level has been consistent for years. So over the last five years only 3.5 million high school seniors should have entered college based on their intellectual ability to succeed. Instead, undergraduate college enrollment stands at 19.5 million. Colleges in the U.S. are admitting approximately 4.5 million more students per year than are capable of earning a degree. This waste of time and money can be laid at the feet of the Federal government. Obama and his minions believe everyone deserves a college degree, even if they aren’t intellectually capable of earning it, because it’s only fair. No teenager left behind, without un-payable debt.

Continue reading “BREAKING BAD (DEBT) – EPISODE THREE”

BREAKING BAD (DEBT) – EPISODE ONE

“At this juncture, the impact on the broader economy and financial markets of the problems in the subprime market seems likely to be contained.”Fed chairman, Ben Bernanke, Congressional testimony, March, 2007

“Capitalism without financial failure is not capitalism at all, but a kind of socialism for the rich.”James Grant, Grant’s Interest Rate Observer

The Federal Reserve issued their fourth quarter Report on Household Debt and Credit last week to the sounds of silence in the mainstream media. There were minor press releases issued by the “professional” financial journalists regurgitating the Federal Reserve’s storyline. Actual analysis, connecting the dots, describing how the massive issuance of student loan and auto loan debt has produced a fake economic recovery, and how the accelerating default rates in auto loans and student loans will produce the next subprime debt implosion, were nowhere to be seen on CNBC, Bloomberg, the WSJ, or any other status quo propaganda media outlet. Their job is not to analyze or seek truth. Their job is to keep their government patrons and Wall Street advertisers happy, while keeping the masses sedated, misinformed, and pliable.

Luckily, the government hasn’t gained complete control over the internet yet, so dozens of truth telling blogs have done a phenomenal job zeroing in on the surge in defaults. The data in the report tells a multitude of tales conflicting with the “official story” sold to the public. The austerity storyline, economic recovery storyline, housing recovery storyline, and strong auto market storyline are all revealed to be fraudulent by the data in the report. Total household debt grew by $117 billion in the fourth quarter and $306 billion for the all of 2014. Non-housing debt in the 4th quarter of 2008, just as the last subprime debt created financial implosion began, was $2.71 trillion. After six years of supposed consumer austerity, total non-housing debt stands at a record $3.15 trillion. This is after hundreds of billions of the $2.71 trillion were written off and foisted upon the backs of taxpayers, by the Wall Street banks and their puppets at the Federal Reserve.

The corporate media talking heads cheer every increase in consumer debt as proof of economic recovery. In reality every increase in consumer debt is just another step towards another far worse economic breakdown. And the reason is simple. Real median household income is still below 1989 levels. The average American family hasn’t seen their income go up in 25 years. What they did see was their chains of debt get unbearably heavy. Non-housing consumer debt (credit card, auto, student loan, other) was $800 billion in 1989.

Continue reading “BREAKING BAD (DEBT) – EPISODE ONE”

1929 – 2000 – 2015

Based on the average of four separate valuation models that have been accurate in assessing whether the stock market is overvalued or undervalued over the last century, the stock market is currently over valued by 89%. The stock market was overvalued by 88% before the 1929 Crash. It was “only” overvalued by 74% in 2007 before the last Crash. It has only been more overvalued once in market history – 2000. I wonder what happened after that?

If you were paying attention in Statistics class in college, you know that when something reaches 2 standard deviations from the mean, you’ve reached EXTREME levels. The market valuation is now past 2 standard deviations. Anyone staying in the market or buying today is betting on the market to reach 2000 internet bubble proportions. I’ll pass. You will be lucky to “achieve” a negative 2% nominal return over the next ten years. After taking inflation into account you will likely end up with a -5% to -10% annual return, with a crash thrown in for good measure.

Betting on a 2000 level of overvaluation is even more foolish when you take into account the fact the overvaluation was centered solely on tech and internet stocks. Large cap value stocks were significantly undervalued in 2000. The chart below from former perma-bull Jim Paulson at Wells Fargo reveals the foreboding truth. The median price/earnings ratio is now the highest in U.S. history. It is 45% higher than it was in 2000. It is 15% higher than it was in 2007.

John Hussman answers a few pertinent questions below. But the gist of the situation is simple. The stock market is overvalued equal to or more than it was in 1929, 2000, and 2007. The reason it has gotten this far is the $3.5 trillion of Federal Reserve fiat handed to the Wall Street banks and the ridiculous faith in these Ivy League educated puppets to engineer never ending stock market gains.

Greed has been winning for the last five years. Fear has been creeping in, especially since QE3 ended in October. The increased volatility is a warning signal. Fear will be reasserting itself, and it will happen suddenly. Buying the dip will stop working. Faith in central bankers will dissipate and reality will be a bitch. This episode of delusion will end just as all the previous episodes of delusion ended. See the chart above. What goes way up, eventually goes way down.

Q: Doesn’t QE, zero interest rate policy and (insert your excuse for ignoring history here) mean that this time is different?
A: Not really. The main thing that has been legitimately “different” in the half-cycle since 2009 is that QE loosened the overlap and increased the delay between the emergence of extremely overvalued, overbought, overbullish syndromes and the onset of risk aversion among investors. The fact that QE-induced yield-seeking could induce such a sustained gap between these two was clearly a surprise to us. However, it remains true that once market internals and credit spreads indicate a shift in investor risk preferences, stocks are prone to abrupt losses – particularly when overvalued, overbought, overbullish conditions have recently been in place. This has been true even in instances since 2009.

Q: Why are market internals and credit spreads deteriorating?
A: Historically, the “catalysts” that provoke a shift in risk aversion typically become clear only after the fact. Our impression is that the plunge in oil prices and safe-haven Treasury yields, coupled with the rise in yields on default-sensitive assets such as junk debt is most consistent with an abrupt slowing in global economic activity.

Q: Is the market likely to crash?
A: We certainly wouldn’t rely on a crash, but frankly, we currently observe nothing that would prevent something that might feel like an “air pocket” or “free fall.” Crashes represent points where many investors simultaneously shift toward risk-aversion and too few investors are on the other side to buy the stock offered for sale – except at a sharp discount. They have tended to unfold after the market has already lost 10-14% and the recovery from that low fails. We would allow for that possibility, but our discipline is firmly centered on responding to observable market conditions as they emerge, and shifting as those conditions shift.

Read all of John Hussman’s Weekly Letter

How This Great Race to Disaster Finally Ends

Guest by Bill Bonner


763px-Crossroads_baker_explosion_

Source: Wikimedia.com

Dear Diary,

The Dow rose 323 points yesterday, or 1.8%.

People come to think what they must think when they must think it. But what do they think now? Why do they think stocks are so valuable?

Apparently, they believe that Janet Yellen, Mario Draghi and Haruhiko Kuroda – the powers that be – will continue to make stocks go up.

The Fed has stopped active liquidity pumping. But it still has its hand on the pump handle, just in case.

The European Central Bank is promising and preparing to pump as soon as it can get the Germans out of the way. And the Japanese – the world leaders in modern state finance – are pumping with both hands.

Gaming the System

Since 2009, the Fed has put more than $3.5 trillion to work on investors’ behalf.

This – along with the help of the ECB, the Bank of Japan, the Bank of England, the People’s Bank of China, etc. – has helped lift stock markets by $18 trillion.

And corporate chiefs – now back in their cushy seats after the holidays – are borrowing more money to buy their own shares. They, more than anyone else, have figured out how to game the Fed’s system.

They take the Fed’s zero-interest-rate credit. And they use it to buy back their own shares. This pushes up the value of the remaining shares. Which leads to big, fat bonuses.

And so one of the wonders of the modern financial world unfolds before our dumbstruck eyes: borrowing from someone who has no money… charging it to someone else’s account… and pocketing a good part of the cash.

The average S&P 500 CEO got an $11.7 million compensation package in 2013. Last year must have been even better, though we don’t have the figures yet.

Meanwhile, the dollar rises and foreign investors move their money into US stocks and bonds, seeking safety and capital return in a market where the former is illusory and the latter is fraudulent.

Good luck to them all!

Sooner or later Mr. Market will have his say. He always does.

Bubbles Always Pop

But this may need explanation…

If central banks are committed to pumping more money into the system (birds gotta fly, fish gotta swim, the Fed’s gotta pump), why should stocks ever fall?

Good question. Beneath the phony market created by artificial intervention is a real market. Real buyers and real sellers.

At some point, the supply exceeds the demand. Then the smartest people in the room get worried. They move toward the door… quietly.

Then the next smartest people notice that the geniuses have left the room… and they, too, begin edging toward the door. Then short sellers move in. Prices drop. And pretty soon, the market is in free-fall.

That is what always happens. Bubbles always pop. It happened to the dot-coms, to houses, to subprime mortgage companies, to oil and to the oil-slick debt.

A Frightening Fall

“Prospects dim for US high-yield debt,” reports the Financial Times.

We have no special insight into this process. But we have faith in it. Nothing lasts forever; of that we are sure.

We also have faith in certain reliable patterns of human behavior. No one escapes the cemetery. And markets follow boom-bust cycles. Always have. Always will.

We are now in what appears to be a boom cycle on Wall Street. It could last much longer… and go much further.

Often, a boom of this magnitude needs an all-out, barn-burning, super-duper final stage before it blows up.

Our guess – and it is just a guess – is that there will be another big scare before the final top of the equity bubble is achieved.

We expect a frightening fall… a quick reaction from the Fed… and then the great race to disaster will enter its Last Looney Lap.

Regards,

Signature

Bill

P.S. But when will the big scare happen – and more importantly, when will that scare lead the markets to the final top? Have you prepared for that time? If not, there’s a simple yet important way for you to protect your capital in the coming catastrophe. Perhaps better, there’s even a specific action plan you can take to produce massive gains in the aftermath. Here’s how you can put your own protection and profit plan into place.

PEAK BAKKEN

The number of oil rigs operating in North Dakota was already declining before the epic plunge in oil prices. That was when Bakken crude was fetching $60 to $70 per barrel. It sells at a steep discount to WTI. Guess what it is selling for today? How about $41.75. How many heavily indebted oil drillers can make money at $41.75? A helluva lot less than two months ago.

What I love about the internet is you can find serious research done by people who understand an industry, but are not being paid to sell a story. The report below is filled with data, facts and truth. You will get none of that from the shills and morons paraded on CNBC or quoted in the Wall Street Journal. They are selling bullshit and propaganda.

I am no expert on shale oil extraction, but I understand supply, demand, extreme debt levels, and mal-investment. The great shale oil boom is over. It was created by Wall Street and the Federal Reserve. All booms go bust. This bust might be the trigger for a bigger bust. Get ready for another taxpayer bailout.

A commenter on Zero Hedge named Cooter describes exactly what I believe will happen. Enjoy this momentary relief in energy prices because this bust will insure much higher prices later.

Just to put the current US oil boom into further perspective, over the past five years global oil production has increased by 3.85 million bpd. During that same time span, US production increased by 3.22 million bpd — 83.6 percent of the total global increase. Had the US shale oil boom never happened and US production continued to decline as it had for nearly 40 years prior to 2008, the global price of oil might easily be at $150 to $200 a barrel by now. Without those additional barrels on the market from (primarily) North Dakota and Texas, the price of crude would have risen until supply and demand were in balance.

While the speculation about prices is just that, the role of the frack industry in proping up global production is not. That oil is coming off the market going forward. So, we are setting up for a double whammy … prices go down and take out all the marginal production … and then if there is even a whiff of recovery, prices are going way back up as supply won’t be able to track demand globally.

Via Peak Oil Barrel 

Bakken and North Dakota Production Report

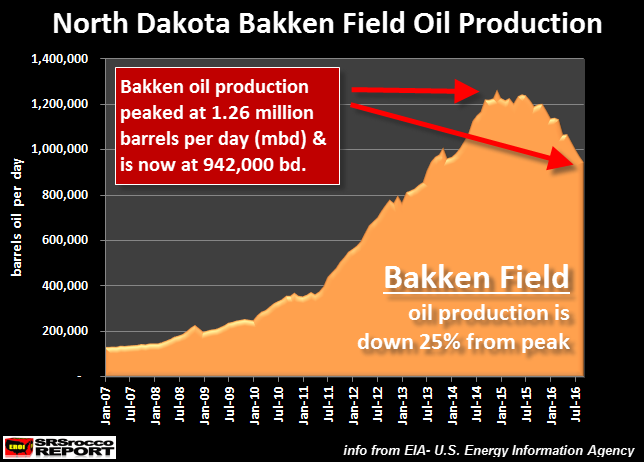
The North Dakota Industrial Commission just published their Bakken Monthly Oil Production Statistics and also their ND Monthly Oil Production Statistics.

Bakken Barrels Per Day 2

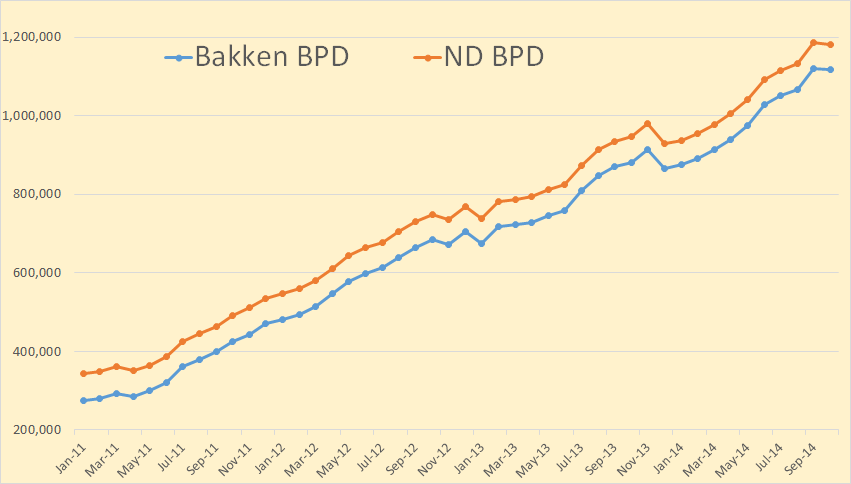
Bakken production was down 1,598 barrels per day to 1,118,010 bpd. All North Dakota production was down 4,054 bpd to 1,182,174 bpd.

From the Director’s Cut, bold mine:

The drilling rig count dropped 2 from September to October, an additional 3 from October to November, and has since fallen 5 more from November to today. The number of well completions decreased from 193(final) in September to 134(preliminary) in October. Three significant forces are driving the slow-down: oil price, flaring reduction, and oil conditioning. Several operators have reported postponing completion work to achieve the NDIC gas capture goals. There were no major precipitation events, but there were 9 days with wind speeds in excess of 35 mph (too high for completion work).

The drillers outpaced completion crews in October. At the end of October there were about 650 wells waiting on completion services, an increase of 40.

Crude oil take away capacity is expected to remain adequate as long as rail deliveries to coastal refineries keep growing.

Rig count in the Williston Basin is set to fall rapidly during the first quarter of 2015. Utilization rate for rigs capable of 20,000+ feet is currently about 90%, and for shallow well rigs (7,000 feet or less) about 60%.

Sep rig count 193
Oct rig count 191
Nov rig count 188
Today’s rig count is 183

Sep Sweet Crude Price = $74.85/barrel
Oct Sweet Crude Price = $68.94/barrel
Nov Sweet Crude Price = $60.61/barrel
Today Sweet Crude Price = $41.75/barrel (lowest since March 2009)

I just checked Rig Count. It now stands at 181 but one of them is drilling a salt water disposal well. So they have 180 rigs drilling for oil right now.

Bakken Wells Producing

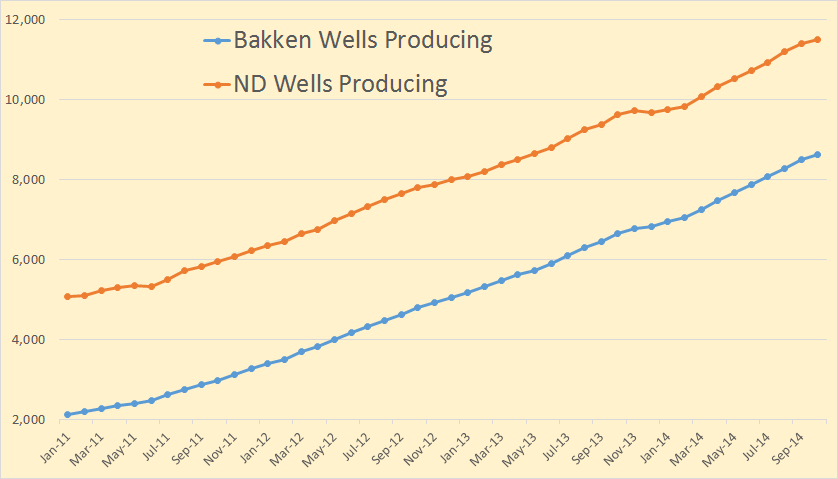
Bakken wells producing increased by 118 to 8,602 while North Dakota wells producing increased by 92 to 11,507. Since Bakken wells are included in the North Dakota count this means at least 26 wells outside the Bakken had to be shut down.

ND Prod per 1000

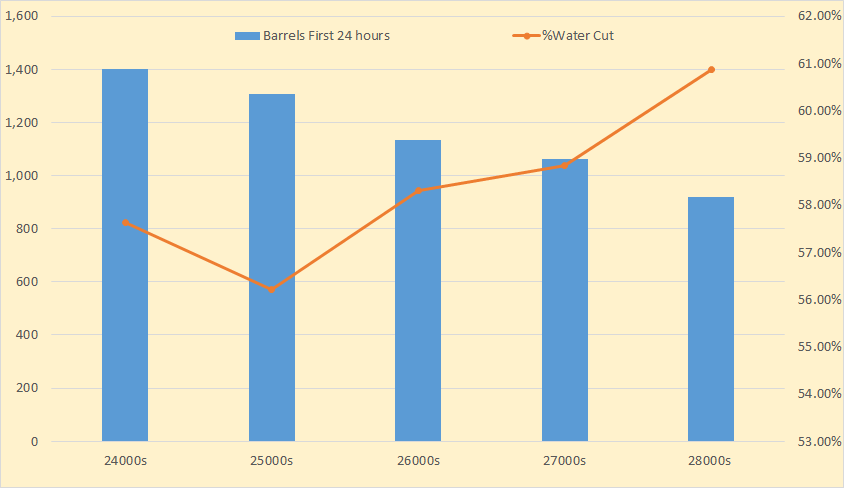
I am still tracking first 24 hours production by well numbers. I am now more convinced than ever that the first 24 hours production is a significant indicator of future production of that well. So far there are only 73 wells in the 28000s however.

ND First 24 hr

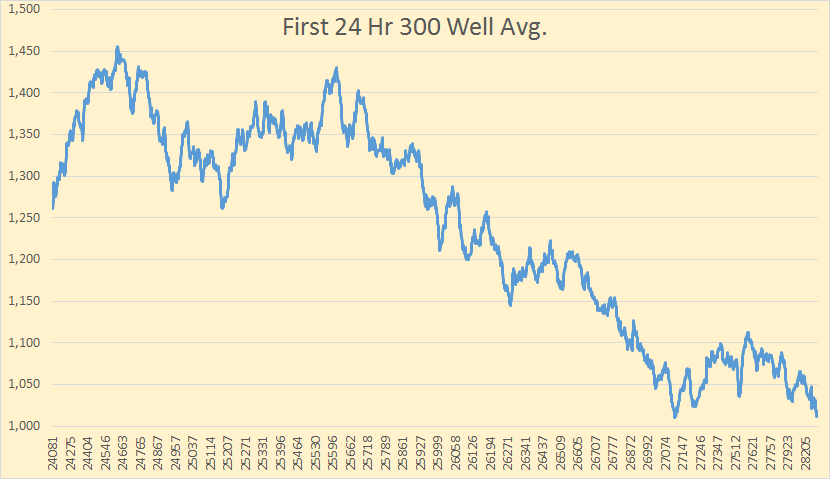
Using a 300 well average and sorting by well number you can see how the BOPD falls off as the well number gets higher. The 27000s seems to have leveled out but I believe it will keep falling as more higher well numbers come on line.

I have 2 weeks worth of data for December. There are 121 wells brought on line so far in December. But concerning the first 24 hours of water cut.

Bakken Dec. Water Cut

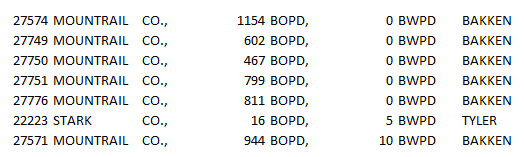
Everyone is telling me the first 24 hours is all fracking water so it means nothing. Welllll… I think the drillers have some way of accounting for that. I sorted the 121 wells I have so far for December by barrels of water per day. Above you see the seven wells with the lowest water cut. If the water that comes up the first 24 hours is all fracking water then there is a problem here. I am willing to hear opinions of what that problem is because I haven’t a clue.

Incidentally at the other end of the sort, the seven wells with the highest water in the first 24 hours, averaged 5,396 barrels of water per well and 1,898 barrels of oil per well.

Bakken Barrels Per Day

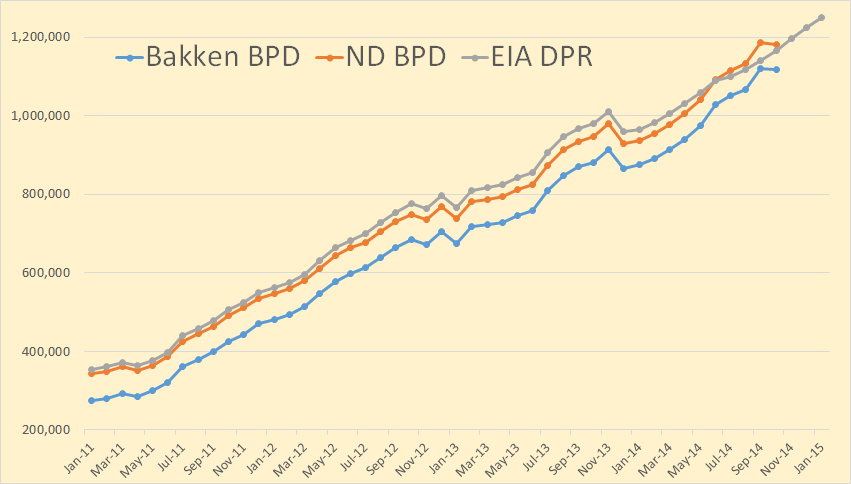
I have included the the Bakken data from the EIA’s Drilling Productivity Report here. Their data is for all the Bakken, including the Montana part, but not the non Bakken part of North Dakota. Their data goes through January 2015. The last six months of the DPR data is nothing but a wild guess.

I wanted to show the DPR data because people and the media keep pointing to it as if it were gospel as to what will be produced from all shale fields within the next two months. For instance this article: EIA: Despite lower crude oil prices, U.S. crude oil production expected to grow in 2015.

The recent decline in crude oil prices has created the potential for weaker crude oil production. EIA’s Drilling Productivity Report (DPR) includes indicators that provide details on the effect low prices may have on tight oil production, which accounts for 56% of total U.S. oil production. Analyzing these indicators and the changes in oil production following the drop in crude oil prices during the 2008-09 recession may offer some insight into possible near-term oil production trends.

They are expecting great things, at least through January 2015. From their report:

DPR Expectations

They are expecting light tight oil to be up 116,000 barrels per day in January. They think the Bakken will be up 27,000 bpd in January and Texas’ Eagle Ford and the Permian to be up a whopping 76,000 barrels per day.

DPR Report

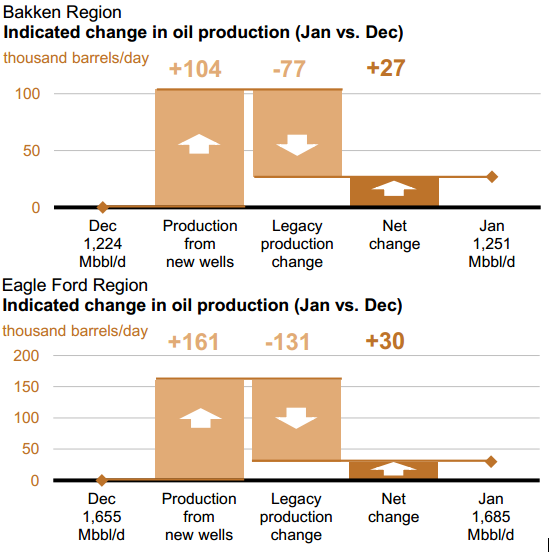
I did the math. If these decline rates are right, then in January, these two fields will decline by 208,000 barrels per day. That is they will have to produce 208,000 barrels of new oil in January just to break even. Or if production declines by just 21.5% they will just break even. I expect new well production from these two fields, for most months next year, to be well below 208,000 barrels per day

The IEA has lowered their expectations for 2015 but only slightly.
Oil Market Report

Global production fell by 340 kb/d in November to 94.1 mb/d on lower OPEC supplies. Annual gains of 2.1 mb/d were split evenly between OPEC and non-OPEC. Surging US light tight oil supply looks set to push total non-OPEC production to record growth of 1.9 mb/d this year, but the pace is expected to slow to 1.3 mb/d in 2015.

Note: I send an email notice when I publish a new post. If you would like to receive that notice then email me at DarwinianOne at Gmail.com.

SHALE BUST HAS BEGUN WITH A FURY

In the last few days I’ve noticed a plethora of news stories from the usual suspects in the corporate mainstream media about how shale oil producers can still make a profit with oil selling for $66 a barrel. All of a sudden their breakeven costs are supposedly $40 per barrel or lower. That’s funny, because every legitimate estimate prior to this year was that oil needed to stay above $80 per barrel just so they could breakeven. When you see the new propaganda, you realize the entire shale miracle is nothing more than a Wall Street hyped debt financed Ponzi scheme. The Wall Street shysters are sending out their mouthpieces to lie, obfuscate, and mislead the public into thinking this fraud is still legitimate. The MSM pundits don’t even question the lies because their living depends upon perpetuating the lies.

The truth is revealed by the actions of the participants in the shale boom. The companies whose existence depends upon generating profits and cash flow will always take actions that will be in their own self interest. No company purposely takes actions to lose more money. All of the happy talk was just revealed to be false.

New shale oil wells are expensive to begin and are 90% depleted after 2 years. Those are facts. Permits for new wells absolutely COLLAPSED in November. A 40% decline in one month is an epic collapse. If the Wall Street shysters were telling the truth and breakeven costs are really $40 per barrel, why would drillers stop drilling new wells when oil prices are $66? They wouldn’t.

The shale oil boom is only sustainable at $100 a barrel oil. The Arabs know it. The big oil companies know it. The drillers know it. And the Wall Street shysters know it. The peak in U.S. oil production has arrived again, until prices go back up to $100 a barrel.

Facts don’t cease to be facts because they are ignored. Reality really is a bitch.


Exclusive: New U.S. oil and gas well November permits tumble nearly 40 percent

Photo
Tue, Dec 2 2014

By Kristen Hays

HOUSTON (Reuters) – Plunging oil prices sparked a drop of almost 40 percent in new well permits issued across the United States in November, in a sudden pause in the growth of the U.S. shale oil and gas boom that started around 2007.

Data provided exclusively to Reuters on Tuesday by industry data firm Drilling Info Inc showed 4,520 new well permits were approved last month, down from 7,227 in October.

The pullback was a “very quick response” to U.S. crude prices, which settled on Tuesday at $66.88 CLc1, said Allen Gilmer, chief executive officer of Drilling Info.

New permits, which indicate what drilling rigs will be doing 60-90 days in the future, showed steep declines for the first time this year across the top three U.S. onshore fields: the Permian Basin and Eagle Ford in Texas and North Dakota’s Bakken shale.

The Permian Basin in West Texas and New Mexico showed a 38 percent decline in new oil and gas well permits last month, while the Eagle Ford and Bakken permit counts fell 28 percent and 29 percent, respectively, the data showed.

That slide came in the same month U.S. crude oil futures fell 17 percent to $66.17 on Nov. 28 from $80.54 on Oct. 31. Prices are down about 40 percent since June.

U.S. prices fell below $70 a barrel last week after the Organization of Petroleum Exporting Countries agreed to maintain output of 30 million barrels per day. Analysts said the cartel is trying to squeeze U.S. shale oil producers out of the market.

Total U.S. production reached an average of 8.9 million barrels per day in October, and is expected to surpass 9 million bpd in December, the highest in decades, according to the U.S. Energy Information Administration.

Gilmer said last month’s pullback in permits was more about holding off on drilling good locations in a low-price environment than breaking even on well economics.

“I think in this case this was just a quick response, saying ‘there are enough drill sites in the inventory, let’s sit back, take a look and see what happens with prices,'” he said.

In addition to the Permian, Eagle Ford and Bakken, about 10 other regions tracked in Drilling Info’s data showed declines as well. The Niobrara shale in Colorado and Wyoming saw a 32 percent decline in new permits, while the Granite Wash in Oklahoma and Texas and Mississippian Lime in Oklahoma and Kansas retreated 30 percent and 27 percent, respectively.

Gilmer said the pullback in new permits is a precursor to a decline in rigs. The U.S. land rig count has been largely flat since September, hovering around 1,860 oil and gas rigs, according to Baker Hughes Inc (BHI.N: Quote, Profile, Research, Stock Buzz).

“This will show up,” he said. “I expect we’ll start seeing rig impact in a couple of months.”

Share prices of drillers including Patterson UTI Energy Inc (PTEN.O: Quote, Profile, Research, Stock Buzz), Helmerich & Payne Inc (HP.N: Quote, Profile, Research, Stock Buzz) and Nabors (NBR.N: Quote, Profile, Research, Stock Buzz) were slightly lower on Tuesday.


(Reporting By Kristen Hays; Editing by Terry Wade and Alan Crosby)