The Ghost of Christmas Present

Guest Post by Jim Kunstler

Apparently one additional world leader turned up in Buenos Aires without fanfare this weekend. The General Secretary of the North Pole, known popularly as Santa Claus, took his latest-model hypersonic sleigh to the G-20 Meeting, and made sure that the global financial elite would find their Christmas stockings stuffed with sugarplums one last time before the great reflation bull market dies of incredulity.

Continue reading “The Ghost of Christmas Present”

Real Estate Speculation – Boom – Bust – Just Insanity

Guest Post by Martin Armstrong

Barlow Mansion Maple ShadeReal estate depends on how far down the rabbit hole we go. If government does not blink and it just keeps raising taxes trying to support a system that is unsustainable, then we end up in the full crash and burn and you are compelled to walk away from real estate. Hopefully, with education understanding the past, we can for once avoid the same outcome and advance in this learning curve of civilization.

Vacation properties are the worst to survive. I bought such a place to live in at about 50% of its 2007 high. So while high-end properties in cities were rising, vacation spots on the beach declined. I wanted beach front. So understanding the cycle helps tremendously for entry and exit points.

The risk of mortgages declining is real. As governments get in trouble, long-term confidence starts to decline. Banks will not longer be able to package mortgages. As that unfolds, the lack of the availability of mortgages means the only cash rules.

Continue reading “Real Estate Speculation – Boom – Bust – Just Insanity”

Bust In The US Shale Patch—–$36 Billion Of Negative Free Cash Flow In The Bakken

Via Stockman’s Contra Corner

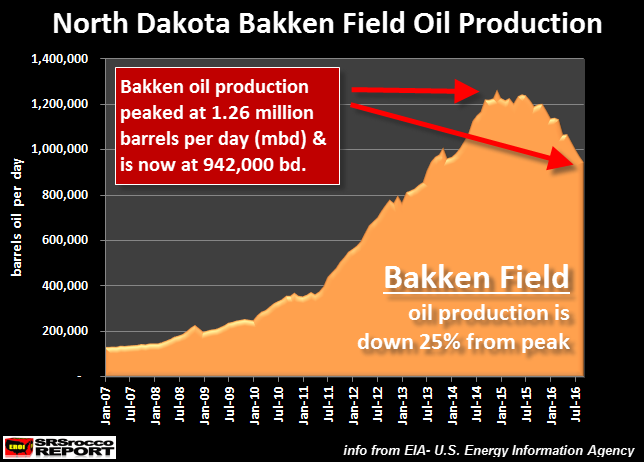
The Death of the Great Bakken Oil Field has begun and very few Americans understand the significance.  Just a few years ago, the U.S. Energy Industry and Mainstream media were gloating that the United States was on its way to “Energy Independence.”

Unfortunately for most Americans, they believed the hype and are now back to driving BIG SUV’s and trucks that get lousy fuel mileage.  And why not?  Americans now think the price of gasoline will continue to decline because the U.S. oil industry is able to produce its “supposed” massive shale oil reserves for a fraction of the cost, due to the new wonders of technological improvement.

I actually hear this all the time when I travel and talk to family, friends and strangers.  I gather they have no clue that the Great Bakken Oil Field is now down a stunning 25% from its peak in just a little more than a year and half ago:

Bakken Oil Field Production

Continue reading “Bust In The US Shale Patch—–$36 Billion Of Negative Free Cash Flow In The Bakken”

The Global Real Estate Bubble Is OFFICIALLY Bursting

Guest Post by Harry Dent

The global real estate bubble is bursting.

After imposing a hefty 26% tax on foreign buyers, and a 12% to 16% surcharge for buyers who flipped their house between one and two years, Singapore real estate has declined 21.5%.

Vancouver has taken similar measures, and – surprise, surprise – its real estate is down 24% in just five months!

That’s what I mean when I say that when bubbles burst, they do so dramatically and rapidly.

But this is likely just the beginning…

I put Singapore into razor-sharp focus in February of last year when I noted it had some of the most expensive real estate in the world. It has the highest standard of living of any country in Asia – even higher than in the U.S.!

The problem is that the country is 100% urban and has limited land – making it incredibly susceptible to the kind of bubble that’s formed there.

And boy, has one ever.

Continue reading “The Global Real Estate Bubble Is OFFICIALLY Bursting”

My Scary Chart

Jim Cramer and the rest of the captured MSM, along with their Wall Street puppet masters, captured political snakes, and crony capitalist corporate chieftains will tell you to ignore this scary chart. It’s different this time. The Fed has your back. The economy is booming. Stocks for the long term. Where else are you going to put your money? Trust us.

AND IT’S GONE!!!! 

Guest Post by Daniel Thorton

Hedgeye Guest Contributor | Thornton: My Scary Chart - Bubble bear cartoon 09.26.2014 1


I published the graph below in a recent essay titled, Why the Fed’s Zero Interest Rate Policy Failed, but the graph deserves special attention because of what it seems to imply for the economy going forward. The graph shows household net worth (wealth) as a percent of personal disposable income. Household net worth as a percent of disposable income increased dramatically in the mid-1990s. Its collapse precipitated the 2000 recession. It increased even more dramatically during the subsequent expansion only to collapse again, precipitating the 2007 – 2009 recession.


Hedgeye Guest Contributor | Thornton: My Scary Chart - thornton1


Once again, household net worth has increased dramatically. Since the end of 2012 it has increasing by nearly 100 percentage points to 640% of disposable income. This is scary; not just because it is an incredibly large rise in wealth in a short period of time, but because it happened twice before with very bad consequences.

Continue reading “My Scary Chart”

THIS TIME ISN’T DIFFERENT

Last year ended with a whimper on Wall Street. The S&P 500 was down 1% for the year, down 4% from its all-time high in May, and no higher than it was 13 months ago at the end of QE3. The Wall Street shysters and their mainstream media mouthpieces declare 2016 to be a rebound year, with stocks again delivering double digit returns. When haven’t they touted great future returns. They touted them in 2000 and 2007 too. No one earning their paycheck on Wall Street or on CNBC will point out the most obvious speculative bubble in history. John Hussman has been pointing it out for the last two years as the Fed created bubble has grown ever larger. Those still embracing the bubble will sit down to a banquet of consequences in 2016.

At the peak of every speculative bubble, there are always those who have persistently embraced the story that gave the bubble its impetus in the first place. As a result, the recent past always belongs to them, if only temporarily. Still, the future inevitably belongs to somebody else. By the completion of the market cycle, no less than half (and often all) of the preceding speculative advance is typically wiped out.

Hussman referenced the work of Reinhart & Rogoff when they produced their classic This Time is Different. Every boom and bust have the same qualities. The hubris and arrogance of financial “experts” and government apparatchiks makes them think they are smarter than those before them. They always declare this time to be different due to some new technology or reason why valuations don’t matter. The issuance of speculative debt and seeking of yield due to Federal Reserve suppression of interest rates always fuels the boom and acts as the fuse for the inevitable explosive bust.

Continue reading “THIS TIME ISN’T DIFFERENT”

MARKET WILL BE DEFANGED

Despite all the propaganda and cheerleading by CNBC and the rest of the MSM faux journalists, the stock market has been stuck in neutral for the last year. The S&P 500 stood at 2,089 on December 26, 2014. It presently stands at 2,089 on November 22, 2015. It is trading 2% below its all-time high, reached in July. It’s up a measly 3.5% since the day the Fed turned off the QE spigot in October 2014. And that’s the good news.

Without the ridiculous “internet bubble like” ascension of Facebook, Amazon, Netflix, and Google, the stock market would be deep in the red this year. Three of these companies barely make money. They are all overvalued by at least 70%. Most of the stocks in the S&P 500 are trading in the red this year. When the breadth of advancers narrows to a few over-hyped Wall Street superstar stocks (think Cisco, Dell, Microsoft, Enron, Worldcom in 2000) the bull market is on its last legs.

Wall Street is luring more muppets into these FANG stocks before the slaughter commences. These stocks will be trading at least 50% lower in less than two years. Book it.

Courtesy of: Visual Capitalist

Facebook, Amazon, Netflix, and Google created over $440 in value over 2015

In the sixth year of the bull run, the U.S. large cap market has had its ups and downs. The S&P 500 peaked at 2134.7 in the early summer months, and promptly collapsed to 1867 points during the August flash crash.

Today, it’s back in black, but only trading just over 1% higher than it started the year.

The only reason that has made this possible is the legendary performance of four tech stocks: Facebook, Amazon, Netflix, and Google (now called “Alphabet Inc.”). Together, the “FANG” stocks have created an impressive $440 billion in market capitalization since January.

For comparisons sake: that’s over 2/3 the size of Apple’s current market cap.

Continue reading “MARKET WILL BE DEFANGED”

Chart Of The Day: NASDAQ 2000 And Shanghai 2015 Resemble Hand-In-Glove

The Chinese authorities are desperately attempting to keep their staock market bubble inflated. The government bought stocks last night, driving it higher by 5% in the last hour of trading. Whenever central bankers and politicians allow the free market to decide, markets go into collapse mode. They can print more fiat to prop things up for awhile, but they are only making the ultimate collapse far worse.

Ludwig von Mises’ words of wisdom still apply today:

“There is no means of avoiding the final collapse of a boom brought about by credit expansion. The alternative is only whether the crisis should come sooner as the result of a voluntary abandonment of further credit expansion, or later as a final and total catastrophe of the currency system involved.”

Via David Stockman’s Contra Corner


SF – NO BUBBLE HERE

The charts below certainly reflect a rational free market trend. Right? Home prices always double in the space of three years when the economy is limping along with sub 2% GDP growth and median real household income is still 7% below the levels of 2007 and equal to levels of 1989. These are the median home prices, so they aren’t even skewed by the really high end prices.

San Francisco is now unaffordable to 99% of the US population. Only the richest of the rich can afford to live there. The titans of technology usually lean to the left and spout gibberish about equal rights, going green, and fighting poverty as they occupy gated estates with armed guards to keep the riff raff out. They want the rest of the country to do what they say, not what they do. They don’t want the peasants living near them. The help can live in Stockton and take the bus to arrive on time to clean their toilets.

US-San-Francisco-home-prices-Paragon-2012-2015-04

Continue reading “SF – NO BUBBLE HERE”

Is This A Blow-Off Top? Four Ways To Tell

Submitted by Charles Hugh-Smith of OfTwoMinds blog,

Those who lived through the last two speculative blow-off tops know the impossibility of predicting the final top.

How can we tell if stocks are in the final blow-off stage of a bubble? There are four basic give-aways:

1. Parabolic rises in stocks and speculative debt.

2. The mainstream financial media claims the clearly visible bubbles are justified by fundamentals.

3. Conventional financial authorities insist this is not a blow-off top.

4. The expressions of regret of those who sat out the latest rally become ubiquitous.

In the past few days, I have read two laughably baseless justifications of the bubble in Chinese stocks by conventional financial analysts:

A) China is a “black box,” i.e. unfathomable, so go with what we know, which is that China is a nation of entrepreneurs: this is the green light to buy the bubble here if you want to reap easy profits.

B) The stock market bubble in China is positive evidence of a healthy re-adjustment of China’s financial system.

That neither thesis has the slightest foundation in reality doesn’t matter, as the real agenda of the analysts is to justify their own attempts to join the crowd reaping vast profits in the bubble.

This denial that a speculative blow-off is clearly occurring is a key indicator that a blow-off top is in its final stages.

Continue reading “Is This A Blow-Off Top? Four Ways To Tell”

This Is What Happens When The Government Cracks Down On Subprime Auto Loans

Who could have seen this coming? Oh yeah. Me.

Tyler Durden's picture

A running theme here has been the great rotation of bubble-blowing credit from subprime housing to subprime auto-loans. Amid government probes of underwriting standards and soaring delinquencies, it appears when the least-creditworthy Americans are cut off from debt servitude, bad things happen in car sales…

  • *FORD FEB. U.S. LIGHT-VEHICLE SALES FALL 2.0%, EST. UP 5.8% (miss!)
  • *GM FEB. U.S. AUTO SALES UP 4.2%, EST. UP 5.9% (miss!)
  • *NISSAN FEB. U.S. AUTO SALES UP 2.7%, EST. UP 3.8% (miss!)
  • *FIAT CHRYSLER FEB. U.S. AUTO SALES UP 5.6%, EST. UP 8.2% (miss!)
  • *HONDA FEB. U.S. AUTO SALES RISE 5%, EST. UP 11% (miss!)
  • *TOYOTA FEB. U.S. AUTO SALES RISE 13.3%, EST. UP 15%( miss!)

Of course, the real blame – as we will be told – is the weather… It seems Obama’s new American Dream of a brand new Ford or GM (or Maserati) in every driveway may be another broken promise.

  • *FORD SAYS WEAK TEXAS SALES MAY HAVE BEEN WEATHER RELATED

So did the analysts that forecast sales not know that there was weather? not know the seasonals in fleet sales?

This won’t end well…


Continue reading “This Is What Happens When The Government Cracks Down On Subprime Auto Loans”

BREAKING BAD (DEBT) – EPISODE THREE

In Part One of this three part article I laid out the groundwork of how the Federal Reserve is responsible for the excessive level of debt in our society and how it has warped the thinking of the American people, while creating a tremendous level of mal-investment. In Part Two I focused on the Federal Reserve/Federal Government scheme to artificially boost the economy through the issuance of subprime debt to create a false auto boom. In this final episode, I’ll address the disastrous student loan debacle and the dreadful global implications of $200 trillion of debt destroying the lives of citizens around the world.

Getting a PhD in Subprime Debt

“When easy money stopped, buyers couldn’t sell. They couldn’t refinance. First sales slowed, then prices started falling and then the housing bubble burst. Housing prices crashed. We know the rest of the story. We are still mired in the consequences. Can someone please explain to me how what is happening in higher education is any different?This bubble is going to burst.” Mark Cuban

 http://www.nationofchange.org/sites/default/files/StudentLoanDebt070313_0.jpeg

Now we get to the subprimiest of subprime debt – student loans. Student loans are not officially classified as subprime debt, but let’s compare borrowers. A subprime borrower has a FICO score of 660 or below, has defaulted on previous obligations, and has limited ability to meet monthly living expenses. A student loan borrower doesn’t have a credit score because they have no credit, have no job with which to pay back the loan, and have no ability other than the loan proceeds to meet their monthly living expenses. And in today’s job environment, they are more likely to land a waiter job at TGI Fridays than a job in their major. These loans are nothing more than deep subprime loans made to young people who have little chance of every paying them off, with hundreds of billions in losses being borne by the ever shrinking number of working taxpaying Americans.

Student loan debt stood at $660 billion when Obama was sworn into office in 2009. The official reported default rate was 7.9%. Obama and his administration took complete control of the student loan market shortly after his inauguration. They have since handed out a staggering $500 billion of new loans (a 76% increase), and the official reported default rate has soared by 43% to 11.3%. Of course, the true default rate is much higher. The level of mal-investment and utter stupidity is astounding, even for the Federal government. Just some basic unequivocal facts can prove my case.

There were 1.67 million Class of 2014 students who took the SAT. Only 42.6% of those students met the minimum threshold of predicted success in college (a B minus average). That amounts to 711,000 high school seniors intellectually capable of succeeding in college. This level has been consistent for years. So over the last five years only 3.5 million high school seniors should have entered college based on their intellectual ability to succeed. Instead, undergraduate college enrollment stands at 19.5 million. Colleges in the U.S. are admitting approximately 4.5 million more students per year than are capable of earning a degree. This waste of time and money can be laid at the feet of the Federal government. Obama and his minions believe everyone deserves a college degree, even if they aren’t intellectually capable of earning it, because it’s only fair. No teenager left behind, without un-payable debt.

Continue reading “BREAKING BAD (DEBT) – EPISODE THREE”

BREAKING BAD (DEBT) – EPISODE ONE

“At this juncture, the impact on the broader economy and financial markets of the problems in the subprime market seems likely to be contained.”Fed chairman, Ben Bernanke, Congressional testimony, March, 2007

“Capitalism without financial failure is not capitalism at all, but a kind of socialism for the rich.”James Grant, Grant’s Interest Rate Observer

The Federal Reserve issued their fourth quarter Report on Household Debt and Credit last week to the sounds of silence in the mainstream media. There were minor press releases issued by the “professional” financial journalists regurgitating the Federal Reserve’s storyline. Actual analysis, connecting the dots, describing how the massive issuance of student loan and auto loan debt has produced a fake economic recovery, and how the accelerating default rates in auto loans and student loans will produce the next subprime debt implosion, were nowhere to be seen on CNBC, Bloomberg, the WSJ, or any other status quo propaganda media outlet. Their job is not to analyze or seek truth. Their job is to keep their government patrons and Wall Street advertisers happy, while keeping the masses sedated, misinformed, and pliable.

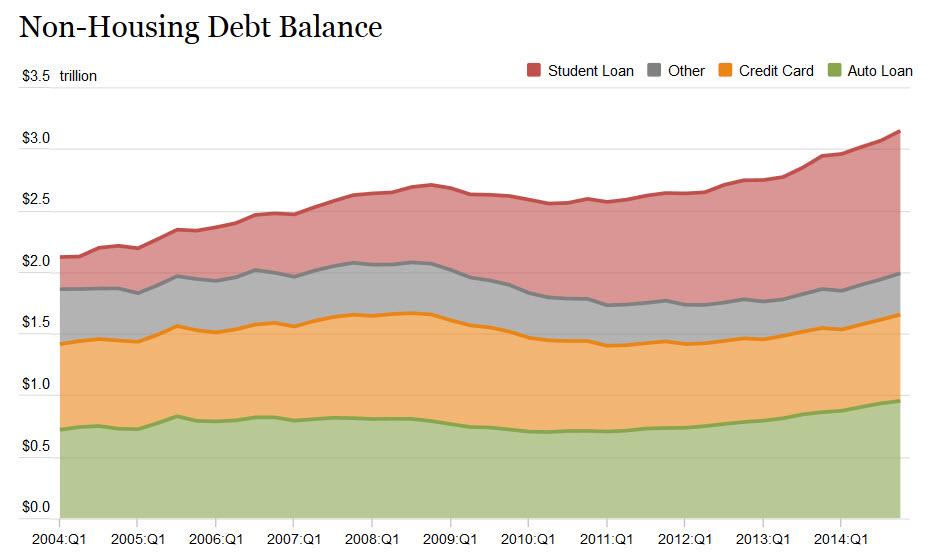
Luckily, the government hasn’t gained complete control over the internet yet, so dozens of truth telling blogs have done a phenomenal job zeroing in on the surge in defaults. The data in the report tells a multitude of tales conflicting with the “official story” sold to the public. The austerity storyline, economic recovery storyline, housing recovery storyline, and strong auto market storyline are all revealed to be fraudulent by the data in the report. Total household debt grew by $117 billion in the fourth quarter and $306 billion for the all of 2014. Non-housing debt in the 4th quarter of 2008, just as the last subprime debt created financial implosion began, was $2.71 trillion. After six years of supposed consumer austerity, total non-housing debt stands at a record $3.15 trillion. This is after hundreds of billions of the $2.71 trillion were written off and foisted upon the backs of taxpayers, by the Wall Street banks and their puppets at the Federal Reserve.

The corporate media talking heads cheer every increase in consumer debt as proof of economic recovery. In reality every increase in consumer debt is just another step towards another far worse economic breakdown. And the reason is simple. Real median household income is still below 1989 levels. The average American family hasn’t seen their income go up in 25 years. What they did see was their chains of debt get unbearably heavy. Non-housing consumer debt (credit card, auto, student loan, other) was $800 billion in 1989.

Continue reading “BREAKING BAD (DEBT) – EPISODE ONE”

CHINESE STOCKS CRASH

Does it seem like things are beginning to fall apart? Day after day, something blows up, shatters, or disintegrates. This is how Fourth Turnings roll. They always intensify as time goes on.

Chinese Stocks Crash Most Since Feb 2007, Futures Limit-Down After Regulatory Crackdown On Margin-Trading

Tyler Durden's picture

UPDATE:

  • *SHANGHAI COMPOSITE HEADS FOR BIGGEST LOSS SINCE FEBRUARY 2007
  • *CHINA CSI 300 INDEX FUTURES FALL BY 10% LIMIT

*  *  *

Who could have seen this coming?


Having tried and failed once to stem the speculative frenzy in Chinese stocks, regulators took more direct action tonight and suspended three of the biggest securities firms from adding margin-finance and securities lending accounts for three months following rule violations. As Bloomberg reports, Citic Securities, Haitong Securities, and Guotai Junan Securities shares plunged dragguing the entire Shanghai Composite down almost 7% and negative year-to-date.

Continue reading “CHINESE STOCKS CRASH”

1929 – 2000 – 2015

Based on the average of four separate valuation models that have been accurate in assessing whether the stock market is overvalued or undervalued over the last century, the stock market is currently over valued by 89%. The stock market was overvalued by 88% before the 1929 Crash. It was “only” overvalued by 74% in 2007 before the last Crash. It has only been more overvalued once in market history – 2000. I wonder what happened after that?

If you were paying attention in Statistics class in college, you know that when something reaches 2 standard deviations from the mean, you’ve reached EXTREME levels. The market valuation is now past 2 standard deviations. Anyone staying in the market or buying today is betting on the market to reach 2000 internet bubble proportions. I’ll pass. You will be lucky to “achieve” a negative 2% nominal return over the next ten years. After taking inflation into account you will likely end up with a -5% to -10% annual return, with a crash thrown in for good measure.

Betting on a 2000 level of overvaluation is even more foolish when you take into account the fact the overvaluation was centered solely on tech and internet stocks. Large cap value stocks were significantly undervalued in 2000. The chart below from former perma-bull Jim Paulson at Wells Fargo reveals the foreboding truth. The median price/earnings ratio is now the highest in U.S. history. It is 45% higher than it was in 2000. It is 15% higher than it was in 2007.

John Hussman answers a few pertinent questions below. But the gist of the situation is simple. The stock market is overvalued equal to or more than it was in 1929, 2000, and 2007. The reason it has gotten this far is the $3.5 trillion of Federal Reserve fiat handed to the Wall Street banks and the ridiculous faith in these Ivy League educated puppets to engineer never ending stock market gains.

Greed has been winning for the last five years. Fear has been creeping in, especially since QE3 ended in October. The increased volatility is a warning signal. Fear will be reasserting itself, and it will happen suddenly. Buying the dip will stop working. Faith in central bankers will dissipate and reality will be a bitch. This episode of delusion will end just as all the previous episodes of delusion ended. See the chart above. What goes way up, eventually goes way down.

Q: Doesn’t QE, zero interest rate policy and (insert your excuse for ignoring history here) mean that this time is different?
A: Not really. The main thing that has been legitimately “different” in the half-cycle since 2009 is that QE loosened the overlap and increased the delay between the emergence of extremely overvalued, overbought, overbullish syndromes and the onset of risk aversion among investors. The fact that QE-induced yield-seeking could induce such a sustained gap between these two was clearly a surprise to us. However, it remains true that once market internals and credit spreads indicate a shift in investor risk preferences, stocks are prone to abrupt losses – particularly when overvalued, overbought, overbullish conditions have recently been in place. This has been true even in instances since 2009.

Q: Why are market internals and credit spreads deteriorating?
A: Historically, the “catalysts” that provoke a shift in risk aversion typically become clear only after the fact. Our impression is that the plunge in oil prices and safe-haven Treasury yields, coupled with the rise in yields on default-sensitive assets such as junk debt is most consistent with an abrupt slowing in global economic activity.

Q: Is the market likely to crash?
A: We certainly wouldn’t rely on a crash, but frankly, we currently observe nothing that would prevent something that might feel like an “air pocket” or “free fall.” Crashes represent points where many investors simultaneously shift toward risk-aversion and too few investors are on the other side to buy the stock offered for sale – except at a sharp discount. They have tended to unfold after the market has already lost 10-14% and the recovery from that low fails. We would allow for that possibility, but our discipline is firmly centered on responding to observable market conditions as they emerge, and shifting as those conditions shift.

Read all of John Hussman’s Weekly Letter