THE WALL WAS TOO HIGH, AS YOU CAN SEE

Hey you, out there in the cold
Getting lonely, getting old
Can you feel me?
Hey you, standing in the aisles
With itchy feet and fading smiles
Can you feel me?
Hey you, don’t help them to bury the light
Don’t give in without a fight

Pink Floyd – Hey You

Fight Against the New World Order" Art Board Print by oliveribanez | Redbubble

I wrote an article in December 2012, a week after the Newtown school shooting, called Hey You. My interpretation of this classic Pink Floyd song was related to how our culture has created generations of alienated and isolated people, allowing Big Pharma to peddle their pharmaceutical concoctions to the masses as the “easy” solution to living “normally” in a profoundly abnormal society. My contention was these mass shootings by young men (Newtown, Columbine, Aurora, Virginia Tech, Tucson) were caused by the Big Pharma psychotropic drugs prescribed to all these young killers by sick industry peddlers (aka physicians).

The hugely profitable Big Pharma solution to alienation, isolation and depression is drugs that turn a percentage of those afflicted into psychotic killers. The article’s premise was how our techno-narcissistic society, encouraged and enabled by our totalitarian overlords through mind manipulation, drugs, public education indoctrination, and propaganda, has purposely created the alienation, isolation, and hopelessness to further their goals of power, control, and wealth.

Continue reading “THE WALL WAS TOO HIGH, AS YOU CAN SEE”

NO ONE GETS OUT OF HERE ALIVE

“The seasons of time offer no guarantees. For modern societies, no less than for all forms of life, transformative change is discontinuous. For what seems an eternity, history goes nowhere – and then it suddenly flings us forward across some vast chaos that defies any mortal effort to plan our way there. The Fourth Turning will try our souls – and the saecular rhythm tells us that much will depend on how we face up to that trial. The saeculum does not reveal whether the story will have a happy ending, but it does tell us how and when our choices will make a difference.”  – Strauss & Howe – The Fourth Turning

As we wander through the fog of history in the making, unsure who is lying and who is telling the truth, seemingly blind to what comes next, I look to previous Fourth Turnings for a map of what might materialize during the 2nd half of this current Fourth Turning. After a tumultuous, harrowing inception to this Crisis in 2008/2009, we have been told all is well and are in the midst of an eleven-year economic expansion, with the stock market hitting all-time highs.

History seemed to stop and we’ve been treading water for over a decade. Outwardly, the establishment has convinced the masses, through propaganda and money printing, the world has returned to normal and the future is bright. I haven’t bought into this provable falsehood. Looking back to the Great Depression, we can get some perspective on our current position historically.

Continue reading “NO ONE GETS OUT OF HERE ALIVE”

GOLDILOCKS IS DEAD

“Once you strip out the effects of the debt binge, the artificial stimulus via currency depreciation, and the fabled ‘wealth effect’ from the equity market runup, real GDP growth stripped-down to its core was the grand total of 0.7% last year. Potemkin would be proud.” David Rosenberg

It appears every president finds the religion of false economic narrative once they ascend to power. Trump never stops babbling and tweeting about the fantastic economy and raging jobs market since his election. He has embraced the stock market bubble as proof of his brilliant leadership, rather than the tens of trillions in debt propping up the most overvalued market in world history. Every president takes credit for any good news, spins bad news as good news, or blames the previous president for bad news that can’t be denied. The president has absolutely zero impact on the economy or stock market over the short term. It’s like taking credit for the sun rising in the east each morning.

The Big Lie method works wonders when you have a willfully ignorant, mathematically challenged, easily manipulated populace. I spent the entire Obama presidency obliterating the fake economic data perpetuated by his BLS, BEA and every other government agency trying to paint a rosy economic picture. I voted for Trump because the thought of Crooked Hillary as the president made me ill. Despite disagreeing with many of his economic, budgetary, and military policies during his first year in office, I’d vote for him again over Hillary in an instant. The thought of having that evil shrew running the country gives me chills.

Continue reading “GOLDILOCKS IS DEAD”

3 Reasons Why the New Dow Record Is No Reason to Celebrate

From Birch Gold Group

Record highs are giving Wall Street an excuse to pop open the champagne, but economists say we should curb our enthusiasm.

On January 25, the Dow Jones Industrial Average broke 20,000 points for the first time in history. Traders are celebrating and financial media is buzzing with speculation that 25,000 could be just around the corner. But history and fundamental research say otherwise.

Here’s why…

1. Stocks are painfully overvalued

As we discussed last week, the price-to-earnings and price-to-sales ratios of U.S. stocks are at their highest since 1999.

Why is that significant? For starters, when stocks reached their valuation ceiling after 1999, the market tumbled for two straight years and shed over $5 trillion. The resulting tech-bubble crash became one of the biggest U.S. market nosedives ever.

Now, it seems we’re approaching that point yet again. Granted, conditions are different today than they were in 1999, but there’s no guarantee this valuation bubble won’t pop just as abruptly as the last.

Continue reading “3 Reasons Why the New Dow Record Is No Reason to Celebrate”

DOW STILL 64% BELOW ITS ALL-TIME HIGH

“Gold is forever. It is beautiful, useful, and never wears out. Small wonder that gold has been prized over all else, in all ages, as a store of value that will survive the travails of life and the ravages of time.” James Blakely


Chart of the Day

For some perspective on the market, today’s chart presents the Dow priced in another global currency — gold. Today’s chart illustrates how it currently takes 16.1 ounces of gold to ‘buy the Dow’ (i.e. the Dow / gold ratio) — well off the 44.8 ounces it took back at its peak in 1999. From the 1990 peak until 2011, the Dow (priced in gold) endured a massive bear market. Since 2011, however, the Dow priced in gold has rallied within the confines of an upward sloping trend channel. More recently, the Dow/gold ratio successfully retested support and then surged in a post-election rally.

RELATED CONTENT

Trump Just Shared These 11 Words of Warning for the USD and Gold

Trump Just Shared These 11 Words of Warning for the USD and Gold


Barack Just Lost It Over Alan Greenspan's Warning for Owning Gold

Barack Just Lost It Over Alan Greenspan’s Warning for Owning Gold


Move Your IRA or 401k to Gold

IRS Tax “Loophole”: Move Your IRA or 401(k) to Gold
Get this No-Cost Info Kit

YOU WON’T HEAR THIS ON CNBC

The establishment and their mainstream media mouthpieces will continue their narrative of economic recovery and ongoing bull market while distracting the public with other false narratives about guns, gays, Russian aggression, and transgender bathrooms, as their puppets at the Federal Reserve continue monetary policies designed to enrich bankers and their establishment cronies.

Do you think Jim Cramer or any of the CNBC whores will put up this graphic today?:

  • Dow – up 1.5% YTD
  • S&P 500 – up 1.4% YTD
  • Gold – up 23.7% YTD
  • Silver – up 28.7% YTD

They also won’t tell you the stock market is exactly where it was in December 2014. That’s right. This raging bull market hasn’t gone anywhere in the last 19 months. This is despite a Federal Reserve keeping interest rates at 0%, Wall Street HFT machines rigging the market, every major corporation in the S&P 500 buying back hundreds of billions of their own stock, and the media cackling about stocks being cheap.

Now for the bad news. The economy is in recession. Corporate profits are plunging. Consumers aren’t spending because they haven’t gotten any real wage increases in the last 30 years. Real inflation for real people is raging at above 5%. Stock valuations are at all-time highs. Bonds are priced to deliver negative real returns. Home prices are ridiculously overvalued. Enjoy this delusional interlude before reality slaps you in the face and kicks you down the cellar stairs.

Gold and silver prices have been suppressed by the Fed and their bank puppeteers and they are still rising. The Fed’s credibility and central banker credibility across the globe has been lost. They have tried every trick in their book. All have failed. They have nothing left as we approach the cliff. But they’ll accelerate anyway.


16 YEARS AND THIS IS ALL I GOT?

You won’t hear these facts on CNBC. They wouldn’t dare discuss anything in inflation adjusted terms. The Dow is up a measly 7.3% over the last 16 years on an inflation adjusted basis. That’s the good news. In reality, we all know the CPI is understated by at least 3% to 5%. So, in reality, the Dow is significantly negative over the last 16 years. Using a true level of inflation would show the Dow not much higher than it was in 1966 at the onset of the welfare/warfare state and before the unlinking of our fiat currency from gold.

If you were a connected insider or friend of the Fed (aka Wall Street bankers) you’ve done quite well since March 2009. But, it seems that once the QE spigot was turned off in October 2014, the Dow has gone nowhere fast. This faux bull market is dying of old age and lack of Fed injected fiat. It’s a long way down to long term support.


Chart of the Day

The Dow is currently trading 4% below its May 19th all-time record high. For some perspective, today’s chart illustrates the inflation-adjusted Dow since 1900 — there are several points of interest. Take for example an unlucky buy-and-hold investor that invested in the Dow right at the dot-com peak of December 1999. A decade and a half later, the inflation-adjusted Dow is up a mere 7.3%. That is not altogether an impressive performance considering that over 16 years have passed. On the other hand, take the investor who bought right at the end of the financial crisis. The inflation-adjusted Dow is up a significant 119% from its financial crisis lows — not bad for a for a seven year investment. More recently, the inflation-adjusted Dow has broken below support of a trend that has existed since the end of the financial crisis induced bear market.


HOW LOW CAN YOU GO?

I’m guessing CNBC isn’t informing their brain dead audience the Dow is now lower than it was in May 2014. Yep, the market hasn’t gone anywhere in the last 19 months. They probably won’t be telling you it has now fallen 10% since its May 2015 high. Jim Cramer and his butt buddies will be telling you it’s the best time to buy. Just like they did nineteen months ago. There will be dynamic rallies in the coming days. They will serve to keep the believers in the market during the collapse. There will be a lot of dead muppets when this is over.


THE WORSE THINGS GET FOR YOU, THE BETTER THEY GET FOR WALL STREET

On October 2 the BLS reported absolutely atrocious employment data, with virtually no job growth other than the phantom jobs added by the fantastically wrong Birth/Death adjustment for all those new businesses springing up around the country. The MSM couldn’t even spin it in a positive manner, as the previous two months of lies were adjusted significantly downward. What a shocker. At the beginning of that day the Dow stood at 16,250 and had been in a downward trend for a couple months as the global economy has been clearly weakening. The immediate rational reaction to the horrible news was a 250 point plunge down to the 16,000 level. But by the end of the day the market had finished up over 200 points, as this terrible news was immediately interpreted as good news for the market, because the Federal Reserve will never ever increase interest rates again.

Over the next three weeks, the economic data has continued to deteriorate, corporate earnings have been crashing, and both Europe and China are experiencing continuing and deepening economic declines. The big swinging dicks on Wall Street have programmed their HFT computers to buy, buy, buy. The worse the data, the bigger the gains. The market has soared by 1,600 points since the low on October 2. A 10% surge based upon lousy economic info, as the economy is either in recession or headed into recession, is irrational, ridiculous, and warped, just like our financial system. This is what happens when crony capitalism takes root like a foul weed and is bankrolled by a central bank that cares only for Wall Street, while throwing Main Street under the bus.

Continue reading “THE WORSE THINGS GET FOR YOU, THE BETTER THEY GET FOR WALL STREET”

DOW VALUED IN GOLD STILL 65% BELOW ITS 1999 PEAK

You won’t hear this on CNBC.

For some perspective on the long-term performance of the stock market, today’s chart presents the Dow priced in another global currency — gold. Today’s chart illustrates how it currently takes 14.7 ounces of gold to ‘buy the Dow’ (i.e. the Dow / gold ratio) — well off the 44.8 ounces it took back at its peak in 1999. From the 1990 peak until 2011, the Dow (priced in gold) endured a massive bear market. Since 2011, gold has struggled while the Dow has continued to rally. All of this has resulted in the Dow (priced in gold) rallying in a well-defined, upward sloping trend channel. Despite this strong rally, however, the Dow (priced in gold) remains well below its 1999 peak and has just broke below support of its four-year upward sloping trend channel.


Chart of the Day


16 YEARS & STILL IN THE RED

Do you think CNBC will be telling you the inflation adjusted Dow is DOWN 1.2% from where it was 16 years ago? Do you think they will be telling you it has broken support and is headed significantly lower? Do you think CNBC or any of the corporate media will tell you the truth?


Chart of the Day

The Dow is currently trading 12% below its May 19th all-time record high. For some perspective, today’s chart illustrates the inflation-adjusted Dow since 1900 — there are several points of interest. Take for example an unlucky buy-and-hold investor that invested in the Dow right at the dot-com peak of December 1999. A decade and a half later, the inflation-adjusted Dow is actually down 1.2%. That is not altogether an impressive performance considering that nearly 16 years have passed. On the other hand, take the investor who bought right at the end of the financial crisis. The inflation-adjusted Dow is up a significant 100% from its financial crisis lows — not bad for a for a six and a half year investment. More recently, the inflation-adjusted Dow has broken below support of a trend that has existed since the end of the financial crisis induced bear market.


DOW IS LOWER THAN IT WAS IN DECEMBER 2013

You listen to the spokes bimbos on Bloomberg, the bubble headed bimbos on Fox, and the brain dead bimbos on CNBC, along with the various talking heads, pundits, shills and shysters every day on the corporate propaganda media. They regurgitate the false economic data distributed by the Orwellian government agencies to convince the the ignorant masses the economy is in recovery mode, jobs are plentiful, housing is booming, and the .1% aren’t really fleecing the muppets. They also blather about an ongoing bull market in stocks despite the FACT the Dow Jones is now lower than it was on December 27, 2013. Do bull markets go 20 months without advancing? Do you think Jim Cramer will mention this FACT today on CNBC?


The Dow

DJFOR-W 8-22-2015

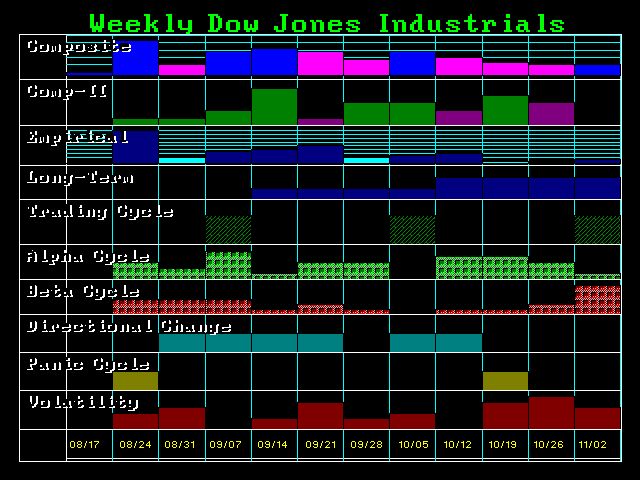
The failure of the Dow to close above 17007 confirms that we are not yet ready to take off to the upside. We needed a closing ABOVE 17007 to firm up the market to state definitively that the August low will hold and new highs are ahead. We needed a minimum closing ABOVE 16632 to firm up short-term support. The closing BELOW 16632 does not provide a Monthly Sell Signal; it is a warning that the Dow remains vulnerable going into September. Only a monthly closing BELOW 15550 would have been a MAJOR SELL SIGNAL that key support has held. Consequently, the close of August was not strong enough to avoid a retest of the lows. Therefore, the Dow did not finish in a position that would imply NEW LOWS ahead just yet and there was no confirmation of a bullish development.

Continue reading “The Dow”

Why This Week’s Low is So Important

DJ2002-2015-TR-M

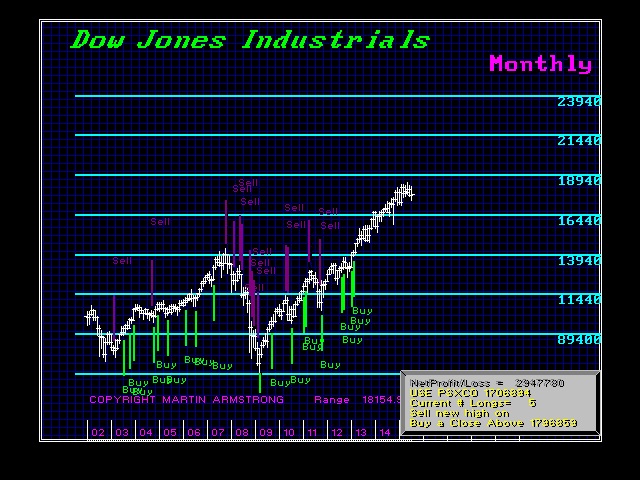
The Dow fell as far as it could possibly do without reversing the trend on a long-term basis even technically. The low this week has been 15370.33. This has flirted with our Third Monthly Bearish Reversal at 15550, but we have also a simple technical point of great importance – 15284. That happens to be last year’s low. Penetrating that number would open the door to a slide into March of 2016.

Consequently, penetrating this week’s low will be INCREDIBLY significant for it would set the stage for 2016 being an OUTSIDE REVERSAL TO THE UPSIDE and that would be just about the worse type of PANIC you could possibly create. WHY? Because this would imply a total meltdown in government and the rush of assets from government paper to private assets would be like a building on fire with all the doors locked except one.

Continue reading “Why This Week’s Low is So Important”

The Markets From Asia & the Prospects for the Dow

SHNGHI-D 8-26-2015

Asian shares are still struggling on Wednesday as it begins to dawn on investors that the Chinese economy really is slowing. The implication for that is more deflation in commodities as they have accounted for nearly 50% of the purchases of commodities these past few years. As with respect to world total GDP. China has also accounted for nearly 50% of all growth making up for the dismal growth in Europe.

Investors are starting to fear that even fresh rate cuts in China will not be enough to stabilize its slowing economy and thus, stem the tide of the collapse in Chinese share prices. As we stated, the charts are different in Shanghai index warning that new lows are clearly on the horizon.

Continue reading “The Markets From Asia & the Prospects for the Dow”