

Click to visit the TBP Store for Great TBP Merchandise


“Once you strip out the effects of the debt binge, the artificial stimulus via currency depreciation, and the fabled ‘wealth effect’ from the equity market runup, real GDP growth stripped-down to its core was the grand total of 0.7% last year. Potemkin would be proud.” – David Rosenberg

It appears every president finds the religion of false economic narrative once they ascend to power. Trump never stops babbling and tweeting about the fantastic economy and raging jobs market since his election. He has embraced the stock market bubble as proof of his brilliant leadership, rather than the tens of trillions in debt propping up the most overvalued market in world history. Every president takes credit for any good news, spins bad news as good news, or blames the previous president for bad news that can’t be denied. The president has absolutely zero impact on the economy or stock market over the short term. It’s like taking credit for the sun rising in the east each morning.
The Big Lie method works wonders when you have a willfully ignorant, mathematically challenged, easily manipulated populace. I spent the entire Obama presidency obliterating the fake economic data perpetuated by his BLS, BEA and every other government agency trying to paint a rosy economic picture. I voted for Trump because the thought of Crooked Hillary as the president made me ill. Despite disagreeing with many of his economic, budgetary, and military policies during his first year in office, I’d vote for him again over Hillary in an instant. The thought of having that evil shrew running the country gives me chills.
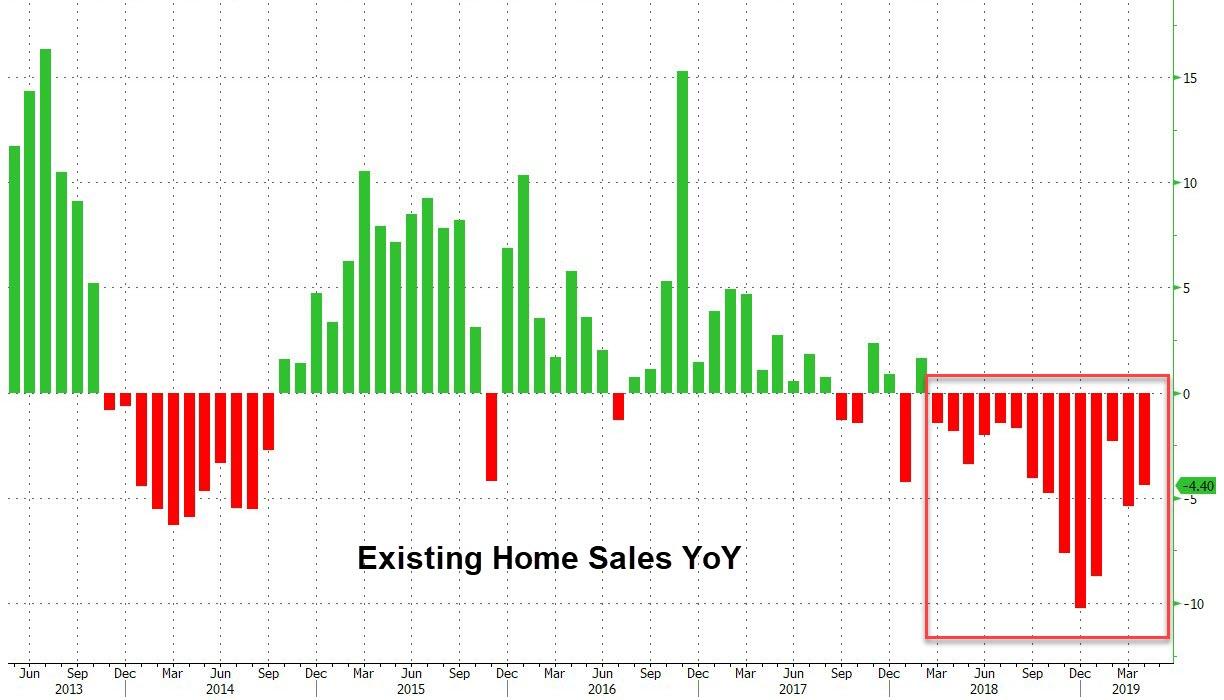
It seems the NAR goes to the BLS school of reporting fake numbers. Sales didn’t really plunge by 6.5% in September, once you adjust them in your excel spreadsheet. They soared!!!
Same shit, different day.
So it goes.

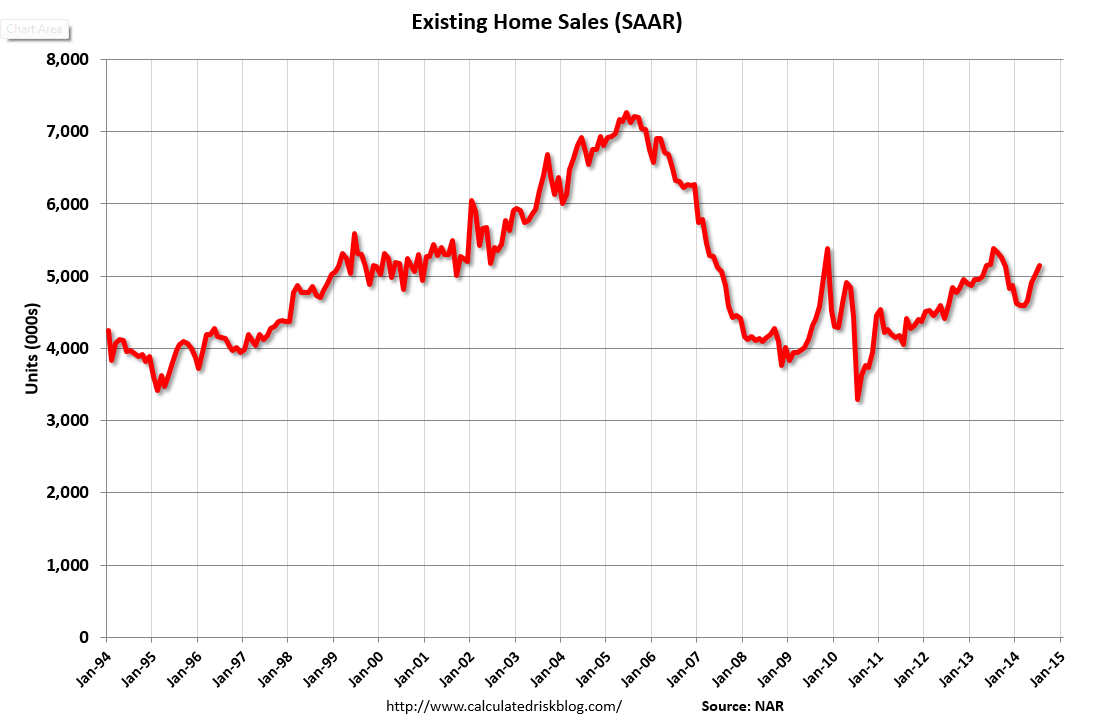
The MSM is ecstatic about May’s “tremendous” surge in existing home sales to a 5.35 million annual rate. The recovery has arrived. All is well. Those Obama waiter jobs at Ruby Tuesday are leading to a dramatic housing recovery. Please note a few things on the chart below. There was a spike in 2013 to this level and then it petered out. There was a spike to this level in 2009 when the Obamanistas were offering the first time home buyer credit to dupes, and then sales predictably crashed.

So annual sales are now where they were in 2007, after a 25% crash from the 2005 high. Annual sales are back to the 1999 through 2001 range, before Greenspan created the biggest housing bubble in history. After six years of 0% interest rates, foreclosure suppression, Wall Street hedge funds doing much of the buying, and Chinese billionaires buying everything they can get their hands on, this is all we have? I noticed the percentage of first time buyers went up to 32% from 27% last year, while the percentage of investors dropped to a four year low. You can thank the government, as Fannie, Freddie, and the FHA are now pushing 3.5% down payment mortgages to the poor ignorant masses. The smart money (Wall Street) is exiting and the dumb money (average schmucks) is being lured into the market by low down payments and delusions of future price increases.
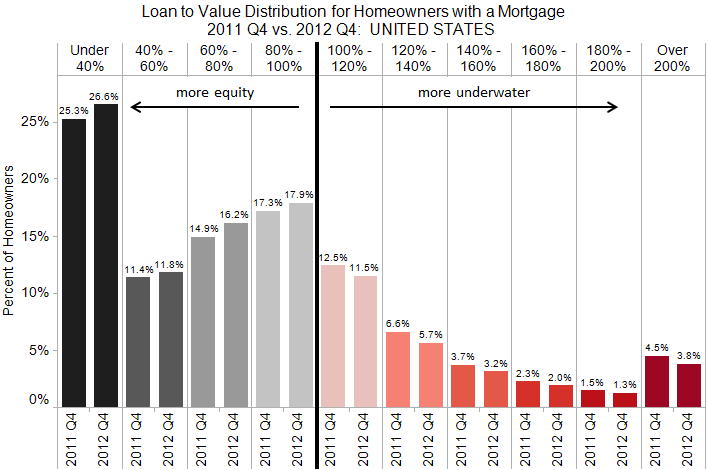
With mortgage rates already rising above 4%, artificial demand from investors in reverse, a stock market crash in the not so distant future, prices out of reach for most people, and stagnant real household incomes, this does not mark the start of a housing recovery. It marks the beginning of the end for the latest bubble in real estate. Anyone who bought a low end home in the last year is already underwater, as you can see in the chart below. At least the .1% are still reaping the benefits of ZIRP and QE, as high end homes are booming. Welcome to the Bernanke/Yellen housing recovery.


Submitted by Tyler Durden on 02/23/2015 10:07 -0500
With homebuilder sentiment slipping, blamed on the weather (despite improvement in the Northeast), Architecture billings down, and lumber prices down, it should not be totally surprising that existing home sales collapsed in January, which they just did tumbling -4.9% against expectations of -1.8% to a worse than expected 4.82 million SAAR (4.95 expected). This was the biggest January drop since 2010, and is the lowest existing home sales since April.
Oh – and before the talking heads blame the weather – the biggest drop in home sales was in The West (with its warm, dry, sunny home-buying climate). Considering that existing home sales most recent peak in 2014 failed to take out the previous government-sponsored peak in 2013 and remains 30% or more below the 2005 peak, and claims that the housing recovery is in tact are greatly exaggerated.
Lower highs and the weakest sales since April 2014

Last year it was the “weather’s” fault, when California led the decline. Guess what: in January 2015, California, aka the “West” again saw the biggest drop:

Continue reading “Existing Home Sales Plunge (and Don’t Blame The Weather)”
The 30 Year U.S. Treasury bond yield hit 2.35% yesterday. That is the lowest rate in U.S. history for the 30 Year Treasury. During the deepest darkest depths of the recession in March 2009, after the stock market had fallen over 50%, the yield was 3.5%. One year ago it was yielding 4.0%. Long term interest rates are not controlled by Yellen. They reflect the economic prospects of the country. When they are rising it means the economy is doing well. When they are plummeting to all time lows, the economy is either in recession or headed into recession. Take your pick. No amount of government data manipulation, feel good propaganda spewed by the captured mainstream media, or Ivy League educated Wall Street economist doublespeak, can change the fact this economy is in the dumper and headed much lower. The Greater Depression is resuming its downward march toward inevitable war.

KB Home had revenues of $2.4 billion in 2014. They are one of the largest home builders in the country. It’s stock has dropped 30% in the last few days. It’s down 40% from its February 2014 high. It’s down 85% from its 2005 high. It had $9 billion of revenues and delivered 60,000 homes in 2005. Then Pin 1.0 popped the first bubble. Revenues collapsed to $1.3 billion and they lost hundreds of millions from 2007 through 2012.
Lennar had revenues of $7.0 billion in 2014. They are the largest home builder in the country. It’s stock has dropped 9% this week. It had been trading at a seven year high, but is still trading 33% below its 2005 bubble high. It had $14 billion of revenues and delivered 42,000 homes in 2005. Then Pin 1.0 popped their bubble. Revenues imploded to $3 billion and they also lost hundreds of millions from 2007 through 2012.
Their admissions earlier this week are proof Bubble 2.0 has met Pin 2.0. KB Home’s 85% increase in revenue and Lennar’s 130% increase in revenue since 2011 have been nothing but a Federal Reserve/Wall Street/U.S. Treasury engineered scheme to repair the balance sheets of the insolvent Too Big To Trust Wall Street banks. The financial industry oligarchs and their servile lackey puppet politicians decided an easy money, Wall Street created scheme to boost home prices would benefit the .1% and restore some of their fraudulently acquired wealth. It isn’t a coincidence home prices rose in parallel with the Fed’s QE programs. And it isn’t a coincidence the bubble is rapidly deflating now that QE3 is over.
The fraudulent nature of the supposed housing recovery can be deciphered by analyzing a few pertinent data points. 30 year mortgage rates were in the 5% to 6% range during the first bubble. Mortgage rates have been consistently below 4% for the last three years. In a healthy market driven economy, these low rates should have brought in first time home buyers and led to a sustainable long-term recovery.

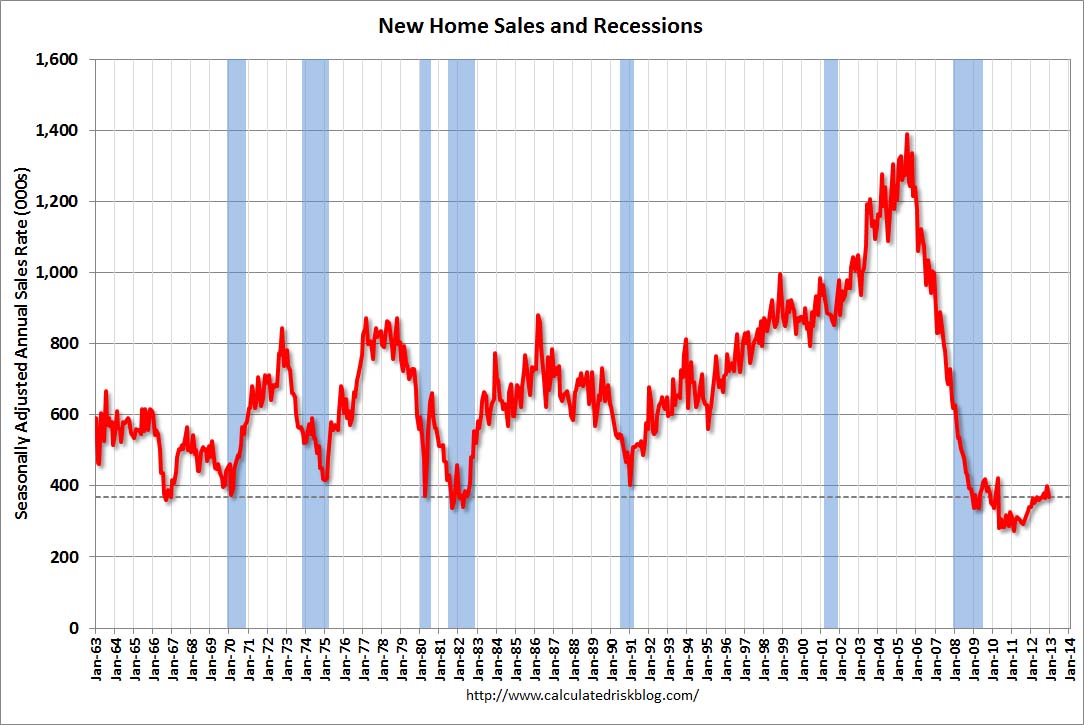
Instead, the number of homes bought by first time buyers has languished at record low levels. The majority of homes sold in 2011 and 2012 were distressed foreclosures and short sales, and the vast majority of sales in the last two years have been to Federal Reserve financed Wall Street investors, Chinese billionaires and fast buck flippers. New home sales of just above 400,000 five years into an economic recovery are at previous recession lows, despite record low mortgage rates. They languish 65% below 2005 levels, when KB Home and Lennar were minting money. Existing home sales of 5 million are back at 1999 levels and 30% below the 2005 highs. This pitiful result is after $3.5 trillion of QE, extremely low mortgage rates, and tremendous hype from the NAR and the corporate MSM (It’s always the best time to buy).

The falsity of the housing recovery storyline can be seen in the fact that mortgage applications linger at 1995 levels, even though mortgage rates are 400 basis points lower than they were in 1995. A critical thinking individual might ask how home prices could rise by 20% since 2012 even though mortgage purchase applications are 20% lower than they were in 2012 and 65% below 2005 levels. The answer is they couldn’t have risen by 20% without massive monetary manipulation and insider deals between Wall Street banks, Wall Street hedge funds, FNMA, Freddie Mac, The Fed, and the U.S. Treasury.

You see, average Americans buy houses not as an investment, but as a place to live. They save enough for a down payment by spending less than they earn, and then make monthly payments for 30 years from their rising household income. Of course, that was the old days. Real median household income is exactly where it was in 1995. It is currently below the level of 1989. Average Americans have made no headway in 20 years. The median price of a home in 1995, according to the Census Bureau, was $128,000. The median price of a home today is $281,000. When prices go up 120% and your real income remains stagnant, even record low mortgage rates is just pushing on a string. With real wages continuing to fall, young people saddled with a trillion dollars of student loan debt, the full impact of the Obamacare neutron bomb (kills small business, doctors and jobs, but not insurance conglomerates or government bureaucracy) just detonating, and an economy clearly going into the tank, there is absolutely no possibility of a real housing recovery in the foreseeable future.

The Too Big To Trust banks have consistently accounted for 35% to 55% of all mortgage originations in the U.S. over the last four years. Wells Fargo is the undisputed leader. All of these banks have reported dreadful financial results this week, with plunging revenues and profits, even with accounting shenanigans like relieving loan loss reserves and marking their balance sheets to fantasy rather than true market values. In the midst of a supposed housing recovery, with mortgage rates at historic lows, the largest mortgage originator in the world, saw their mortgage originations FALL by 12% over last year. They are down 65% from two years ago. JP Morgan and Citigroup also saw their mortgage businesses contracting. These banks have been firing thousands of people in their mortgage divisions. This is surely a sign of a healthy growing housing market. Right?

Essentially, the entire housing recovery storyline has revolved around the Federal Reserve providing free money to Wall Street banks, who then withheld foreclosures from the market, sold them in bulk at inflated prices to Wall Street hedge funds like Blackstone, who then created a nationwide rental business, driving prices higher. FNMA and Freddie Mac did their part by selling their bulk foreclosures to the same connected hedge funds. The average person had no opportunity to bid on foreclosed homes and reap the benefits of lower prices. Blackstone has since created a new derivative, by packaging their rental income streams into an “investment” to sell to muppets. Their rental properties are concentrated in the previous bubble markets of Arizona, California, Florida, and Nevada. What a beautiful business concept. Free money from their Federal Reserve sugar daddy, kicking people out of their homes and then renting their houses back to them, driving prices higher by restricting supply and stopping new household formations, double dipping by creating a new exotic subprime investment opportunity, and then exiting stage left before it all blows sky high again.
Yes, the housing recovery storyline keeps being pushed back month after month. Existing home sales plunged by 6.1% in one month. Existing home sales are 8% LOWER than they were in July of 2013. Does that happen in a recovery? Sales of existing homes were up 2% over last year, but the distribution of sales tells the real story. Homes selling for less than $100k crashed by 16%. Homes selling between $100k and $250k fell by 1%. These two categories account for 61% of all home sales.
The NAR touts the fact that home prices were 5% higher than last year. What they did not tell you is that home prices have fallen for the 5th month in a row and are now 7.5% LOWER than they were in June. Is that a sign of a housing recovery?
Good old Larry Yun, the latest NAR shill who will write a book after he leaves about how it was his job to lie, assures us this is just a one month aberration caused by the stock market going down for a few days in October. Everyone knows that you make a home purchase decision based upon the day to day fluctuations in the stock market. So this douchebag blames the plunge in home sales on the stock market. Let’s test his hypothesis.
Dow on Oct 1 – 16,801
Dow on Oct 31 – 17,390
Dow on Dec 1 – 17,776
So the Dow was up about 1,000 points in October and November and this pitiful excuse for a human being blames the housing plunge on the stock market?
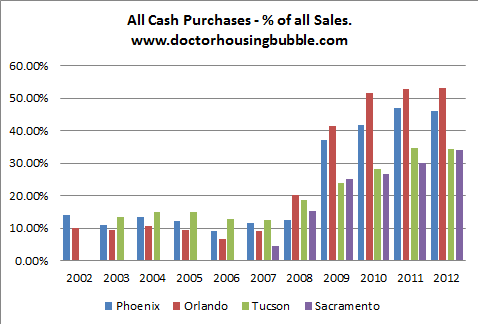
Here is the facts jack. Blackrock and the rest of the Wall shysters see the writing on the wall. Their master plan to drive prices higher with free money from the Fed worked to perfection. The investors and flippers are exiting stage left. At one point cash sales reached 36% of all transactions. It has plunged to 25% of all transactions as Wall Street sells before the flippers and average people left holding the bag. It’s no coincidence prices are falling. The fake housing recovery is over. Sales and prices will continue to fall.
Real people have lower real wages than they did at the depths of the recess ion in 2009. Fannie and Freddie are attempting to use your tax dollars to create another subprime mortgage bubble, but it’s too late. The recession is under way and housing is headed back into the toilet. I wonder what Larry Yun will do when he resigns from the NAR in disgrace like David Lereah?
Submitted by Tyler Durden on 12/22/2014 10:08 -0500
Having exuberantly reached its highest level since September 2013 last month (despite the total collapse in mortgage applications), it appears the ugly reality of the housing market has peeked its head out once again. As prices rose, existing home sales plunged 6.1% – the most since July 2010 (against an expected 1.1% drop) to 4.93mm SAAR (the lowest in 6 months).


So what was it this time: the polar vortex, the crude collapse, the crude vortex? Neither: According to the NAR’s endlessly amusing Larry Yun, this time it was the stock market:
“The stock market swings in October may have impacted some consumers’ psyche and therefore led to fewer November closings. Furthermore, rising home values are causing more investors to retreat from the market.”
Supposedly he is referring to the tumble, not the resulting Bullard “QE4” mega-explosion in stocks that pushed everyhting to new all time highs.
In other words, according to the NAR, even the tiniest downtick in stocks, and the housing market gets it.
Sure enough, it is time to boost confidence in a rigged, manipulated ponzi scheme:
Unless, of course, stocks drop again, in which case all bets are off.
Meanwhile, it appears investors have left the building…

Every part of America saw a collapse:
November existing-home sales in the Northeast declined 4.2 percent to an annual rate of 680,000, but are still 4.6 percent above a year ago. The median price in the Northeast was $246,100, which is 1.3 percent above a year ago.
In the Midwest, existing-home sales fell 8.9 percent to an annual level of 1.13 million in November, and are now 1.7 percent below November 2013. The median price in the Midwest was $160,500, up 7.0 percent from a year ago.
Existing-home sales in the South decreased 3.2 percent to an annual rate of 2.09 million in November, but remain 5.0 percent above November 2013. The median price in the South was $176,500, up 5.2 percent from a year ago.
Existing-home sales in the West dropped 9.6 percent to an annual rate of 1.03 million in November, and remain 1.0 percent below a year ago. The median price in the West was $292,700, which is 3.5 percent above November 2013.
Some more amusing details from the report:
The median existing-home price2 for all housing types in November was $205,300, which is 5.0 percent above November 2013. This marks the 33rd consecutive month of year-over-year price gains.
Total housing inventory3 at the end of November fell 6.7 percent to 2.09 million existing homes available for sale, which represents a 5.1-month supply at the current sales pace – unchanged from last month. Despite the tightening in supply, unsold inventory remains 2.0 percent higher than a year ago, when there were 2.05 million existing homes available for sale.
“Lagging homebuilding activity continues to hamstring overall housing supply and is still too low in relation to this year’s promising job growth,” says Yun. “Much faster price and rent appreciation – easily exceeding wage growth – will occur next year unless new construction picks up measurably.”
All-cash sales were 25 percent of transactions in November, down from 27 percent in October and 32 percent in November of last year.
Individual investors, who account for many cash sales, purchased 15 percent of homes in November, unchanged from last month and below November 2013 (19 percent). Sixty-one percent of investors paid cash in November.
The percent share of first-time buyers in November climbed to 31 percent, up from October (29 percent) and is the highest share since October 2012 (also 31 percent). First-time buyers have represented an average of 29 percent of buyers through November of this year.
Distressed sales – foreclosures and short sales – were unchanged in November from October (9 percent) and remained in the single digits for the fourth month this year; they were 14 percent a year ago. Six percent of November sales were foreclosures and 3 percent were short sales. Foreclosures sold for an average discount of 17 percent below market value in November (15 percent in October), while short sales were discounted 13 percent (10 percent in October).
Properties typically stayed on the market in November longer (65 days) than last month (63 days) and a year ago (56 days). Short sales were on the market the longest at a median of 116 days in November, while foreclosures sold in 65 days and non-distressed homes took 63 days. Thirty-two percent of homes sold in November were on the market for less than a month.
But don’t worry about all that: the NAR couldn’t be happier that just like in the last housing bubble, so too now Fannie and Freddie’s new 3% down payment initiative, means the bubble is about to get bigger than ever:
NAR President Chris Polychron, executive broker with 1st Choice Realty in Hot Springs, Ark., says Fannie Mae and Freddie Mac’s new low downpayment program should improve access to credit for responsible buyers. “NAR applauds Fannie and Freddie’s commitment to homeownership by serving creditworthy borrowers who lack the resources for substantial downpayments plus closing costs with its new downpayment program,” he said. “The new program mitigates risk with strong underwriting and ensures that responsible buyers have access to safe and affordable mortgage credit. Furthermore, NAR believes lenders must do their part to ensure loans are prudently underwritten and are made available to qualified borrowers.”
And since the taxpayers will be left to bail out the excesses of this latest incipient housing bubble, what’s not to like?
But the punchline: the median price of existing homes dropped to $205,300…

… because, well, there is a “lack of supply.”
Nov existing home sales fell 6.1% to 4.93M-the lowest level since last May (4.91M). Lack of supply continues to weigh on the #housing market
yep – that must be it…

In classic MSM fashion, the headlines about existing home sales crow that they are the highest in a year. The truth is they are 1.7% LOWER than last September. But at least inventory for sale is 6% HIGHER than last September. Lower sales and higher inventory always do wonders for prices. Right?
First time home buyers as a percentage of buyers remains at historic lows of 29%. This number should be 40%. The Chinese and the flipper morons continue to drive cash purchases at 30% of all sales. Mortgage applications remain at two decade lows despite mortgage rates below 4%.
Yeah – this is a wonderful report. Buy stocks.
Existing home sales in September rose 2.4% to get back to 2001 levels. Year over year change in existing home sales were down 1.70%.

If it wasn’t for 30% cash sales, the existing home sales numbers would be dreadful.

The growth was mostly in the West and South.
We can thank The Federal Reserve’s quantitative easing programs (particularly QE3) for juicing existing home sales in the face of lower/stagnant real income and “Death Valley” mortgage purchase applications.

The Fed Futures data is pointing to a Carnival Cruise trip with The Fed Funds rate likely to rise in the near future. Or at least more likely than it has been in the past year.

Here is The March of The Federal Reserve as it distorts prices and incentives.

Existing home sales fell in August because Blackrock and the rest of the Wall Street hedgies stopped buying them with your tax dollars, provided interest free by the Federal Reserve. Anyone lured into buying a house in the last two years is about to get a rude awakening. They are now underwater on their mortgage. But, the true constituents of the Federal Reserve are still partying. The .1% are still winning. FOR NOW.


I’ve told myself to not even look at the highly manipulated statistical drivel put out by the government, corrupt organizations, and regurgitated and spun in a positive manner by the captured corporate media. Just when I thought I was out, they pull me back in.
I see Marketwatch with this blaring headline:
They are breathlessly describing how this was better than expected, as if it proves we are in a housing recovery. Existing home sales always rise in July versus June because people need to move before school starts. This is a meaningless data point. The important data point is how it compares with the prior July. That is buried deep in the NAR press release.
Surprise, Surprise. Existing home sales FELL by 4.3% versus July of last year. That means the housing market is in decline.
Of course the scumbags at the NAR touted the 4.9% price increase over last July. They use annual data when it suits them.
What they did not report is that home prices FELL between June and July from $223,300 to $222,900. They have been falling for months. Housing inventory grew by 3.5% over June and by 5.8% over last July. So you have declining sales and rising inventory on a year over year basis. That sure sounds like a recovery to me.
Investors still account for 29% of all sales, but that percentage is declining. The hedge funds are exiting and the flippers are panicking. Wait until prices fall another 5%. The rush for the exits will be on. First time buyers are still near historic long-term lows and will remain there for years.
Yes the MSM and the NAR are actually cheering for negative year over year sales results that put existing home sales at 1999 levels. Yippee. Let’s buy the all-time fucking high in the stock market.
Look at that amazing housing recovery. The usual housing propaganda being spewed this morning by the NAR and the MSM. Existing homes sales are all the way back to October levels, even though this is prime home sales season. The MSM buries the FACT that existing home sales are 2.3% LOWER than last June. The monthly change is meaningless. Home sales always are higher in the summer because families move while kids are out of school.
Let’s get real. Existing home sales are currently at 1999 levels when the working age population in this country numbered 208 million. Today the working age population numbers 248 million. We’ve got 40 million, or 19% more adults int he country, and existing home sales are exactly the same. They are still 30% below 2005 levels and destined to languish and decline over the coming years. Inventory rose 6.5% over last year. So sales are falling and inventory is rising. I wonder what that will do to prices?

You get nothing but feel good optimistic drivel from the faux journalists in the MSM. Their job is to keep you in the dark. Some facts from the NAR report:
The entire housing recovery storyline has been a scam and a fraud. Now sales are falling and prices will follow. Look out below.
WASHINGTON (MarketWatch) — Rising for a third month, sales of existing homes grew 2.6% in June to a seasonally adjusted annual rate of 5.04 million, reaching the highest level since October, the National Association of Realtors reported Tuesday. Economists polled by MarketWatch had expected the sales rate to increase to 5 million in June from an originally reported 4.89 million in May, driven by a strengthening labor market, more homes on the market, and cooling price growth. On Tuesday NAR revised May’s sales rate to 4.91 million. Market conditions are becoming more balanced, but anecdotes still point to a shortage of homes on the market, said Lawrence Yun, NAR’s chief economist. The median sales price of used homes hit $223,300 in June, up 4.3% from the year-earlier period. June’s inventory was 2.3 million existing homes for sale, a 5.5-month supply at the current sales pace. The number of homes available for sale was up 6.5% from the year-earlier period. Including June’s increase, the pace of sales was down 2.3% from a year earlier.
The National Association of Liars (Realtors) reported existing home sales this morning and they continue to blather about weather and a glorious future. Meanwhile, existing home sales have plunged by 7.5% in the last year and are now at a 21 month low. Does this chart show the housing recovery you hear so much about on the MSM? Existing home sales are at the same level they were in 1998, before the Federal Reserve induced bubble years from 1999 through 2006. A critical thinking individual might wonder how home prices have soared by double digits over the last two years as existing home sales have made no headway.

Home prices have soared by 7.9% in the last year, as sales have plunged. That makes sense. Right?
First time home buyers accounted for 30% of the sales, near a record low, and the same level as one year ago. In a healthy growing housing market they would make up 40% to 50% of buyers.
The irrational surge in home prices can be seen in the data supplied by the NAR. Here is the recipe:
The entire housing recovery has been a financially engineered fraud. Blackrock and the other hedgies have made a killing and their Ivy league MBA created models are telling them to exit stage left. The propaganda spewing media and the lying realtors like Larry Yun will continue to mislead the muppets as the big swinging Wall Street dicks move onto their next scam. Home sales will continue downward, with prices not far behind.

“The continuing shortages of housing inventory are driving the price gains. There is no evidence of bubbles popping.” – David Lereah, NAR mouthpiece/economist – August 2005
“The steady improvement in home sales will support price appreciation despite all the wild projections by academics, Wall Street analysts, and others in the media.” – David Lereah, NAR mouthpiece/economist – January 10, 2007
“Buyer traffic is continuing to pick up, while seller traffic is holding steady. In fact, buyer traffic is 40 percent above a year ago, so there is plenty of demand but insufficient inventory to improve sales more strongly. We’ve transitioned into a seller’s market in much of the country. We expect a seasonal rise of inventory this spring, but it may be insufficient to avoid more frequent incidences of multiple bidding and faster-than-normal price growth.” – Lawrence Yun – NAR mouthpiece/economist – February 21, 2013
I really need to stop being so pessimistic. I’m getting richer by the day. My home value is rising at a rate of 1% per month according to the National Association of Realtors. At that rate, my house will be worth $1 million in less than 10 years. My underwater condo (figuratively – not literally) in Wildwood will resurface and make me rich beyond my wildest dreams. Larry Yun, the brilliant economic genius employed by the upstanding and truth telling NAR, reported that median home prices soared by 12.3% in January (down 3.7% from December) over the prior year and there is virtually no inventory left to sell – with a mere 1.75 million homes in inventory – the lowest level since 1999. The median sales price of $173,600 is up “dramatically” from last year’s $154,500 level. I’m sure the NAR meant to mention that home prices are still down 25% from the 2005 high of $230,000. Every mainstream media newspaper, magazine, and news channel is telling me the “strong” housing recovery is propelling the economy and creating millions of new jobs. Keynesian economists, Wall Street bankers, government apparatchiks and housing trade organizations are all in agreement that the wealth effect from rising home prices will be the jumpstart our economy needs to get back to the glory days of 2005. Who am I to argue with such honorable men with degrees from Ivy League schools and a track record of unquestioned accuracy as we can see in the chart below?

Mr. Lereah added to his sterling reputation with his insightful prescient book Why the Real Estate Boom Will Not Bust—And How You Can Profit from It, which was published in February 2006. I understand Ben Bernanke has a signed copy on his nightstand. According to David, he voluntarily decided to leave the NAR in mid-2007 as home prices began their 40% plunge over the next four years. He then admitted in an interview with Money Magazine in 2009 that he was nothing but a shill for the real estate industry, no different than a whore doing tricks for $20. Except he was whoring himself for millions of dollars and contributing to the biggest financial fraud in world history:
“I was pressured by executives to issue optimistic forecasts — then was left to shoulder the blame when things went sour. I was there for seven years doing everything they wanted me to. I worked for an association promoting housing, and it was my job to represent their interests. If you look at my actual forecasts, the numbers were right in line with most forecasts. The difference was that I put a positive spin on it. It was easy to do during boom times, harder when times weren’t good. I never thought the whole national real estate market would burst.”
After Mr. Lereah slithered away from his post he was replaced by the next snake – Lawrence Yun. He proceeded to put the best face possible on the greatest housing collapse in recorded history, assuring the public it was the best time to buy during the entire slide. Five million foreclosures later he’s still telling us it’s the best time to buy. Why shouldn’t we believe the National Association of Realtors and the mainstream media that report their propaganda as indisputable fact? These noble realtooors only have the best interests of their clients at heart. Remember when they warned people about the dangers of liar loans, negative amortization loans, appraisal fraud, nefarious mortgage brokers, criminal bankers, corrupt ratings agencies and the fact that home prices had reached a high two standard deviations above the normal trend? Oh yeah. They didn’t make a peep. They disputed and ridiculed Robert Shiller and anyone else who dared question the healthy “strong” housing market storyline. In late 2011 this superb, above board, truth telling organization admitted what many financial analysts and “crazy” bloggers had been pointing out for years. They were lying about home sales. Their data was false. Between 2007 and 2010, the NAR reported 2.95 million more home sales than had actually occurred. This was not a rounding error. This was not a flaw in their methodology, as they claimed. It was an outright fraudulent attempt to convince the public that the housing market was not in free fall. These guys make the BLS look accurate and above board.

We are now expected to believe their monthly reports as if they are gospel. The mainstream media continues to report their drivel about the lowest inventory level in 14 years without the slightest hint of skepticism.
We are told by good old Larry Yun that there are only 1.74 million homes left for sale in this country and at current sales rates we’ll run out of inventory in 4.2 months. Oh the horror. You better buy now, before it’s too late. We must be running out of houses. Someone call Bob Toll. We need more houses built ASAP, before this becomes a crisis. But there seems to be problem with this storyline. Existing home sales are falling. Even using the NAR seasonally manipulated numbers, sales in January were lower than in November. In a country with 133 million housing units, there were 291,000 existing home sales in January. If there is an inventory shortage, why have new home sales fallen every month since May of 2012? There were a total of 10,000 completed new homes sold in December in the entire country. Housing starts plunged by 8.5% in January. Does this happen when you have a strong housing market? Do you believe the NAR inventory figure of 1.74 million homes for sale? The last time the months of supply was this low was early 2005 – during the good old days.

Let’s examine a few facts to determine the true nature of this shocking inventory shortage. According to the U.S. Census Bureau:
So, with 9.8 million vacant housing units in the country and 1.6 million of these identified as for sale, the NAR and media mouthpieces have the balls to report only 1.74 million homes for sale in the entire U.S. This doesn’t even take into account the massive shadow inventory stuck in the foreclosure pipeline. Of the 75 million owner-occupied housing units in the country, 50 million have a mortgage. Of these houses, a full 10.9% are either delinquent or in the foreclosure process. This totals 5.4 million households, with 1.9 million of these households already in the foreclosure process. The number of distressed households is still double the long-term average, even with historically low mortgage rates, multiple government mortgage relief programs (HARP), and Fannie, Freddie and the FHA guaranteeing 90% of all mortgages. Do you think the NAR is including any of these 5.4 million distressed houses in their inventory numbers?

Then we have the little matter of a few home occupiers still underwater on their mortgages. After this fabulous two year housing recovery touted by shills and shysters, only 27.5% of ALL mortgage holders are underwater on their mortgage. This means 13.8 million households are in a negative equity position. Those with 5% or less equity are effectively underwater since closing costs usually exceed 6% of the house’s value. That adds another 2.2 million households to the negative equity bucket. Do you think any of these 16 million households would be selling if they could?
The negative equity position of millions of homeowners gets at the gist of the effort to re-inflate the housing bubble. By artificially pumping up home prices, the Wall Street titans and their co-conspirators at the Federal Reserve and Treasury Department are attempting to repair insolvent Wall Street bank balance sheets, lure unsuspecting dupes back into the housing market, reignite the economy through the old stand-by wealth effect, and of course enrich themselves and their crony capitalist friends. The artificial suppression of home inventory has been working wonders, as 2 million homeowners were freed from negative equity in 2012. If they can only lure enough suckers back into the pool, all will be well. Phoenix must have an inordinate number of chumps with home prices rising by 22.5% in 2012 as investors and flippers poured into the market with cheap debt and big dreams. Of course everything is relative, as prices are still down 44% from the peak and 40% of mortgages remain underwater. I strongly urge everyone without a functioning brain to pour their life savings into the Phoenix housing market. Larry Yun says it’s a can’t miss path to riches.
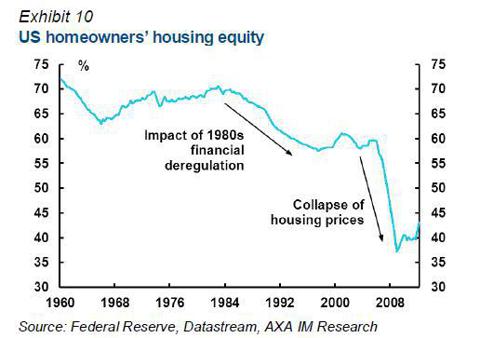
Despite the propaganda, hyperbole, and cheerleading from the corporate media, the fact remains that national homeowner’s equity is barely above its all-time low of 38%, down from 62% in 2000 and 70% in 1980. The NAR shills, Federal Reserve drug pushers, Wall Street shysters, and pliant media lured the middle class into the false belief that housing was an asset class that could make you rich. Homes became the major portion of middle class net worth. As prices were driven higher from 2000 through 2006, the middle class took the bait hook line and sinker and borrowed billions against their ever increasing faux housing wealth. This set up the impending collapse of middle class net worth, created by the 1%ers on Wall Street, in Washington DC, and in corporate executive suites across the land. The median American household lost 47% of its wealth between 2007 and 2010. Average household wealth, which is skewed dramatically by the richest Americans, declined by only 18%. Real estate only accounts for 30% of the net worth of the rich. For the middle 60%, housing has risen from 62% to 67% of total wealth since 1983. Middle class families’ saw their cash cushion fall from 21% in 1983 to 8% before the crash. They were convinced that living on Wall Street peddled debt was the path to prosperity. After the crash, the middle class has been left with no cash, underwater mortgages, declining real wages, less jobs, and a mountain of credit card debt. Delusions have been crushed. But an on-line degree from the University of Phoenix funded by a Federal student loan of $20,000 will surely revive the fortunes of the average unemployed middle class worker.
Despite the destruction of middle class hopes, dreams, and net worth, the ruling plutocracy has decided the best way to revive their fortunes is to lure the ignorant masses into more student loan debt, auto debt and mortgage debt.
“The real hopeless victims of mental illness are to be found among those who appear to be most normal. Many of them are normal because they are so well adjusted to our mode of existence, because their human voice has been silenced so early in their lives that they do not even struggle or suffer or develop symptoms as the neurotic does. They are normal not in what may be called the absolute sense of the word; they are normal only in relation to a profoundly abnormal society. Their perfect adjustment to that abnormal society is a measure of their mental sickness. These millions of abnormally normal people, living without fuss in a society to which, if they were fully human beings, they ought not to be adjusted.” – Aldous Huxley – Brave New World Revisited

What is normal in a profoundly abnormal, manipulated, propaganda driven society? The NAR and Federal government issue their public relations announcements every month and attempt to spin straw into gold. The media then fulfill their assigned role by touting the results as unequivocal proof of an economic recovery. This is all designed to revive the animal spirits of the clueless public. Statistics in the hands of those who have no regard for the truth can be manipulated to portray any storyline that serves their corrupt purposes. When I see a story about the housing market referencing a percentage increase as proof of a recovery I know it’s time to check the charts. You see, even a fractional increase from an all-time low will generate an impressive percentage increase. So let’s go to the charts in search of this blossoming housing recovery.
The media, NAHB, and certain bloggers look at this chart and declare that new home sales are up 20% from 2011 levels. Sounds awesome. I look at this chart and note that 2011 was the lowest number of new home sales in U.S. history. I look at this chart and note that new home sales are 75% below the peak in 2005. I look at this chart and note that new home sales are lower today than at the bottom of every recession over the last fifty years. I look at this chart and note that new home sales are lower today than they were in 1963, when the population of the United States was a mere 189 million, 40% less than today’s population. Do you see any signs of a strong housing recovery in this chart?
The housing cheerleaders look at the chart below and crow about a 75% increase in housing starts. I look at this chart and note that housing starts in 2009 were the lowest in recorded U.S. history. I look at this chart and note that total housing starts are down 60% and single family starts are down 70% from 2006 highs. I look at this chart and note the “surge” in housing starts is completely being driven by apartment construction, because the student loan indebted youth can’t afford to buy houses. I look at this chart and note that housing starts are 40% below 1968 levels. Do you see any signs of a strong housing recovery in this chart?

Those trying to lure the gullible non-thinking masses into paying inflated prices for the “few” houses available for sale declare that existing home sales are up 50% in the last two years. Of course, the 3.3 million low in 2010 was the lowest level in decades. Existing home sales are still 30% below the 2005 high of 7.2 million and the abnormal structure of these home sales is dramatically different than the normal sales of yesteryear.

The wizards behind the curtain don’t want you to understand how the 50% increase in existing home sales has been achieved. They just want you to be convinced that a return to normalcy has happened and it’s the best time to buy. The NAR wizards and the media wizards don’t publicize the composition of these skyrocketing sales. At the end of the NAR “buy a home before it’s too late” monthly press release you find out that distressed homes (foreclosed & short sales) now make up 23% of all home sales and have accounted for well over 30% of all home sales since 2010. Another 28% of home sales are all-cash sales to investors looking to turn them into rental units or flip them for a quick buck. Lastly, 30% of homes are being bought by first time home buyer pansies who have been lured into the market by 3.5% down payment loans through the FHA, with the future losses born by middle class taxpayers who had no say in the matter. Prior to the housing crash, normal buyers who just wanted a place to live, accounted for 90% of all home purchases. Today they make up less than 30% of home buyers. Does this chart portray a normal market or a profoundly abnormal market? Does it portray a healthy housing recovery based upon sound economic fundamentals?
The answer is NO. The contrived elevation of home sales and home prices has been engineered by the very same culprits who crashed our financial system in the first place. This has been planned, coordinated and implemented by a conspiracy of the ruling oligarchy – the Federal Reserve, Wall Street, U.S. Treasury, NAR, and the corporate media conglomerates. Ben’s job was to screw senior citizens and drive interest rates low enough that everyone in the country could refinance, attract investors & flippers into the market, and propel home prices higher. Wall Street has been the linchpin to the whole sordid plan. They were tasked with drastically limiting the foreclosure pipeline, therefore creating a fake shortage of inventory. Next, JP Morgan, Blackrock, Citi, Bank of America, and dozens of other private equity firms have partnered with Fannie Mae and Freddie Mac, using free money provided by Ben Bernanke, to create investment funds to buy up millions of distressed properties and convert them into rental properties, further reducing the inventory of homes for sale and driving prices higher. Only the connected crony capitalists on Wall Street are getting a piece of this action. The Wall Street big hanging dicks have screwed the American middle class coming and going. The NAR and media are tasked with what they do best – spew propaganda, misinform, lie, cheerlead and attempt to create a buying frenzy among the willfully ignorant masses. The chart below reveals the truth about the strong sustainable housing recovery. It doesn’t exist. Mortgage applications by real people who want to live in a home are no higher than they were in 2010 when home sales were 33% lower than today. Mortgage applications are lower than they were in 1997 when 4 million existing homes were sold versus the 5 million pace today. The housing recovery is just another Wall Street scam designed to bilk the American middle class of what remains of their net worth.

The multi-faceted plan to keep this teetering edifice from collapsing is being executed according to the mandates of the financial class:
Free money, government subsidies, no regulation, Wall Street hubris, get rich quick schemes, media propaganda, and an ignorant public – what could possibly go wrong?
Here is what could and will go wrong. Everyone in the country that could refinance to a mortgage rate of 4% or lower has done so. Contrary to Bernanke’s rhetoric that “QE to Infinity” would lower mortgage rates, they have just risen to a six month high as the 10 Year Treasury rose 60 basis points from its 2012 low. If mortgage rates just rose to a modest 5% the housing market would come to a grinding halt as no one would trade a 3.5% mortgage for a 5% mortgage. As I’ve detailed earlier, there are 3.9 vacant housing units available for rent. Almost half of the new housing units under construction are apartments. The Wall Street shysters are converting millions of foreclosed homes into rental units. This avalanche of rental properties will depress rents and destroy the modeled ROI calculations of the brilliant Wall Street Ivy league MBAs. These lemmings will all attempt to exit their “investments” at the same time. The FHA is already broke. The mounting losses from their 3.5% down payment to future deadbeats program will force them to curtail this taxpayer financed debacle. There will be few first time home buyers, as young people saddled with a trillion dollars of student loan debt are incapable of buying a home.
These are the facts. But why trust facts when you can believe Baghdad Ben and the NAR? It’s always the best time to buy.

“All that said, given the fundamental factors in place that should support the demand for housing, we believe the effect of the troubles in the subprime sector on the broader housing market will likely be limited, and we do not expect significant spillovers from the subprime market to the rest of the economy or to the financial system. The vast majority of mortgages, including even subprime mortgages, continue to perform well. Past gains in house prices have left most homeowners with significant amounts of home equity, and growth in jobs and incomes should help keep the financial obligations of most households manageable.” – Ben Bernanke – May 17, 2007
