How “Saving Gas” Costs a Fortune

Guest Post by Eric Peters

If the government’s fuel economy fatwas “save” Americans so much money, how come it’s costing them billions?

FiatChrysler just made the latest payment – $77 million – which was actually a fine for failing to make its cars “save” enough fuel . . . for Uncle’s tastes.

Irrespective of FCA customers’ tastes.

Continue reading “How “Saving Gas” Costs a Fortune”

Less Gas in Your “Gas”

Guest Post by Eric Peters

“Gas” is about to become another 5 percent less so.

President Trump just issued a fuhrerbefehl – a Fuhrer Order, as it was styled back in you-know-where, by you-know-who – directing the EPA to change its befehls (orders) to infuse the nation’s “gas” supply with 15 percent ethanol (E15), year ’round.

Up to now, the limit of ethanol-adulteration – in most places, most of the time – has been 10 percent (E10).

But what’s the problem with ethanol?

Continue reading “Less Gas in Your “Gas””

If Gas is Plentiful and Cheap . . . Make Cars Cost More

Guest Post by Eric Peters

Whenever a problem is solved, the solution never seems to go away – or even get dialed back. If anything, the government – or busybodies who use the government to achieve their never-ending aims – doubles down on the solution.

For instance, cheap gas.

It is driving Certain People batty. They cannot stand it that not everyone is buying a hybrid or – better yet – an electric car. Instead, many are buying SUVs and trucks. Some of these people may not even need them but simply like them.

And because they can afford to drive them, they do.

It’s just horrible.

Continue reading “If Gas is Plentiful and Cheap . . . Make Cars Cost More”

Gas Doesn’t Cost More . . . Our Dollars Are Worth Less

Guest Post by Eric Peters

Did you know that gas is cheaper now than it was 50 years ago?

It may not feel it . . . but:

Find an inflation calculator; for example the federal government’s Bureau of Labor statistics Consumer Price Index calculator (here). Select 1965 as your starting year. Enter 30 cents – the cost of a gallon of gas back then (here). Then select 2016 (2017 data isn’t yet available) and – look at that – $2.29.

About what a gallon of unleaded sells for today.

Actually, it sells for less – because a chunk of that $2.29 you’re spending isn’t for gas.

It’s for taxes.

Continue reading “Gas Doesn’t Cost More . . . Our Dollars Are Worth Less”

Consumer Prices Jump Most In Over 3 Years Amid Rising Gasoline, Rent Inflation

Even the liars at the BLS can’t cover-up the raging inflation in gasoline, natural gas, rent, medical expenses, and food. I thought Janet was waiting for a little inflation before raising rates. I guess she’ll need a new excuse not to raise rates as the CPI is rising at an annualized rate of 4.8% according to the bullshit artists at the BLS. It’s over 10% for people living in the real world.

Tyler Durden's picture


Headline CPI rose 0.4% MoM (above +0.3% exp) for the biggest jump since Feb 2013 but sadly at the same time, price-adjusted hourly wages slid 0.1% in April.


Following a small drop in March, from 8 year highs, Core (ex food and energy) Consumer Prices rose 2.1% YoY (as expected) abesent the effect of Gasoline’s huge 8.1% MoM surge.


Of course this is probably transitory but we note that rent inflation remains at 3.7% YoY – its highest since 2008 and definitively not transitory.

Continue reading “Consumer Prices Jump Most In Over 3 Years Amid Rising Gasoline, Rent Inflation”

ABOUT THOSE “STRONG” RETAIL SALES

I get tired discrediting the MSM narrative of economic recovery, but I feel it’s my duty to set people straight. There were blaring headlines about the much better than expected retail sales in April. I find it humorous watching the government report this drivel and the MSM unquestioningly regurgitating it to the ignorant masses as retailer after retailer reports absolutely atrocious results.

Let’s dissect the bullshit report from the Census Bureau. They said retail sales went up 1.3% in April over March. Unless you delve into the actual report, you don’t know this is a seasonally adjusted number. On an unadjusted basis retail sales fell by 2%. But, for the sake of consistency I’ll use their adjusted numbers.

Total retail sales rose from $447.8 billion in March to $453.4 billion in April, an increase of $5.6 billion. That’s a 1.26% increase. Let’s breakdown our increase.

It seems $2.9 billion of that increase came from auto “sales”. That’s 52% of the total retail sales increase. So, desperate auto manufacturers with inventory piling sky high on their lots are doling out more subprime 7 year loans, 0% down leases, and offering massive rebate incentives to rid themselves of inventory. This is supposed to be some sort of positive development proving the consumer is back?

Remember those low gas prices? It seems the 30% increase in prices has boosted retail spending at gas stations by $700 million in one month and $1.7 billion over the last two months. Gas station sales increases account for another 13% of the monthly increase. So, 65% of the jump in retail sales is accounted for.

Another $550 million was produced at grocery stores, as food prices have jumped 20% since the beginning of the year. Paying more for less food is surely a sign of economic progress. Food is another 10% of the increase.

Lastly, the death of bricks and mortar retailers is further confirmed by the $900 million increase in on-line sales, as department store sales fell again.

In conclusion, the “awesome” increase in retail sales was essentially due to inflation in energy and food, with debt financed “renting” out of overpriced vehicles as the kicker. Sales at discretionary retailers like restaurants, sporting goods, electronics, and furniture stores were either flat or down. The MSM bullshit is a lie.


Natural Gas Prices Should Double

Gasoline prices are already up 30% from their lows in a matter of weeks. That’s how fast things can change in the real world. As more and more oil companies tied to oil and natural gas fracking declare bankruptcy in 2016/2017, the over supply will disappear and prices will rise. Art uses facts to predict natural gas prices will double in the next twelve months.

Luckily, none of us use gasoline for our cars or natural gas for heat and cooking. So, the 30% to 100% increase in these costs won’t effect that CPI number that Yellen keeps telling us is too low. As even the fake BLS inflation numbers jump above 3%, old lady Yellen will say it’s temporary and not raise rates again. So it goes.


Guest Post by Art Berman

Natural gas prices should double over the next year.

Over-supply plus a warm 2015-2016 winter have resulted in low gas prices. That is about to change because supply is decreasing (Figure 1).

Supply Balance_STEO_JAN 2016 Natural Gas 24 Jan 2016

Figure 1. EIA U.S. natural gas supply balance and forecast. Production, consumption and supply balance values are 12-month moving averages. Source: EIA and Labyrinth Consulting Services, Inc.

Total supply–dry gas production plus net imports–has been declining since October 2015* because gas production is flat, imports are decreasing and exports are increasing. Shale gas production has stopped growing and conventional gas has been declining for the past 15 years. As a result, the supply surplus that has existed since December 2014 is disappearing and will move into deficit by November 2016 according to data in the EIA March STEO (Short Term Energy Outlook) .

During the last supply deficit from December 2012 to November 2014, Henry Hub spot prices averaged $4.05 per mmBtu. Prices averaged $1.99 per mmBtu in the first quarter of 2016 so it is reasonable that prices may double during the next period of deficit.

Continue reading “Natural Gas Prices Should Double”

NO INFLATION?

Aren’t you glad you don’t need to use gasoline or any other oil based products in your everyday life? I’m sure Yellen will write this off as transitory. Why disrupt a Fed induced bull market for the .1% with any move from extreme emergency level interest rates. That would be disconcerting to Jamie Dimon and his ilk. There would be hundreds of angry calls from the Hamptons to the Eccles building in D.C.

Producer Prices Jump MoM Most Since Sept 2012 Driven By Higher Energy Costs

Tyler Durden's picture

Producer Prices Final Demand rose 0.5% MoM – the biggest monthly rise since September 2012. With the gasoline index up a stunning 17% (but but but) 80% of the broad-based advance is attributable to prices for final demand energy – which increased 5.9%. In contrast, Final Demand PPI YoY Ex Food & Energy dropped to +0.6% – the lowest on record in the short time series.


Biggest jump in PPI in almost 3 years…


WHY ISN’T GASOLINE $1.75 PER GALLON?

The price of oil topped out at $107 per barrel in June of 2014. The price of gasoline topped out at $3.70 per gallon in June of 2014. The price of oil currently stands at $50 per barrel, 53% below its June price.

I read story after story about record U.S. production, a huge glut in storage, and predictions of even lower oil prices. If this is so, why are national gasoline prices still at $2.39 per gallon? That is only 35% lower than the peak in June. The last time I checked, oil is the only key ingredient in gasoline. If gasoline prices tracked the decline in oil prices, it should be 27% cheaper than the $2.39 they are selling it for today.

How come the average American gets screwed no matter what happens in the markets? The price of oil is the same as it was in November, but gas prices have surged by 18%. Who benefits? Who is winning?

Goldman Sachs and the rest of the Wall Street shysters, along with Big Oil, have it rigged in their favor. You are just a pawn in their game.


DECEMBER RETAIL SALES – UNEQUIVOCAL DISASTER

In case you hadn’t noticed, the MSM storyline was obliterated this morning with the December retail sales report. There is absolutely no way for the shysters and charlatans in the media, Wall Street or government to spin this data in a positive manner. The shit is hitting the fan. A recession for the average American is confirmed. Plunging gas prices haven’t done shit to motivate people to spend money they don’t have.

And guess what you won’t hear from CNBC or any of the corporate media?

POLAR VORTEX


You see, that was the storyline last year to explain the terrible December and January retail sales. So let me get this straight. Last December the country was buried under snow in sub-zero temperatures versus a tranquil, calm, non-snowy December this year. Not a peep from The MSM about last December’s Polar vortex

Shouldn’t this great weather, “fabulous” plunge in the unemployment rate, and billions of dollars put back into pockets by collapsing gas prices, have spurred an awesome retail sales surge this year? The Wall Street shysters drove the stock market to record highs in December based on this false storyline. The decline in real wages in November revealed the falsehood of the jobs recovery. Any savings from lower gas prices is being used to pay down credit card debt and pay for the dramatically higher healthcare costs caused by Obamacare.

This economy is in the tank and headed lower. The GDP numbers are a sham. The employment numbers are a sham. You know it. I know it. And now the sheep are waking up and realize they have been lied to. Stock market records are meaningless to people trying to get by on a daily basis.

After perusing the data on the Census Bureau website, here are my observations:

  • Year over year retail sales only rose 3.2% in December. That is before inflation, which the BLS says was 1.7% and I say is above 4%. Either way, real sales sucked. Then take into consideration there were 3 million less employed people and a polar vortex last December.
  • The MSM said consumers had a windfall from the $6.5 billion decrease in gasoline sales. We were all supposed to buy a new HDTV or iGadget with our newly found riches. Oops. Electronics and appliance sales FELL in December versus November.
  • Retail sales simply don’t fall in December versus November unless you are in recession or headed into recession.
  • It seems even the subprime auto loan scheme is petering out. Auto sales (7 year rentals) declined in December. Maybe the fact that auto loan debt delinquencies are approaching 2008 levels is giving them pause in selling autos to people without the means or inclination to make the payments.
  • Anyone looking for a JC Penney, Sears, Macy’s led department store revival is sad. Clothing store sales dropped. Department store sales dropped. Sporting goods store sales dropped.
  • And drum roll please. On-line store sales DROPPED. The Amazon revolution is dead.

It seems the markets don’t like it. The pain has just begun. A global recession is underway. It’s a deflationary unwinding of debt and mal-investment. There is no cure except for collapse. Central bankers have shot their load. Their credibility is shot. No one believes more debt will cure a debt problem – except for a few Ivy League educated economists. A shitstorm is a brewing. Get ready.

ADMIN WAS WRONG

I believe I made a statement in a post or comment a few months ago that we would never see gasoline below $3.00 per gallon ever again. Well, last week I saw gasoline advertised for $2.95 per gallon. Peak cheap oil must be a false storyline. Facts must no longer matter.

Read it here first.


I WAS WRONG


Make sure you take a screen shot. It might never happen again. I mean it might be the last time you ever see me admit that I was wrong, with the likes of SSS, Llpoh, and Stuck ready to pounce on any sign of weakness.

I failed to anticipate a drastic global economic slowdown and the lengths to which Obama and Saudi Arabia would go to try and destroy the Russian and Iranian economies. The energy independence crowd is crowing that the shale oil miracle has achieved nirvana for the American people. There is one law that works the majority of the time – supply and demand.

The reason prices have crashed is because worldwide consumption has stopped growing due to recession in Europe, stagnation in the U.S., and a slowdown in China. There has been no dramatic increase in supply. Adjusted for population growth, the number of miles being driven by vehicles in the U.S. are are at the same level they were in 1995, and down 9% from the 2005 peak. This is not due to engine efficiency. Gas guzzling pickups, SUVs and sports cars still acount for 75% of vehicle sales. The vehicle miles have declined because commerce has been reduced, requiring less trucking, and people without jobs don’t have to drive to work.

Normally, OPEC would cut production to maintain prices above $90 per barrel when demand softened. This time, backroom deals with the U.S. and EU, have kept Saudi Arabia pumping oil at high levels. The plan is to make Putin and Iran pay for their unwillingness to cooperate and bow down to the American Empire. The unintended consequences of this act of economic warfare could be considerable. In the short-term OPEC collusion with the American Empire can cause economic pain to Russia and Iran. One problem. The Russian and Iranian people are used to hardship. They’ll deal with it.

In the long-run Saudi Arabia and 90% of the oil producing countries need oil prices in excess of $90 per barrel or their people will get restless. And we all know what happens when Muslims get restless.

Obama’s master plan to crush Putin will fail. But he may succeed in derailing his shale oil boom. These wells already deplete at a rate of 90% after two years. In order for companies to invest the millions required to begin a new well, they need an oil price in excess of $80 to consider starting the well. This morning, oil dropped below $80. No investment in new wells = rapid decline in shale oil output. The miracle dies.

I may have been wrong about gasoline dropping below $3.00 per gallon, and I’m certainly enjoying the $15 per week in savings, but it won’t last long. Supply and demand will reassert itself in the near future.

AND YELLEN IS CONCERNED ABOUT DEFLATION

So yesterday we find that retail sales are FALLING. Today we find out that prices are SOARING. Sounds bullish to me. Buy stocks. Don’t miss the train to riches. We already know the government massages every data point to extract the best possible view, so when they report an inflation number like they did today, you know the shit is hitting the fan. They’ve run out of hedonistic adjustments and the other bullshit they use to fake the inflation numbers.

Even the number they reported today is a lie. Look at the supposed March and April PPI for Energy. The BLS drones are telling you that energy prices have fallen by 1.1% over that time period. Let’s add a little reality to their bullshit storyline of declining energy prices:

  • National gas prices rose from $3.52 per gallon on March 1 to $3.66 per gallon on April 30. That is a 4% increase in two months.
  • Oil prices were $101 per barrel on March 1, averaged about $102 per barrel over the two months and finished at $101 per barrel on April 30. No drop there.
  • Natural gas on March 1 was $4.60 and on April 30 was $4.85. Based on my years of financial training, I believe that is an increase.

What energy product fell? Oil, gasoline and natural gas supply the vast majority of energy in this country and the prices of those products rose from March 1 through April 30, but the government tells you the prices fell. Who do you believe?

It’s all good. Yellen assures us the 3.6% year to date PPI is an aberration and QE hasn’t had any negative impact on the lives of average Americans. Tell that to the 85 year old widows getting $0 on their savings and eating Alpo for dinner. 

Producer Prices Surge Most In Over Four Years As BLS Discovers Food Inflation

Tyler Durden's picture

And just like that, the BLS is reacquainted with soaring food prices.

Moments ago the US government reported that producer prices, as part of a newly reindexed PPI series, spiked by 2.1% from a year ago, or a whopping 0.6% surge in April, the biggest monthly jump since January 2010, and up from the 0.5% increase in March.

So what caused this surge in producer prices? Why food costs of course, which in April soared by 2.7%.

Here is the explanation for the finished goods price surge:

Special grouping, Finished goods: The index for finished goods moved up 0.7 percent in April. (The finished goods index represents about two-thirds of final demand goods, through the exclusion of the weight for government purchases and exports. The finished goods index represents about one-quarter of overall final demand.) The broad-based increase was led by the index for finished consumer foods, which advanced 2.4 percent. Prices for finished goods less foods and energy and for finished consumer energy goods rose 0.3 percent and 0.5 percent, respectively. Within finished goods, higher prices for meats, gasoline, light motor trucks, residential electric power, processed poultry, and eggs for fresh use outweighed lower prices for residential natural gas, passenger cars, and soft drinks.

It wasn’t just finished goods that was burned by food prices. Processed goods by intermediate demand…

In April, the index for processed eggs jumped 25.3 percent. Prices for ethanol, meats, gasoline, and commercial electric power also increased. Conversely, the index for jet fuel declined 5.3 percent. Prices for diesel fuel, primary basic organic chemicals, natural gas to electric utilities, and soybean cake and meal also fell

Unprocessed goods too…

The index for unprocessed goods for intermediate demand rose 0.4 percent in April after edging down 0.1 percent a month earlier. Leading the advance, prices for unprocessed foodstuffs and feedstuffs moved up 3.6 percent.


In April, a 9.4-percent jump in prices for slaughter chickens led the advance in the index for unprocessed goods for intermediate demand. The indexes for slaughter hogs, corn, soybeans, carbon steel scrap, and crude petroleum also moved up.

And so on. The good news however is that as food prices soar, and as rents hit all time highs, wages are rising in lockstep. Oh wait, never mind.


What Food Inflation?

Tyler Durden's picture

Oh, this food inflation.

Incidentally, the last time food prices spiked by this much in one month, the resulting Arab Spring wave of revolutions tumbled governments across north Africa and the middle east.

Keep a close eye on those who are not exactly participating in the global central bank cartel’s “wealth transfer effect” , and suddenly find they can’t afford food again.

Source: BLS

THE FOURTEEN YEAR RECESSION

 “When a government is dependent upon bankers for money, they and not the leaders of the government control the situation, since the hand that gives is above the hand that takes. Money has no motherland; financiers are without patriotism and without decency; their sole object is gain.”Napoleon Bonaparte

 Click to View

“A great industrial nation is controlled by its system of credit. Our system of credit is privately concentrated. The growth of the nation, therefore, and all our activities are in the hands of a few men … [W]e have come to be one of the worst ruled, one of the most completely controlled and dominated, governments in the civilized world—no longer a government by free opinion, no longer a government by conviction and the vote of the majority, but a government by the opinion and the duress of small groups of dominant men.”Woodrow Wilson

When you ponder the implications of allowing a small group of powerful wealthy unaccountable men to control the currency of a nation over the last one hundred years, you understand why our public education system sucks. You understand why the government created Common Core curriculum teaches children that 3 x 4 = 13, as long as you feel good about your answer. George Carlin was right. The owners of this country (bankers, billionaires, corporate titans, politicians) want more for themselves and less for everyone else. They want an educational system that creates ignorant, obedient, vacuous, obese dullards who question nothing, consume mass quantities of corporate processed fast food, gaze at iGadgets, are easily susceptible to media propaganda and compliant to government regulations and directives. They don’t want highly educated, critical thinking, civil minded, well informed, questioning citizens understanding how badly they have been screwed over the last century. I’m sorry to say, your owners are winning in a landslide.

The government controlled public education system has flourished beyond all expectations of your owners. We’ve become a nation of techno-narcissistic, math challenged, reality TV distracted, welfare entitled, materialistic, gluttonous, indebted consumers of Chinese slave labor produced crap. There are more Americans who know the name of Kanye West and Kim Kardashian’s bastard child (North West) than know the name of our Secretary of State (Ketchup Kerry). Americans can generate a text or tweet with blinding speed but couldn’t give you change from a dollar bill if their life depended upon it. They are whizzes at buying crap on Amazon or Ebay with a credit card, but have never balanced their checkbook or figured out the concept of deferred gratification and saving for the future. While the ignorant masses are worked into a frenzy by the media propaganda machine over gay marriage, diversity, abortion, climate change, and never ending wars on poverty, drugs and terror, our owners use their complete capture of the financial, regulatory, political, judicial and economic systems to pillage the remaining national wealth they haven’t already extracted.

The financial illiteracy of the uneducated lower classes and the willful ignorance of the supposedly highly educated classes has never been more evident than when examining the concept of Federal Reserve created currency debasement – also known as inflation. The insidious central banker created monetary inflation is the cause of all the ills in our warped, deformed, rigged financialized economic system. The outright manipulation and falsity of government reported economic data is designed to obscure the truth and keep the populace unaware of the deception being executed by the owners of this country. They have utilized deceit, falsification, propaganda and outright lies to mislead the public about the true picture of the disastrous financial condition in this country. Since most people are already trapped in the mental state of normalcy bias, it is easy for those in control to reinforce that normalcy bias by manipulating economic data to appear normal and using their media mouthpieces to perpetuate the false storyline of recovery and a return to normalcy.

This is how feckless politicians and government apparatchiks are able to add $2.8 billion per day to the national debt; a central bank owned by Too Big To Trust Wall Street banks has been able to create $3.3 trillion out of thin air and pump it into the veins of its owners; and government controlled agencies report a declining unemployment rate, no inflation and a growing economy, without creating an iota of dissent or skepticism from the public. Americans want to be lied to because it allows them to continue living lives of delusion, where spending more than you make, consuming rather than saving, and believing stock market speculation and home price appreciation will make them rich are viable life strategies. Even though 90% of the population owns virtually no stocks, they are convinced record stock market highs are somehow beneficial to their lives. They actually believe Bernanke/Yellen when they bloviate about the dangers of deflation. Who would want to pay less for gasoline, food, rent, or tuition?

Unless you are beholden to the oligarchs, that sense of stress, discomfort, feeling that all in not well, and disturbing everyday visual observations is part of the cognitive dissonance engulfing the nation. Anyone who opens their eyes and honestly assesses their own financial condition, along with the obvious deterioration of our suburban sprawl retail paradise infrastructure, is confronted with information that is inconsistent with what they hear from their bought off politician leaders, highly compensated Ivy League trained economists, and millionaire talking heads in the corporate legacy media. Most people resolve this inconsistency by ignoring the facts, rejecting the obvious and refusing to use their common sense. To acknowledge the truth would require confronting your own part in this Ponzi debt charade disguised as an economic system. It is easier to believe a big lie than think critically and face up to decades of irrational behavior and reckless conduct.

What’s In Your GDP                          

“The Gross Domestic Product (GDP) is one of the broader measures of economic activity and is the most widely followed business indicator reported by the U.S. government. Upward growth biases built into GDP modeling since the early 1980s, however, have rendered this important series nearly worthless as an indicator of economic activity.  The popularly followed number in each release is the seasonally adjusted, annualized quarterly growth rate of real (inflation-adjusted) GDP, where the current-dollar number is deflated by the BEA’s estimates of appropriate price changes. It is important to keep in mind that the lower the inflation rate used in the deflation process, the higher will be the resulting inflation-adjusted GDP growth.”John Williams – Shadowstats

GDP is the economic statistic bankers, politicians and media pundits use to convince the masses the economy is growing and their lives are improving. Therefore, it is the statistic most likely to be manipulated, twisted and engineered in order to portray the storyline required by the oligarchs. Two consecutive quarters of negative GDP growth usually marks a recession. Those in power do not like to report recessions, so data “massaging” has been required over the last few decades to generate the required result. Prior to 1991 the government reported the broader GNP, which includes the GDP plus the balance of international flows of interest and dividend payments. Once we became a debtor nation, with massive interest payments to foreigners, reporting GNP became inconvenient. It is not reported because it is approximately $900 billion lower than GDP. The creativity of our keepers knows no bounds. In July of 2013 the government decided they had found a more “accurate” method for measuring GDP and simply retroactively increased GDP by $500 billion out of thin air. It’s amazing how every “more accurate” accounting adjustment improves the reported data. The economic growth didn’t change, but GDP was boosted by 3%. These adjustments pale in comparison to the decades long under-reporting of inflation baked into the GDP calculation.

As John Williams pointed out, GDP is adjusted for inflation. The higher inflation factored into the calculation, the lower reported GDP. The deflator used by the BEA in their GDP calculation is even lower than the already bastardized CPI. According to the BEA, there has only been 32% inflation since the year 2000. They have only found 1.4% inflation in the last year and only 7.1% in the last five years. You’d have to be a zombie from the Walking Dead or an Ivy League economist to believe those lies. Anyone living in the real world knows their cost of living has risen at a far greater rate. According to the government, and unquestioningly reported by the compliant co-conspirators in the the corporate media, GDP has grown from $10 trillion in 2000 to $17 trillion today. Even using the ridiculously low inflation BEA adjustment yields an increase from $12.4 trillion to only $15.9 trillion in real terms. That pitiful 28% growth over the last fourteen years is dramatically overstated, as revealed in the graph below. Using a true rate of inflation exposes the grand fraud being committed by those in power. The country has been in a never ending recession since 2000.   

Your normalcy bias is telling you this is impossible. Your government tells you we have only experienced a recession from the third quarter of 2008 through the third quarter of 2009. So despite experiencing two stock market crashes, the greatest housing crash in history, and a worldwide financial system implosion the authorities insist  we’ve had a growing economy 93% of the time over the last fourteen years. That mental anguish you are feeling is the cognitive dissonance of wanting to believe your government, but knowing they are lying. It is a known fact the government, in conspiracy with Greenspan, Congress and academia, have systematically reduced the reported CPI based upon hedonistic quality adjustments, geometric weighting alterations, substitution modifications, and the creation of incomprehensible owner’s equivalent rent calculations. Since the 1700s consumer inflation had been estimated by measuring price changes in a fixed-weight basket of goods, effectively measuring the cost of maintaining a constant standard of living. This began to change in the early 1980s with the Greenspan Commission to “save” Social Security and came to a head with the Boskin Commission in 1995.

Simply stated, the Greenspan/Boskin Commissions’ task was to reduce future Social Security payments to senior citizens by deceitfully reducing CPI and allowing politicians the easy way out. Politicians would lose votes if they ever had to directly address the unsustainability of Social Security. Therefore, they allowed academics to work their magic by understating the CPI and stealing $700 billion from retirees in the ten years ending in 2006. With 10,000 baby boomers per day turning 65 for the next eighteen years, understating CPI will rob them of trillions in payments. This is a cowardly dishonest method of extending the life of Social Security.

If CPI was calculated exactly as it was computed prior to 1983, it would have averaged between 5% and 10% over the last fourteen years. Even computing it based on the 1990 calculation prior to the Boskin Commission adjustments, would have produced annual inflation of 4% to 7%. A glance at an inflation chart from 1872 through today reveals the complete and utter failure of the Federal Reserve in achieving their stated mandate of price stability. They have managed to reduce the purchasing power of your dollar by 95% over the last 100 years. You may also notice the net deflation from 1872 until 1913, when the American economy was growing rapidly. It is almost as if the Federal Reserve’s true mandate has been to create inflation, finance wars, perpetuate the proliferation of debt, artificially create booms and busts, enrich their Wall Street owners, and impoverish the masses. Happy Birthday Federal Reserve!!!

 Click to View

When you connect the dots you realize the under-reporting of inflation benefits the corporate fascist surveillance state. If the government was reporting the true rate of inflation, mega-corporations would be forced to pay their workers higher wages, reducing profits, reducing corporate bonuses, and sticking a pin in their stock prices. The toady economists at the Federal Reserve would be unable to sustain their ludicrous ZIRP and absurd QEfinity stock market levitation policies. Reporting a true rate of inflation would force long-term interest rates higher. These higher rates, along with higher COLA increases to government entitlements, would blow a hole in the deficit and force our spineless politicians to address our unsustainable economic system. There would be no stock market or debt bubble. If the clueless dupes watching CNBC bimbos and shills on a daily basis were told the economy has been in fourteen year downturn, they might just wake up and demand accountability from their leaders and an overhaul of this corrupt system.          

Mother Should I Trust the Government?

We know the BEA has deflated GDP by only 32% since 2000. We know the BLS reports the CPI has only risen by 37% since 2000. Should I trust the government or trust the facts and my own eyes? The data is available to see if the government figures pass the smell test. If you are reading this, you can remember your life in 2000. Americans know what it cost for food, energy, shelter, healthcare, transportation and entertainment in 2000, but they unquestioningly accept the falsified inflation figures produced by the propaganda machine known as our government. The chart below is a fairly comprehensive list of items most people might need to live in this world. A critical thinking individual might wonder how the government can proclaim inflation of 32% to 37% over the last fourteen years, when the true cost of living has grown by 50% to 100% for most daily living expenses. The huge increases in property taxes, sales taxes, government fees, tolls and income taxes aren’t even factored in the chart. It seems gold has smelled out the currency debasement and the lies of our leaders. This explains the concerted effort by the powers that be to suppress the price of gold by any means necessary.   

Living Expense

Jan-00

Mar-14

% Increase

Gallon of gas

$1.27

$3.51

176.4%

Barrel of oil

$24.11

$100.00

314.8%

Fuel oil per gallon

$1.19

$4.07

242.0%

Electricity per Kwh

$0.084

$0.134

59.5%

Gas per therm

$0.712

$1.078

51.4%

Dozen eggs

$0.97

$2.00

106.2%

Coffee per lb

$3.40

$5.20

52.9%

Ground Beef per lb.

$1.90

$3.73

96.3%

Postage stamp

$0.33

$0.49

48.5%

Movie ticket

$5.25

$10.25

95.2%

New car

$20,300.00

$31,500.00

55.2%

Annual healthcare spending per capita

$4,550.00

$9,300.00

104.4%

Average private college tuition

$22,000.00

$37,000.00

68.2%

Avg home price (Case Shiller)

$161,000.00

$242,000.00

50.3%

Avg monthly rent (Case Shiller)

$635.00

$890.00

40.2%

Ounce of gold

$279.00

$1,334.00

378.1%

Mother, you should not trust the government. There is no doubt they have systematically under-reported inflation based on any impartial assessment of the facts. The reality that we remain stuck in a fourteen year recession is borne out by the continued decline in vehicle miles driven (at 1995 levels) due to declining commercial activity, the millions of shuttered small businesses, and the proliferation of Space Available signs in strip malls and office parks across the land. The fact there are only 8 million more people employed today than were employed in 2000, despite the working age population growing by 35 million, might be a clue that we remain in recession. If that isn’t enough proof for you, than maybe a glimpse at real median household income, retail sales and housing will put the final nail in the coffin of your cognitive dissonance.

The government and their media mouthpieces expect the ignorant masses to believe they have advanced their standard of living, with median household income growing from $40,800 to $52,500 since 2000. But, even using the badly flawed CPI to adjust these figures into real terms reveals real median household income to be 7.3% below the level of 2000. Using a true inflation figure would cause a CNBC talking head to have an epileptic seizure.        

Click to View

The picture is even bleaker when broken down into the age of households, with younger households suffering devastating real declines in household income since 2000. I guess all those retail clerk, cashier, waitress, waiter, food prep, and housekeeper jobs created over the last few years aren’t cutting the mustard. Maybe that explains the 30 million increase (175% increase) in food stamp recipients since 2000, encompassing 19% of all households in the U.S. Luckily the banking oligarchs were able to convince the pliable masses to increase their credit card, auto and student loan debt from $1.5 trillion to $3.1 trillion over the fourteen year descent into delusion.

When you get your head around this unprecedented decline in household income over the last fourteen years, along with the 50% to 100% rise in costs to live in the real world, as opposed to the theoretical world of the Federal Reserve and BLS, you will understand the long term decline in retail sales reflected in the following chart. When you adjust monthly retail sales for gasoline (an additional tax), inflation (understated), and population growth, you understand why retailers are closing thousands of stores and hurdling towards inevitable bankruptcy. Retail sales are 6.9% below the June 2005 peak and 4% below levels reached in 2000. And this is with millions of retail square feet added over this time frame. We know the dramatic surge from the 2009 lows was not prompted by an increase in household income. So how did the 11% proliferation of spending happen?

Click to View

The up swell in retail spending began to accelerate in late 2010. Considering credit card debt outstanding is at exactly where it was in October 2010, it seems consumers playing with their own money turned off the spigot of speculation. It has been non-revolving debt that has skyrocketed from $1.63 trillion in February 2010 to $2.26 trillion today. This unprecedented 39% rise in four years has been engineered by the government, using your tax dollars and the tax dollars of unborn generations. The Federal government has complete control of the student loan market and with their 85% ownership of Ally Financial, the largest auto financing company, a dominant position in the auto loan market. The peddling of $400 billion of subprime student loan debt and $200 billion of subprime auto loan debt has created the illusion of a retail recovery. The student loan debt has been utilized by University of Phoenix MBA wannabes  to buy iGadgets, the latest PS3 version of Grand Theft Auto and the latest glazed donut breakfast sandwich on the market. It’s nothing but another debt financed bubble that will end in tears for the American taxpayer, as hundreds of billions will be written off.

The fake retail recovery pales in comparison to the wolves of Wall Street produced housing recovery sham. They deserve an Academy Award for best fantasy production. The Federal Reserve fed Wall Street hedge fund purchase of millions of foreclosed shanties across the nation has produced media proclaimed home price increases of 10% to 30% in cities across the country. Withholding foreclosures from the market and creating artificial demand with free money provided by the Federal Reserve has temporarily added $4 trillion of housing net worth and reduced the number of underwater mortgages on the books of the Too Big To Trust Wall Street banks. The percentage of investor purchases and cash purchases is at all-time highs, while the percentage of first time buyers is at all-time lows. Anyone with an ounce of common sense can look at the long-term chart of mortgage applications and realize we are still in a recession. Applications are 35% below levels at the depths of the 2008/2009 recession. Applications are 65% below levels at the housing market peak in 2005. They are even 35% below 2000 levels. There is no real housing recovery, despite the propaganda peddled by the NAR, CNBC, and Wall Street. It’s a fraud.   

It is the pinnacle of arrogance and hubris that a few Ivy League educated economists sitting in the Marriner Eccles Building in the swamps of Washington D.C., who have never worked a day in their lives at a real job, think they can create wealth and pull the levers of money creation to control the American and global financial systems. All they have done is perfect the art of bubble finance in order to enrich their owners at the expense of the rest of us. Their policies have induced unwarranted hope and speculation on a grand scale. Greenspan and Bernanke have provoked multiple bouts of extreme speculation in stocks and housing over the last 15 years, with the subsequent inevitable collapses. Fed encouraged gambling does not create wealth it just redistributes it from the peasants to the aristocracy. The Fed has again produced an epic bubble in stock and bond valuations which will result in another collapse. Normalcy bias keeps the majority from seeing the cliff straight ahead. Federal Reserve monetary policies have distorted financial markets, created extreme imbalances, encouraged excessive risk taking, and ruined the lives of working class people. Take a long hard look at the chart below and answer one question. Was QE designed to benefit Main Street or Wall Street?  

The average American has experienced a fourteen year recession caused by the monetary policies of the Federal Reserve. Our leaders could have learned the lesson of two Fed induced collapses in the space of eight years and voluntarily abandoned the policies of reckless credit expansion, instead embracing policies encouraging saving, capital investment and balanced budgets. They have chosen the same cure as the disease, which will lead to crisis, catastrophe and collapse.  

“There is no means of avoiding the final collapse of a boom brought about by credit expansion. The alternative is only whether the crisis should come sooner as the result of voluntary abandonment of further credit expansion, or later as a final and total catastrophe of the currency system involved.” – Ludwig von Mises


BLS LIES REVEALED IN A FEW CHARTS

The Bureau of Lies and Shams issued their latest Orwellian data report this morning. They declared that inflation was only up .1% in February, despite the massive jump in food prices. Here is the MSM regurgitation of the BLS bullshit propaganda. A real journalist might verify the numbers to see if they pass the smell test.

Consumer prices edge up in February as food prices jump

Last month’s 0.1% increase driven by biggest spike in food costs since 2011

WASHINGTON (MarketWatch) — Consumer prices in the U.S. rose slightly in February because of higher food and housing costs, but overall inflation remained quiet, according to the latest government figures. The price of food jumped 0.4% — the largest gain since September 2011 — because of higher costs of meat, poultry, fish and vegetables. Still, food prices have only risen 1.4% over the past year.The cost of energy fell 0.5% as lower gasoline costs offset increases in fuel oil and natural gas. High demand for home heating fuels boosted prides during a very cold month.

The drones at the BLS declare that energy prices plummeted in February due to lower gasoline costs. Let’s look at a handy dandy chart of the actual price of gasoline over the last three months. Well looky here. The average price of a gallon of gasoline on February 1 was $3.26 per gallon. The average price of a gallon of gasoline on February 28 was $3.45 per gallon. And the trend was straight up during the entire month. My handy dandy calculator says that gasoline ROSE by 5.8% in February. The BLS says gasoline prices fell dramatically. Do you believe the BLS drones or your pocketbook? How can they get away with these blatant lies? Oil rose from $97 per barrel to $102 per barrel. That is a 5.1% increase. Natural gas prices spiked from $5 to over $6 during February before settling back around $5. The average price was easily up 10% over the prior month. How stupid do our government keepers think we are?

Even the BLS contention that food prices went up .4% in February is a lie. That is a 4.8% annualized rate. Let’s see the reality. Pork is up 43% since the beginning of the year. Beef is up 8%. Coffee is up 75%. Corn is up 13%. Wheat is up 12%. Soybeans are up 8%. Cocoa is up 12%.

These are the price changes in the real world, not in the BLS world of manipulation and deception.

The CPI is a fake number issued by the STATE and designed to keep the sheep docile and compliant. In reality true inflation is running above 5%. You know it and I know it. Will the faux journalists in the MSM report the truth? Hell no. They are paid to peddle lies and propaganda by their corporate bosses.


PORK

BEEF

COFFEE

CORN

WHEAT

SOYBEANS

COCOA

“STRONG” RETAIL SALES???

The markets are attempting to rally on the “unexpectedly positive” retail sales numbers for April. The bullshit is getting so deep in this country, you have to wear hip boots. Even though I’m a trusting soul and know the MSM and our Wall Street economist “experts” will tell me what I need to know, I decided to go directly to the report. Here is a link in case you want the actual data:

http://www.census.gov/retail/marts/www/marts_current.pdf

Here are my observations about the “strong” retail sales:

  • Through the beauty of seasonal adjustments the actual 2.7% decrease in retail sales in April versus March becomes a .09% increase, which is rounded up to .1% by the MSM. The government drones would never use seasonal adjustments to make numbers look better than they really are. Right?
  • Even with seasonal adjustments, retail sales only went up $377 million. The subprime financing scam being run by the Obama owned Ally Financial and the other government subsidized Wall Street shysters resulted in a $783 million increase in auto sales. Therefore, retail sales excluding this government use of your tax dollars actually declined by $406 billion.
  • The MSM is crowing about the lower gasoline sales which are benefitting the American consumer. If you look at the 4 month trend versus last year, you see that retail sales at gasoline stations is down 1.1% versus last year. Let me remind you that last year was the highest average price for gasoline in history, so a 1.1% decline is not exactly a windfall to the consumer. Do you see the MSM reporting the facts on this chart?

  • The first four months of retail sales in 2013 have sucked. Overall, they are up 3.3%. Subtracting the government boosted auto sales and the increase is 2.5%. Even using the government manipulated CPI yields basically flat retail sales with 2012. Using a real inflation rate of 5% reveals that real retail sales are declining by 2.5% in the first four months of 2013.
  • If there is a real housing recovery how could retail sales of furniture, electronics and building materials be languishing in the -0.7% to 3.6% range? How can general merchandise sales (Wal-Mart, Target) be 3.4% below last year?

The fact is that real retail sales are falling. The Obama tax increases and Obamacare insurance premium increases have sucked the life out of the consumer. Gas prices have risen 10 cents per gallon in the last two weeks. The busy driving season is coming. The Middle East is a powderkeg. Hurricane season isn’t far off. Companies are cutting the hours of their employees. The savings rate is already at 2.7%. Consumers are reducing credit card debt. There are 10,000 people per day turning 65. Sounds like a recipe for strong retail sale growth. Right?

Maybe a government drone economist could chime in and explain the extreme wide variation in seasonal adjustments over the last ten years. Shouldn’t seasonal adjustments for the same month be fairly consistent over time? Inquiring minds want to know.


ENERGY INDEPENDENCE – THE BIG LIE


 PRICE OF A BARREL OF OIL 1978 – $14.00

“We are the generation that will win the war on the energy problem and in that process, rebuild the unity and confidence of America.” – President Jimmy Carter, 1979

“We have it in our power to act right here, right now. I propose $6 billion in tax cuts and research and developments to encourage innovation, renewable energy, fuel-efficient cars, and energy-efficient homes.” – President Bill Clinton, 1998

“I think that in ten years, we can reduce our dependence so that we no longer have to import oil from the Middle East or Venezuela. I think that’s about a realistic time frame…That’s why I’ve focused on putting resources into solar, wind, biodiesel, geothermal. These have been priorities of mine since I got to the Senate, and it is absolutely critical that we develop a high fuel efficient car that’s built not in Japan and not in South Korea, but built here in the United States of America.” – President Barack Obama, 2008

“We don’t have to wait on OPEC anymore. We don’t have to let them hold us hostage. America’s got the energy. Let’s have American energy independence.”- Rick Perry, CNN Debate, October 18

“We must become independent from foreign sources of oil. This will mean a combination of efforts related to conservation and efficiency measures, developing alternative sources of energy like biodiesel, ethanol, nuclear, and coal gasification, and finding more domestic sources of oil such as in ANWR or the Outer Continental Shelf (OCS).”Mitt Romney  

PRICE OF A BARREL OF BRENT OIL 2011 – $114.00


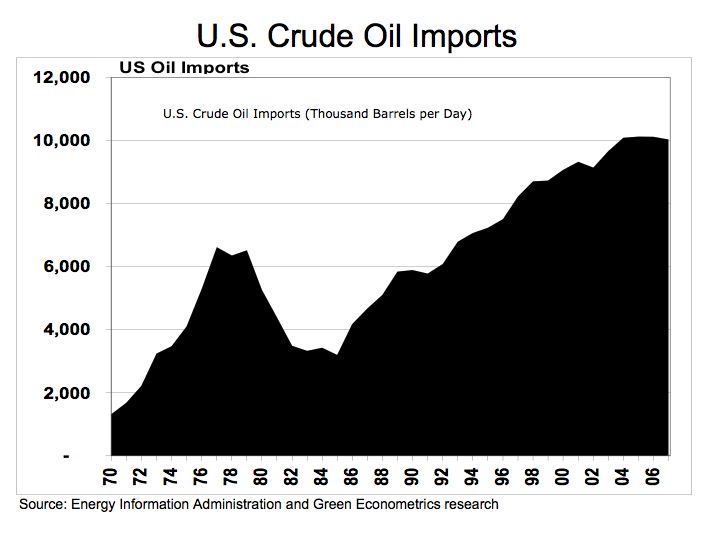
It is too bad that our 255 million cars can’t run on hot air. American presidents have propagated the Big Lie of energy independence for the last three decades. The Democrats have lied about green energy solutions and the Republicans have lied about domestic sources saving the day. These deceitful politicians put the country at risk as they misinform and mislead the non-thinking American public. They have been declaring our energy independence for 30 years, but we import three times as much oil today as we did in the early 1980’s. The CPI has gone up 350% since 1978, but the price of a barrel of oil has risen 800% over the same time frame. Today, I hear the same mindless fabrications from politicians and pundits about our ability to become energy independent. Any critical thinking analysis of the hard facts reveals that the United States will grow increasingly dependent upon other countries to supply our energy needs from a dwindling and harder to access supply of oil and natural gas. The fantasy world of plug in cars, corn driven vehicles and solar energy running our manufacturing plants is a castle in the sky flight of imagination. The linear thinking academic crowd believes a technological miracle will save us, when it is evident technology fails without infinite quantities of cheap oil.

I know the chart below requires some time to grasp, but I’m sure the average American can take five minutes away from watching Jersey Shore, Dancing with the Stars, or the latest update of the Kardashian saga to understand why the propaganda about energy independence is nothing but falsehoods. You have U.S. energy demand by sector on the right and the energy source by fuel on the left. Total U.S. energy use is nearly 100 quadrillion Btu. In physical energy terms, 1 quad represents 172 million barrels of oil (8 to 9 days of U.S. oil use), 50 million tons of coal (enough to generate about 2% of annual U.S. electricity use), or 1 trillion cubic feet of natural gas (about 4% of annual U.S. natural gas use).  

Please note that 37% of our energy source is petroleum, which supplies 95% of the energy for our transportation sector. That means your car and the millions of 18 wheelers that deliver your food to your grocery stores and electronic gadgets to your Best Buy. You can’t fill up your SUV with coal, natural gas, nuclear energy or sunshine. Without the 7 billion barrels of oil we use every year, our just in time mall centric suburban sprawl society would come to a grinding halt. There is no substitute for cheap plentiful oil anywhere in sight. The government sponsored ethanol boondoggle has already driven food prices higher, while requiring more energy to produce than it generates. Only a government “solution” could raise food prices, reduce gas mileage, and bankrupt hundreds of companies in an effort to reduce our dependence on oil. Natural gas as a transportation fuel supplies 2% of our needs. The cost to retro-fit 160,000 service stations across the country to supply natural gas as a fuel for the non-existent natural gas automobiles would be a fool’s errand and take at least a decade to implement.   


The green energy Nazis despise coal and nuclear power, which account for 31% of our energy supply. They want to phase coal out. They aren’t too fond of fracking either, so there goes another 23% of our supply. You might be able to make out that itsy bitsy green circle with the 7% of our supply from renewable energy. And more than half of that energy is supplied by hydro power. Less than 2% of our energy needs are met by solar and wind. For some perspective, we need to use the equivalent of 17 billion barrels of oil per year to run our society and solar and wind supplies the equivalent energy of about 300 million barrels of that total. I think our green energy dreams will come up just a smidgen short of meeting our demands. Nothing can replace oil as the lifeblood of our culture and there is no domestic supply source which will eliminate or even reduce our dependence upon the 10 million barrels per day we import from foreign countries. There are some hard truths that are purposefully ignored by those who want to mislead the public about the grim consequences of peak cheap oil:

  • The earth is finite. The amount of oil within the crust of the earth is finite. As we drain 32 billion barrels of oil from the earth every year, there is less remaining within the earth. We have drained the cheapest and easiest to reach 1.4 trillion barrels from the earth since the mid 1800s. The remaining recoverable 1.4 trillion barrels will be expensive and hard to reach.
  • The United States has about 2% of the world’s proven oil and gas reserves, but consumes 22% of the world’s oil production and 27% of the world’s natural gas production.
  • Demand for oil will continue to rise no matter what the United States does, as the developing world consumption far outstrips U.S. consumption. Oil is fungible and will be sold to the highest bidder.
  • The concept of energy returned on energy invested (EROEI) is beyond the grasp of politicians and drill, drill, drill pundits. EROEI is the ratio of the amount of usable energy acquired from a particular energy resource to the amount of energy expended to obtain that energy resource. When the EROEI of a resource is less than or equal to one, that energy source becomes an “energy sink”, and can no longer be used as a primary source of energy. Once it requires 1.1 barrels of oil to obtain a barrel of oil, the gig is up.
  • There is a negative feedback loop that revolves around oil supply, oil price and economic growth. As demand continues to rise and supply is more difficult to access, prices will rise. Since oil is an essential ingredient in every aspect of our lives, once the price reaches $120 to $150 a barrel economic growth goes into reverse. Demand crashes and investment in new sources of energy dries up. Rinse and repeat.

Finite World

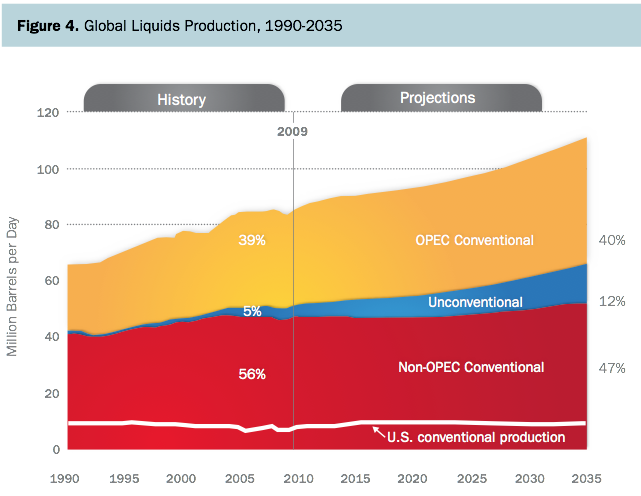
World oil production peaked in 2005 has been flat since then, despite a continuous stream of promises from Saudi Arabia that they are on the verge of increasing production. The chart below from the U.S. Energy Information Administration propagates the standard fabrications about energy supplies. Even though worldwide oil production has clearly peaked, the oil industry PR whores and government agencies continue to project substantial production growth in the future. The mainstream media trots out Daniel Yergin whenever it wants to calm the masses, despite his track record of being 100% wrong 100% of the time. The brilliance of his July, 2005 Op-Ed shines through:

“Prices around $60 a barrel, driven by high demand growth, are fueling the fear of imminent shortage — that the world is going to begin running out of oil in five or 10 years. This shortage, it is argued, will be amplified by the substantial and growing demand from two giants: China and India. There will be a large, unprecedented buildup of oil supply in the next few years. Between 2004 and 2010, capacity to produce oil (not actual production) could grow by 16 million barrels a day — from 85 million barrels per day to 101 million barrels a day — a 20 percent increase. Such growth over the next few years would relieve the current pressure on supply and demand.”

Oil production capacity has not grown by one barrel since Yergin wrote this propaganda piece. This is despite the fact that prices have almost doubled, which should have spurred production. The current energy independence false storyline – the Bakken Formation – has gone from production of 10,000 barrels per day in 2003 to 400,000 barrels per day now, while the hundreds of millions invested in developing the Canadian tar sands have increased production by 50% since 2005. Despite these substantial increases in output, worldwide production has remained flat as existing wells deplete at the same rate that new production is brought online.


The facts are there is approximately 1.4 trillion barrels of recoverable oil left in the crust of the earth. We currently suck 32 billion barrels per year out of the earth. This means we have 44 years of oil left, at current consumption levels. But we know demand is growing from the developing world. Taking this fact into consideration, we have between 35 and 40 years worth of recoverable oil left on the planet. That is not a long time. Additionally, the last 1.4 trillion barrels will much more difficult and costly to extract than the first 1.4 trillion barrels. The remaining oil is miles under the ocean floor, trapped in shale and tar sands, and in the arctic. Despite these hard facts, governmental agencies and politicians continue to paint a rosy picture about our energy future. I watched in stunned amazement last week as five bozos on the McLaughlin Group news program unanimously proclaimed the U.S. would become a net exporter of oil in the coming decade. Do these supposedly intelligent people not understand the basic economics of supply, demand and price?  

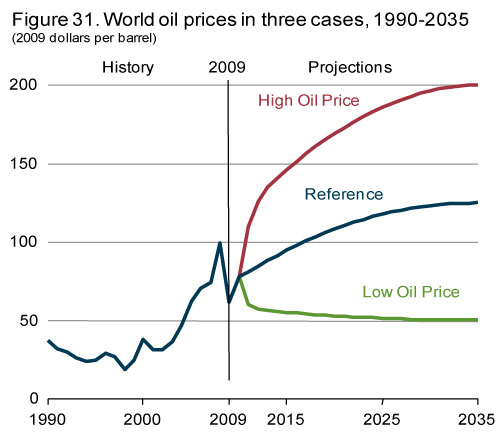
It seems the governmental organizations always paint the future in the most optimistic terms, despite all facts pointing to a contrary outcome. The EIA predicts with a straight face that oil production will rise to 110 million barrels per day, while the price of a barrel of oil remains in the current $100 to $125 per barrel range. Non-OPEC production has been in decline since 2004, but the EIA miraculously predicts a 15% increase in production over the next 25 years. OPEC production has been flat since 2005, but the EIA is confident their 50 year old oil fields will ramp up production by 25% in the next 25 years. Does the EIA consider whether OPEC even wants to increase production? It would appear that constrained supply and higher prices would be quite beneficial to the OPEC countries. And then of course there is the unconventional oil that is supposed to increase from 4 million barrels per day to 13 million barrels per day, a mere 325% increase with no upward impact on prices. These guys would make a BLS government drone blush with the utter ridiculousness of their predictions.


The picture below is an excellent representation of how the easy to access oil and gas of the earth have been tapped. They were close to the surface. The remaining oil and gas is deeper and trapped within shale and sand. The new technology for extracting gas from shale has concerns regarding whether fracking and disposal of waste water can be done safely, especially near highly populated areas. The relationship between fracking and earthquakes could also prove to be problematic. The wells also have rapid decline rates. Add a mile of ocean to the picture below and you have some really expensive to access oil and potential for disaster, as witnessed with the Deep Water Horizon.


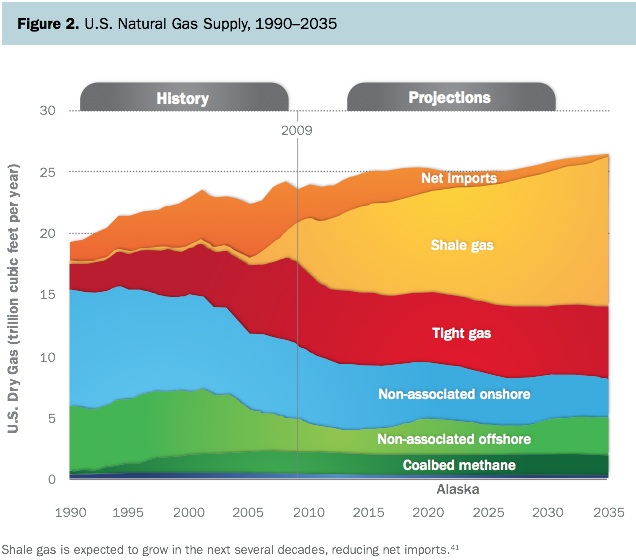
The EIA projects natural gas supply to grow by 10% between now and 2035 due to a 300% increase in shale gas supply. It seems the EIA believes the fantasy of 8 Saudi Arabia’s in the Bakken formation of North Dakota and decades of gas within the Marcellus Shale. These fantasies have been peddled by the natural gas industry in order to get support for their fracking efforts. This false storyline is damaging to the long-term planning that should be taking place now to alleviate the energy scarcity that is our future. In 2006 the EIA reported the possibility of 500 billion barrels of oil in the Bakken formation, based on guesswork. The U.S. Geological Survey has since scaled this back ever so slightly to 3.65 billion barrels, which is six months of U.S. consumption. The deceptions peddled regarding Marcellus shale are also colliding with reality. The U.S. Geological Survey recently produced an estimate of Marcellus Shale resources, which will cause the EIA to reduce its estimate of shale gas reserves for the Marcellus Shale by 80%. The price of natural gas is currently $3.54 MMBtu, down from $13 a few years ago. Extracting natural gas from shale has high capital costs of land, drilling and completion. It is not economically feasible below $6 MMBtu.


Based on the known facts and a realistic view of the future, there will be less supply of oil and natural gas as time goes on. We can already see the impact of these facts today. Even though Europe and the U.S. are in recession, the price of oil continues to rise. The developing world continues to demand more oil and the supply is stagnant. Stunts like withdrawing oil from the Strategic Reserve are foolish and politically motivated. Is the world then running out of oil then? No, but any increase in future global oil production will be modestly incremental and production could be thrown off course by any number of possible events, from an Israeli attack on Iran to (another, but successful this time) al Qaida attack on Saudi Arabia’s Abqaiq oil refinery. Any forecast regarding future oil production and prices isn’t worth the paper it is written on unless consideration to wars, revolutions and terrorism are factored into the equation.

We Don’t Matter

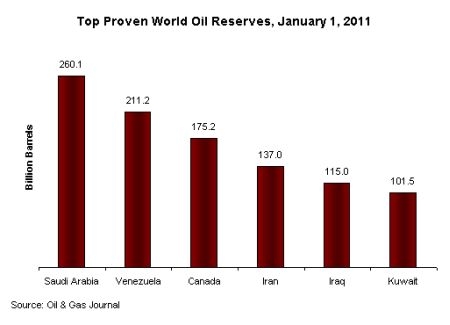
Americans like to think we are the center of the universe. Those who propagate the misinformation about U.S. energy independence are clearly math challenged. The total proven oil reserves in the world total 1.4 trillion barrels and the United States has 22 billion barrels of that total, or 1.6% of the world’s oil. The U.S. burns 7 billion barrels per year, so we have enough oil to survive for three whole years. The U.S. consumes 22% of the world’s oil despite having 4.5% of the world’s population and less than 2% of the world’s oil. Do these facts lead you to the conclusion the United States will be exporting oil in the near future?


When you hear the pundits breathtakingly describe our vast natural gas resources you would think we are the dominant player in this market. Not quite. The United States has 4% of the world’s natural gas reserves. Predictably we consume 22% of the world’s natural gas. Russia controls 25% of the world’s natural gas reserves, with the Middle East countries controlling 40% of the world’s reserves. The pundits can hype our “vast” supplies of natural gas, but the facts clearly reveal it is nothing but hype.


The U.S. is consuming less oil than it was in 2005. U.S. consumption is not the crucial factor in determining the price of oil today and our consumption will matter even less in the future. Emerging market countries, led by China and India, will be the driving force in oil demand in the coming decades. According to the IEA, “Non-OECD [emerging markets] account for 90% of population growth, 70% of the increase in economic output and 90% of energy demand growth over the period from 2010 to 2035.”


This demand is being driven by the growth in vehicles in emerging markets. The U.S. market has reached a saturation point, but China, India and the rest of the world are just beginning their love affairs with the automobile. The accumulation of facts regarding both supply and demand should even convince the most brainless CNBC talking head that the price of oil will continue to rise. The 2008 peak price of $145 per barrel will not hold. The tried and true American method of ignoring problems until they reach crisis proportions will bite us in the ass once again.


Slippery Road Ahead

The concept of EROI is incomprehensible to the peak oil deniers. When Larry Kudlow or one of the other drill, drill, drill morons proclaims the vast amount of oil in North Dakota shale and in Alberta, Canada tar sands, they completely ignore the concept of EROI. Some estimates conclude there are 5 trillion barrels of oil left in the earth. But, only 1.4 trillion barrels are considered recoverable. This is because the other 3.6 trillion barrels would require the expenditure of more energy to retrieve than they can deliver. Therefore, it is not practical to extract. When oil was originally discovered, it took on average one barrel of oil to find, extract, and process about 100 barrels of oil. That ratio has declined steadily over the last century to about three barrels gained for one barrel used up in the U.S. and about ten for one in Saudi Arabia.

The chart below clearly shows the sources of energy which have the highest energy return for energy invested. I don’t think I’ve heard Obama or the Republican candidates calling for a national investment in hydro-power even though it is hugely efficient. The dreams of the green energy crowd are shattered by the fact that biodiesel, ethanol and solar require as much energy to create as they produce. Tar sands and shale oil aren’t much more energy efficient. It’s too bad Obama and his minions hate dirty coal, because has the best return on energy invested among all the practical sources.   

 File:EROI - Ratio of Energy Returned on Energy Invested - USA.svg

Worse than the peak oil deniers are those who pretend that oil isn’t really that important to our society. They declare that technology will save the day, when in reality technology can’t function without oil. Without plentiful cheap oil our technologically driven civilization crashes. We are addicted to oil. Americans consume petroleum products at a rate of three-and-a-half gallons of oil and more than 250 cubic feet of natural gas per day each.  You might be interested in a partial list of products that require petroleum to be produced.

Solvents Diesel fuel Motor Oil Bearing Grease
Ink Floor Wax Ballpoint Pens Football Cleats
Upholstery Sweaters Boats Insecticides
Bicycle Tires Sports Car Bodies Nail Polish Fishing lures
Dresses Tires Golf Bags Perfumes
Cassettes Dishwasher parts Tool Boxes Shoe Polish
Motorcycle Helmet Caulking Petroleum Jelly Transparent Tape
CD Player Faucet Washers Antiseptics Clothesline
Curtains Food Preservatives Basketballs Soap
Vitamin Capsules Antihistamines Purses Shoes
Dashboards Cortisone Deodorant Footballs
Putty Dyes Panty Hose Refrigerant
Percolators Life Jackets Rubbing Alcohol Linings
Skis TV Cabinets Shag Rugs Electrician’s Tape
Tool Racks Car Battery Cases Epoxy Paint
Mops Slacks Insect Repellent Oil Filters
Umbrellas Yarn Fertilizers Hair Coloring
Roofing Toilet Seats Fishing Rods Lipstick
Denture Adhesive Linoleum Ice Cube Trays Synthetic Rubber
Speakers Plastic Wood Electric Blankets Glycerin
Tennis Rackets Rubber Cement Fishing Boots Dice
Nylon Rope Candles Trash Bags House Paint
Water Pipes Hand Lotion Roller Skates Surf Boards
Shampoo Wheels Paint Rollers Shower Curtains
Guitar Strings Luggage Aspirin Safety Glasses
Antifreeze Football Helmets Awnings Eyeglasses
Clothes Toothbrushes Ice Chests Footballs
Combs CD’s & DVD’s Paint Brushes Detergents
Vaporizers Balloons Sun Glasses Tents
Heart Valves Crayons Parachutes Telephones
Enamel Pillows Dishes Cameras
Anesthetics Artificial Turf Artificial limbs Bandages
Dentures Model Cars Folding Doors Hair Curlers
Cold cream Movie film Soft Contact lenses Drinking Cups
Fan Belts Car Enamel Shaving Cream Ammonia
Refrigerators Golf Balls Toothpaste Gasoline


The propaganda blared at the impressionable willfully ignorant American public has worked wonders. The vast majority of Americans have no clue they have entered a world of energy scarcity, a world where the average person is poorer and barely able to afford the basic necessities of life. This is borne out in the vehicles sales statistics reported every month. There have been 10.5 million passenger vehicles sold through the first 10 months of 2011. In addition to the fact they are “purchased” using 95% debt and financed over seven years, the vast majority are low mileage vehicles getting less than 20 mpg. Only 1.8 million small energy efficient vehicles have been sold versus 6.1 million SUVs, pickup trucks and large luxury automobiles. Americans have the freedom to buy any vehicle they choose. They also have the freedom to not think and ignore the facts about the certainty of higher prices at the pump. By choosing a 20 mpg vehicle over a 40 mpg vehicle, they’ve sealed their fate. How could the average soccer mom get by without a Yukon or Excursion to shuttle Biff and Buffy to their games? Have you ever tried to navigate a soccer field parking lot in a hybrid? The horror!

The American public has been lulled back into a sense of security as gas prices have receded from $4.00 a gallon back to $3.40 a gallon. This lull will be short lived. Oil prices have surged by 15% in the last two months, even as the world economy heads into recession. The link between high oil prices and economic growth are undeniable, even though the deceitful pundits on CNBC will tell you otherwise. Ten out of eleven recessions since World War II were associated with oil price spikes. Gail Tverberg sums up the dilemma of energy scarcity for the average American:

“High-priced oil tends to choke economies because high oil prices are associated with high food prices (because oil products are used in food growing and transport), and people’s salaries do not rise to offset this rise in food and oil prices. People have to eat and to commute to their jobs, so they cut back on other expenditures. This leads to recession. Recession leads to lower oil consumption, since people without jobs can’t buy very much of anything, oil products included. In some sense, the reduction in oil extraction is due to reduced demand, because citizens cannot afford the high-priced oil that is available.”

But don’t worry. The rising oil and food prices will only impact the 99% in the U.S. and the poorest dregs across the globe that spend 70% of their income on food. The 1% will be just fine as they will bet on higher oil prices, therefore further enriching themselves while the peasants starve. The market for caviar, champagne, NYC penthouses, and summer mansions in the Hamptons will remain robust.

There is no escape from the ravages of higher priced oil. There is plenty of oil left in the ground. But, the remaining oil is difficult, slow and expensive to extract. Oil prices will rise because they have to. Without higher prices, who would make the huge capital investment required to extract the remaining oil? Once oil prices reach the $120 to $150 per barrel range our economy chokes and heads into recession. We are trapped in an endless feedback loop of doom. The false storyline of renewable energy saving the day is put to rest by Gail Tverberg:

“Renewables such as wind, solar PV, cellulosic ethanol, and biogas could more accurately be called “fossil fuel extenders” because they cannot exist apart from fossil fuels. Fossil fuels are required to make wind turbines and other devices, to transport the equipment, to make needed repairs, and to maintain the transport and electrical systems used by these fuels (such as maintaining transmission lines, running-back up power plants, and paving roads). If we lose fossil fuels, we can expect to lose the use of renewables, with a few exceptions, such as trees cut down locally, and burned for heat, and solar thermal used to heat hot water in containers on roofs.”

Predictably, the politicians and intellectual elite do the exact opposite of what needs to be done. We need to prepare our society to become more local. Without cheap plentiful oil our transportation system breaks down. Our 3.9 million miles of road networks will become a monument to stupidity as Obama and Congress want to spend hundreds of billions on road infrastructure that will slowly become obsolete. The crumbling infrastructure is already the result of government failure, as the money that should have been spent maintaining our roads, bridges and water systems was spent on train museums, turtle crossings, teaching South African men how to wash their genitalia, studies on the mating habits of ferrets, and thousands of other worthless Keynesian pork programs. If our society acted in a far sighted manner, we would be creating communities that could sustain themselves with local produce, local merchants, bike paths, walkable destinations, local light rail commuting, and local energy sources. The most logical energy source for the U.S. in an oil scarce scenario is electricity, since we have a substantial supply of coal and natural gas for the foreseeable future and the ability to build small nuclear power plants. The Fukushima disaster is likely to kill nuclear as an option until it is too late. The electrical grid should be the number one priority of our leaders, as it would be our only hope in an oil scarce world. Instead, our leaders will plow borrowed money into ethanol, solar, and shale oil drilling, guaranteeing a disastrous scenario for our country.

The United States is a country built upon the four C’s: Crude, Cars, Credit, and Consumption. They are intertwined and can’t exist without crude as the crucial ingredient. As the amount of crude available declines and the price rises, the other three C’s will breakdown. Our warped consumer driven economy collapses without the input of cheap plentiful oil. Those at the top levels of government realize this fact. It is not a coincidence that the War on Terror is the current cover story to keep our troops in the Middle East. It is not a coincidence the uncooperative rulers (Hussein, Gaddafi) of the countries with the 5th and 9th largest oil reserves on the planet have been dispatched. It is not a coincidence the saber rattling grows louder regarding the Iranian regime, as they sit atop 155 billion barrels of oil, the 4th largest reserves in the world. It should also be noted the troops leaving Iraq immediately began occupying Kuwait, owner of the 6th largest oil reserves on the planet. Oil under the South China Sea and in the arctic is being hotly pursued by the major world players. China and Russia are supporting Iran in their showdown with Israel and the U.S. As the world depletes the remaining oil, conflict and war are inevitable. The term Energy Independence will carry a different meaning than the one spouted by mindless politicians as the oil runs low.

And as things fell apart
Nobody paid much attention

Nothing but Flowers – The Talking Heads