David Stockman on How The Fed Wrecked The Dream Of Homeownership

Guest Post by David Stockman

Recently, the Wall Street Journal pulled no punches with respect to the soaring cost of homeownership:

Homeownership has become a pipe dream for more Americans, even those who could afford to buy just a few years ago……it is now less affordable than any time in recent history to buy a home, and the math isn’t changing any time soon…… That means buyers get a lot less home for their dollar. Before the Fed started raising rates, a person with a monthly housing budget of $2,000 could have bought a home valued at more than $400,000. Today, that same buyer would need to find a home valued at $295,000 or less.

And, yes, you can blame the Fed for this baleful state of affairs, but not owing to the normal complaint that mortgage rates are too high.  Nor could the problem be remedied by government-imposed mortgage interest rate caps.

Actually, true mortgage rates are still sub-normal. What is way too high are home prices, and that condition is absolutely attributable to decades of interest rate repression, which is now taking a second bite of the apple owing to a severe, cheap-mortgage “lock-in” effect that is keeping millions of homes off the market.

Continue reading “David Stockman on How The Fed Wrecked The Dream Of Homeownership”

The Cost of Home ownership in the US Spiked 91% in Two Years

Guest Post by Martin Armstrong

The US housing market has not been this unaffordable since 1984, a new study finds. Analysts at Black Knight analyzed home prices, income, and interest rates on a monthly basis going back to 1975 and found that the average mortgage today would cost $2,423 per month on a 30-year fixed with 20% down. This marks a 91% increase in housing costs over the past two years alone.

Continue reading “The Cost of Home ownership in the US Spiked 91% in Two Years”

BUILDING FOR A NATION OF RENTERS

Guest Post by Doctor Housing Bubble

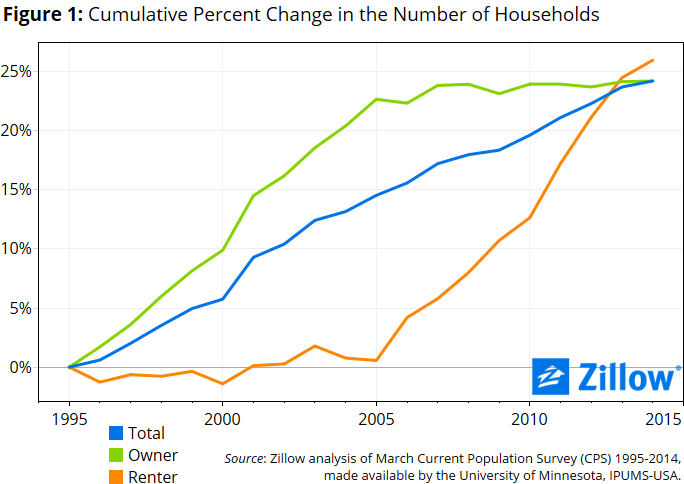
What a difference a decade can make.  Over the last two decades the number of U.S. households has grown by 25 percent.  But the growth has come in two distinctive waves.  Between 1995 and 2005 nearly all of this growth came in the form of new homeowners.  However, the subsequent decade saw something very different.  Most of household growth between 2005 and 2015 has come in the form of renter households.  It should come as no surprise that new home buying still remains weak.  With this new trend unfolding, it shouldn’t come as a shock that multi-unit permits are surging as builders place their bets on rental Armageddon.  While a few people can’t wait to dive into mega debt for a crap shack, others are simply renting either out of necessity or by choice.  In fact, renting over the last decade has been the choice many have made (out of necessity or free will) contrary to the crap shack enthusiasts trying to talk up their poorly built piece of junk as some kind of diamond in the rough.  Builders with deep pockets are betting on a continuation of the rental trend.  It should also be no surprise that this decade saw a major surge of the “single family home” as rental unit.

Two decades with two different stories

We have witnessed continued household growth in the U.S.  Household formation has increased by 25 percent over the last 20 years.  However, each half of the last 20 years has seen growth come from two very distinct categories.

The homeownership boom followed by the renter boom:

Figure1-7d15f9

Continue reading “BUILDING FOR A NATION OF RENTERS”

LIES, DAMNED LIES & STATISTICS

The government released their monthly CPI report this week. Even though it came in at an annualized rate of 3.6%, they and their mouthpieces in the corporate mainstream media dutifully downplayed the uptrend. They can’t let the plebs know the truth. That might upend their economic recovery storyline and put a crimp into their artificial free money, zero interest rate, stock market rally. If they were to admit inflation is rising, the Fed would be forced to raise rates. That is unacceptable in our rigged .01% economy. There are banker bonuses, CEO stock options, corporate stock buyback earnings per share goals and captured politician elections at stake.

The corporate MSM immediately shifted the focus to the annual CPI figure of 0.1%. That’s right. Your government keepers expect you to believe the prices you pay to live your everyday life have been essentially flat in the last year. Anyone who lives in the real world, not the BLS Bizarro world of models, seasonal adjustments, hedonic adjustments, and substitution adjustments, knows this is a lie. The original concept of CPI was to measure the true cost of maintaining a constant standard of living. It should reflect your true inflation of out of pocket costs to live a daily existence in this country.

Instead, it has become a manipulated statistic using academic theories as a cover to systematically under-report the true level of inflation. The purpose has been to cut annual cost of living adjustments to Social Security and other government benefits, while over-estimating the true level of GDP. Artificially low inflation figures allow the mega-corporations who control the country to keep wage increases to workers low. Under-reporting the true level of inflation also allows the Federal Reserve to keep their discount rate far lower than it would be in an honest free market. The Wall Street banks, who own and control the Federal Reserve, are free to charge 18% on credit card balances while paying .25% to savers. The manipulation of the CPI benefits the vested interests, impoverishes the masses, and slowly but surely contributes to the destruction of our economic system.

A deep dive into Table 2 from the BLS reveals some truth and uncovers more lies. Their weighting of everyday living expenditures is warped and purposefully misleading. Let’s look at the annual increases in some food items we might consume in the course of a month, living in this empire of lies:

  • Ground Beef – 10.1%
  • Roast Beef – 11.8%
  • Steak – 11.1%
  • Eggs – 21.8%
  • Chicken – 3.7%
  • Coffee – 3.4%
  • Sugar – 4.2%
  • Candy – 4.6%
  • Snacks – 3.5%
  • Salt & Seasonings – 5.3%
  • Food Away From Home – 3.0%

Continue reading “LIES, DAMNED LIES & STATISTICS”

RENTERS R US

About that housing recovery. The U.S. population has grown by 8% since 2005, while the number of households has grown by 5%. In addition to the weak overall household growth, due to stagnant wages, massive student loan debt, and only Obama shit service jobs, there have been no new owner occupied households. The number of owner occupied households is down 1%, while the number of rental households has soared by 16%.

The home ownership rate is now at a two decade low and sits at the same level it did in 1970, before Nixon closed the gold window and unleashed a debt and inflation tsunami upon our nation. The Federal Reserve solution to every bubble they create is to print enough to create another bubble. They have expanded their balance sheet by almost 600% since 2008, and have succeeded in crushing the middle class, senior citizens, and young people who should be buying their first homes.


Continue reading “RENTERS R US”