PERFECT STORMS

Guest Post by John Mauldin

Perfect Storms

Having been Puerto Rico residents for almost three years now, Shane and I have learned a few things about living in the tropics. In Dallas, we didn’t often think about hurricanes, though we did have tornadoes and severe thunderstorms. Ditto for earthquakes. North Texas is pretty stable, geologically speaking.

Now hurricanes and earthquakes are part of normal life. We expect them to happen, and indeed they have happened since we came here. They weren’t too bad but could have been much worse. So, we have plans and precautions to deal with them, as does everyone else here. Last year, a hurricane came through and decided to drench the eastern part of the island and simply miss us. We had no wind or rain. But we were prepared, as were our neighbors. It’s just part of life. But then that same storm tragically devastated the Bahamas.

I was thinking about this in connection with my Sandpile letter, which we again reposted recently. Like those fingers of instability, our ability to predict the weather is far less than perfect. Technology can tell us when hurricanes/tropical storms are out there and the general direction they are moving. It’s still far from certain exactly where they will make landfall, and how strong they will be at the time. They can leave one corner of this small island devastated and the rest untouched.

So, the prudent course is to prepare for the worst, hope for the best—a trite saying but in this case it’s true. We would rather be overprepared than caught by surprise.

Investors face hurricanes, too, with even more uncertainty. The storm could hit someone else, or go back out to sea and dissipate. Do you bet everything that it will? I don’t.

Right now, several potentially big storms are brewing. They could be minor annoyances or catastrophic disasters, or anywhere in between. I truly hope they all resolve with minimal fuss. But they may not. They could even combine into a perfect storm of even greater magnitude… so now is the time to prepare.

Continue reading “PERFECT STORMS”

New Home Sales Crash In October – Biggest Plunge Since 2011

Trumpeteers rejoice. “Best Economy Evah!!!”. In case you didn’t notice, the trade deficit also reached and all-time high today, up $14 billion since the Great Orange One ascended to the throne. The housing market is now in the process of a slow motion crash. Prices have just begun to fall. There is another 20% to 30% to go. Thank God Fannie and Freddie came back with those 3% down mortgages. Millions of morons who bought in the last 3 or 4 years will be substantially underwater in their mortgages in no time.

Housing Bubble 2.0 is bursting and the fools, tools, and idiots who were lured into it will be getting a good fucking. All hail Trump and his economy. When the economy and stock market were going up due to his reckless adrenaline corporate tax cut injection, he took full credit. Now that we are headed into recession and a stock market crash he’ll blame the Fed and the Democrats. His Trumpeteers will believe him. Idiots.

Via ZeroHedge

Following the small MoM blip higher in existing home sales (though dismal YoY plunge), new home sales were expected to rebound in October (after plunging 5.5% MoM in September) but instead they utterly collapsed – crashing 8.9% MoM.

https://www.zerohedge.com/sites/default/files/inline-images/2018-11-28_7-01-59.jpg?itok=ySsSFWY3

Continue reading “New Home Sales Crash In October – Biggest Plunge Since 2011”

THE FOURTEEN YEAR RECESSION

 “When a government is dependent upon bankers for money, they and not the leaders of the government control the situation, since the hand that gives is above the hand that takes. Money has no motherland; financiers are without patriotism and without decency; their sole object is gain.”Napoleon Bonaparte

 Click to View

“A great industrial nation is controlled by its system of credit. Our system of credit is privately concentrated. The growth of the nation, therefore, and all our activities are in the hands of a few men … [W]e have come to be one of the worst ruled, one of the most completely controlled and dominated, governments in the civilized world—no longer a government by free opinion, no longer a government by conviction and the vote of the majority, but a government by the opinion and the duress of small groups of dominant men.”Woodrow Wilson

When you ponder the implications of allowing a small group of powerful wealthy unaccountable men to control the currency of a nation over the last one hundred years, you understand why our public education system sucks. You understand why the government created Common Core curriculum teaches children that 3 x 4 = 13, as long as you feel good about your answer. George Carlin was right. The owners of this country (bankers, billionaires, corporate titans, politicians) want more for themselves and less for everyone else. They want an educational system that creates ignorant, obedient, vacuous, obese dullards who question nothing, consume mass quantities of corporate processed fast food, gaze at iGadgets, are easily susceptible to media propaganda and compliant to government regulations and directives. They don’t want highly educated, critical thinking, civil minded, well informed, questioning citizens understanding how badly they have been screwed over the last century. I’m sorry to say, your owners are winning in a landslide.

The government controlled public education system has flourished beyond all expectations of your owners. We’ve become a nation of techno-narcissistic, math challenged, reality TV distracted, welfare entitled, materialistic, gluttonous, indebted consumers of Chinese slave labor produced crap. There are more Americans who know the name of Kanye West and Kim Kardashian’s bastard child (North West) than know the name of our Secretary of State (Ketchup Kerry). Americans can generate a text or tweet with blinding speed but couldn’t give you change from a dollar bill if their life depended upon it. They are whizzes at buying crap on Amazon or Ebay with a credit card, but have never balanced their checkbook or figured out the concept of deferred gratification and saving for the future. While the ignorant masses are worked into a frenzy by the media propaganda machine over gay marriage, diversity, abortion, climate change, and never ending wars on poverty, drugs and terror, our owners use their complete capture of the financial, regulatory, political, judicial and economic systems to pillage the remaining national wealth they haven’t already extracted.

The financial illiteracy of the uneducated lower classes and the willful ignorance of the supposedly highly educated classes has never been more evident than when examining the concept of Federal Reserve created currency debasement – also known as inflation. The insidious central banker created monetary inflation is the cause of all the ills in our warped, deformed, rigged financialized economic system. The outright manipulation and falsity of government reported economic data is designed to obscure the truth and keep the populace unaware of the deception being executed by the owners of this country. They have utilized deceit, falsification, propaganda and outright lies to mislead the public about the true picture of the disastrous financial condition in this country. Since most people are already trapped in the mental state of normalcy bias, it is easy for those in control to reinforce that normalcy bias by manipulating economic data to appear normal and using their media mouthpieces to perpetuate the false storyline of recovery and a return to normalcy.

This is how feckless politicians and government apparatchiks are able to add $2.8 billion per day to the national debt; a central bank owned by Too Big To Trust Wall Street banks has been able to create $3.3 trillion out of thin air and pump it into the veins of its owners; and government controlled agencies report a declining unemployment rate, no inflation and a growing economy, without creating an iota of dissent or skepticism from the public. Americans want to be lied to because it allows them to continue living lives of delusion, where spending more than you make, consuming rather than saving, and believing stock market speculation and home price appreciation will make them rich are viable life strategies. Even though 90% of the population owns virtually no stocks, they are convinced record stock market highs are somehow beneficial to their lives. They actually believe Bernanke/Yellen when they bloviate about the dangers of deflation. Who would want to pay less for gasoline, food, rent, or tuition?

Unless you are beholden to the oligarchs, that sense of stress, discomfort, feeling that all in not well, and disturbing everyday visual observations is part of the cognitive dissonance engulfing the nation. Anyone who opens their eyes and honestly assesses their own financial condition, along with the obvious deterioration of our suburban sprawl retail paradise infrastructure, is confronted with information that is inconsistent with what they hear from their bought off politician leaders, highly compensated Ivy League trained economists, and millionaire talking heads in the corporate legacy media. Most people resolve this inconsistency by ignoring the facts, rejecting the obvious and refusing to use their common sense. To acknowledge the truth would require confronting your own part in this Ponzi debt charade disguised as an economic system. It is easier to believe a big lie than think critically and face up to decades of irrational behavior and reckless conduct.

What’s In Your GDP                          

“The Gross Domestic Product (GDP) is one of the broader measures of economic activity and is the most widely followed business indicator reported by the U.S. government. Upward growth biases built into GDP modeling since the early 1980s, however, have rendered this important series nearly worthless as an indicator of economic activity.  The popularly followed number in each release is the seasonally adjusted, annualized quarterly growth rate of real (inflation-adjusted) GDP, where the current-dollar number is deflated by the BEA’s estimates of appropriate price changes. It is important to keep in mind that the lower the inflation rate used in the deflation process, the higher will be the resulting inflation-adjusted GDP growth.”John Williams – Shadowstats

GDP is the economic statistic bankers, politicians and media pundits use to convince the masses the economy is growing and their lives are improving. Therefore, it is the statistic most likely to be manipulated, twisted and engineered in order to portray the storyline required by the oligarchs. Two consecutive quarters of negative GDP growth usually marks a recession. Those in power do not like to report recessions, so data “massaging” has been required over the last few decades to generate the required result. Prior to 1991 the government reported the broader GNP, which includes the GDP plus the balance of international flows of interest and dividend payments. Once we became a debtor nation, with massive interest payments to foreigners, reporting GNP became inconvenient. It is not reported because it is approximately $900 billion lower than GDP. The creativity of our keepers knows no bounds. In July of 2013 the government decided they had found a more “accurate” method for measuring GDP and simply retroactively increased GDP by $500 billion out of thin air. It’s amazing how every “more accurate” accounting adjustment improves the reported data. The economic growth didn’t change, but GDP was boosted by 3%. These adjustments pale in comparison to the decades long under-reporting of inflation baked into the GDP calculation.

As John Williams pointed out, GDP is adjusted for inflation. The higher inflation factored into the calculation, the lower reported GDP. The deflator used by the BEA in their GDP calculation is even lower than the already bastardized CPI. According to the BEA, there has only been 32% inflation since the year 2000. They have only found 1.4% inflation in the last year and only 7.1% in the last five years. You’d have to be a zombie from the Walking Dead or an Ivy League economist to believe those lies. Anyone living in the real world knows their cost of living has risen at a far greater rate. According to the government, and unquestioningly reported by the compliant co-conspirators in the the corporate media, GDP has grown from $10 trillion in 2000 to $17 trillion today. Even using the ridiculously low inflation BEA adjustment yields an increase from $12.4 trillion to only $15.9 trillion in real terms. That pitiful 28% growth over the last fourteen years is dramatically overstated, as revealed in the graph below. Using a true rate of inflation exposes the grand fraud being committed by those in power. The country has been in a never ending recession since 2000.   

Your normalcy bias is telling you this is impossible. Your government tells you we have only experienced a recession from the third quarter of 2008 through the third quarter of 2009. So despite experiencing two stock market crashes, the greatest housing crash in history, and a worldwide financial system implosion the authorities insist  we’ve had a growing economy 93% of the time over the last fourteen years. That mental anguish you are feeling is the cognitive dissonance of wanting to believe your government, but knowing they are lying. It is a known fact the government, in conspiracy with Greenspan, Congress and academia, have systematically reduced the reported CPI based upon hedonistic quality adjustments, geometric weighting alterations, substitution modifications, and the creation of incomprehensible owner’s equivalent rent calculations. Since the 1700s consumer inflation had been estimated by measuring price changes in a fixed-weight basket of goods, effectively measuring the cost of maintaining a constant standard of living. This began to change in the early 1980s with the Greenspan Commission to “save” Social Security and came to a head with the Boskin Commission in 1995.

Simply stated, the Greenspan/Boskin Commissions’ task was to reduce future Social Security payments to senior citizens by deceitfully reducing CPI and allowing politicians the easy way out. Politicians would lose votes if they ever had to directly address the unsustainability of Social Security. Therefore, they allowed academics to work their magic by understating the CPI and stealing $700 billion from retirees in the ten years ending in 2006. With 10,000 baby boomers per day turning 65 for the next eighteen years, understating CPI will rob them of trillions in payments. This is a cowardly dishonest method of extending the life of Social Security.

If CPI was calculated exactly as it was computed prior to 1983, it would have averaged between 5% and 10% over the last fourteen years. Even computing it based on the 1990 calculation prior to the Boskin Commission adjustments, would have produced annual inflation of 4% to 7%. A glance at an inflation chart from 1872 through today reveals the complete and utter failure of the Federal Reserve in achieving their stated mandate of price stability. They have managed to reduce the purchasing power of your dollar by 95% over the last 100 years. You may also notice the net deflation from 1872 until 1913, when the American economy was growing rapidly. It is almost as if the Federal Reserve’s true mandate has been to create inflation, finance wars, perpetuate the proliferation of debt, artificially create booms and busts, enrich their Wall Street owners, and impoverish the masses. Happy Birthday Federal Reserve!!!

 Click to View

When you connect the dots you realize the under-reporting of inflation benefits the corporate fascist surveillance state. If the government was reporting the true rate of inflation, mega-corporations would be forced to pay their workers higher wages, reducing profits, reducing corporate bonuses, and sticking a pin in their stock prices. The toady economists at the Federal Reserve would be unable to sustain their ludicrous ZIRP and absurd QEfinity stock market levitation policies. Reporting a true rate of inflation would force long-term interest rates higher. These higher rates, along with higher COLA increases to government entitlements, would blow a hole in the deficit and force our spineless politicians to address our unsustainable economic system. There would be no stock market or debt bubble. If the clueless dupes watching CNBC bimbos and shills on a daily basis were told the economy has been in fourteen year downturn, they might just wake up and demand accountability from their leaders and an overhaul of this corrupt system.          

Mother Should I Trust the Government?

We know the BEA has deflated GDP by only 32% since 2000. We know the BLS reports the CPI has only risen by 37% since 2000. Should I trust the government or trust the facts and my own eyes? The data is available to see if the government figures pass the smell test. If you are reading this, you can remember your life in 2000. Americans know what it cost for food, energy, shelter, healthcare, transportation and entertainment in 2000, but they unquestioningly accept the falsified inflation figures produced by the propaganda machine known as our government. The chart below is a fairly comprehensive list of items most people might need to live in this world. A critical thinking individual might wonder how the government can proclaim inflation of 32% to 37% over the last fourteen years, when the true cost of living has grown by 50% to 100% for most daily living expenses. The huge increases in property taxes, sales taxes, government fees, tolls and income taxes aren’t even factored in the chart. It seems gold has smelled out the currency debasement and the lies of our leaders. This explains the concerted effort by the powers that be to suppress the price of gold by any means necessary.   

Living Expense

Jan-00

Mar-14

% Increase

Gallon of gas

$1.27

$3.51

176.4%

Barrel of oil

$24.11

$100.00

314.8%

Fuel oil per gallon

$1.19

$4.07

242.0%

Electricity per Kwh

$0.084

$0.134

59.5%

Gas per therm

$0.712

$1.078

51.4%

Dozen eggs

$0.97

$2.00

106.2%

Coffee per lb

$3.40

$5.20

52.9%

Ground Beef per lb.

$1.90

$3.73

96.3%

Postage stamp

$0.33

$0.49

48.5%

Movie ticket

$5.25

$10.25

95.2%

New car

$20,300.00

$31,500.00

55.2%

Annual healthcare spending per capita

$4,550.00

$9,300.00

104.4%

Average private college tuition

$22,000.00

$37,000.00

68.2%

Avg home price (Case Shiller)

$161,000.00

$242,000.00

50.3%

Avg monthly rent (Case Shiller)

$635.00

$890.00

40.2%

Ounce of gold

$279.00

$1,334.00

378.1%

Mother, you should not trust the government. There is no doubt they have systematically under-reported inflation based on any impartial assessment of the facts. The reality that we remain stuck in a fourteen year recession is borne out by the continued decline in vehicle miles driven (at 1995 levels) due to declining commercial activity, the millions of shuttered small businesses, and the proliferation of Space Available signs in strip malls and office parks across the land. The fact there are only 8 million more people employed today than were employed in 2000, despite the working age population growing by 35 million, might be a clue that we remain in recession. If that isn’t enough proof for you, than maybe a glimpse at real median household income, retail sales and housing will put the final nail in the coffin of your cognitive dissonance.

The government and their media mouthpieces expect the ignorant masses to believe they have advanced their standard of living, with median household income growing from $40,800 to $52,500 since 2000. But, even using the badly flawed CPI to adjust these figures into real terms reveals real median household income to be 7.3% below the level of 2000. Using a true inflation figure would cause a CNBC talking head to have an epileptic seizure.        

Click to View

The picture is even bleaker when broken down into the age of households, with younger households suffering devastating real declines in household income since 2000. I guess all those retail clerk, cashier, waitress, waiter, food prep, and housekeeper jobs created over the last few years aren’t cutting the mustard. Maybe that explains the 30 million increase (175% increase) in food stamp recipients since 2000, encompassing 19% of all households in the U.S. Luckily the banking oligarchs were able to convince the pliable masses to increase their credit card, auto and student loan debt from $1.5 trillion to $3.1 trillion over the fourteen year descent into delusion.

When you get your head around this unprecedented decline in household income over the last fourteen years, along with the 50% to 100% rise in costs to live in the real world, as opposed to the theoretical world of the Federal Reserve and BLS, you will understand the long term decline in retail sales reflected in the following chart. When you adjust monthly retail sales for gasoline (an additional tax), inflation (understated), and population growth, you understand why retailers are closing thousands of stores and hurdling towards inevitable bankruptcy. Retail sales are 6.9% below the June 2005 peak and 4% below levels reached in 2000. And this is with millions of retail square feet added over this time frame. We know the dramatic surge from the 2009 lows was not prompted by an increase in household income. So how did the 11% proliferation of spending happen?

Click to View

The up swell in retail spending began to accelerate in late 2010. Considering credit card debt outstanding is at exactly where it was in October 2010, it seems consumers playing with their own money turned off the spigot of speculation. It has been non-revolving debt that has skyrocketed from $1.63 trillion in February 2010 to $2.26 trillion today. This unprecedented 39% rise in four years has been engineered by the government, using your tax dollars and the tax dollars of unborn generations. The Federal government has complete control of the student loan market and with their 85% ownership of Ally Financial, the largest auto financing company, a dominant position in the auto loan market. The peddling of $400 billion of subprime student loan debt and $200 billion of subprime auto loan debt has created the illusion of a retail recovery. The student loan debt has been utilized by University of Phoenix MBA wannabes  to buy iGadgets, the latest PS3 version of Grand Theft Auto and the latest glazed donut breakfast sandwich on the market. It’s nothing but another debt financed bubble that will end in tears for the American taxpayer, as hundreds of billions will be written off.

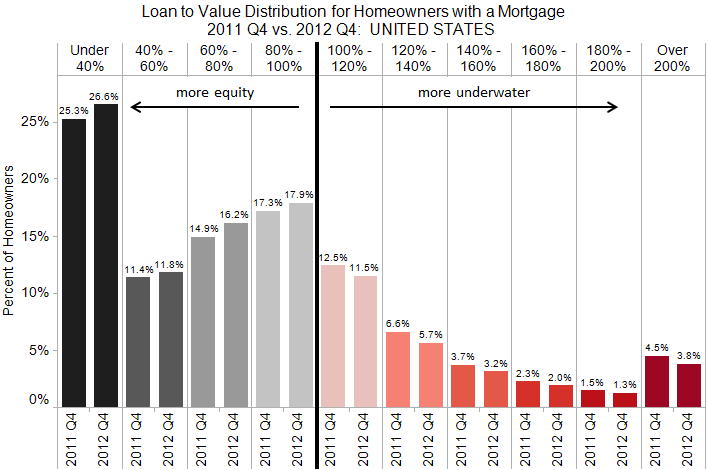
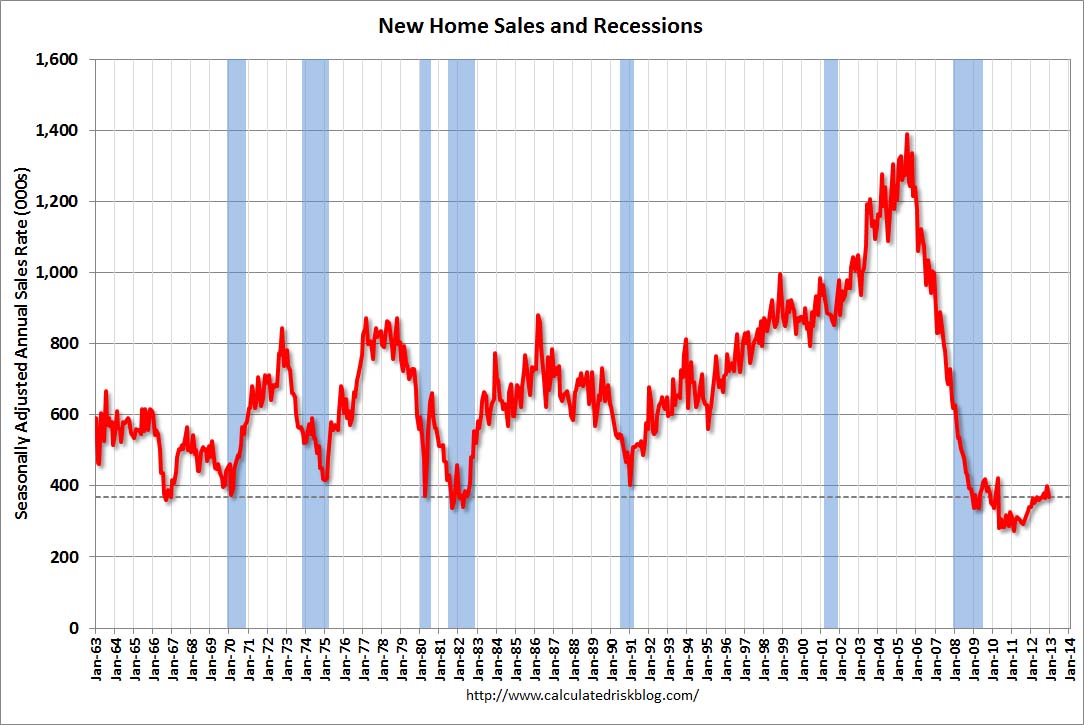
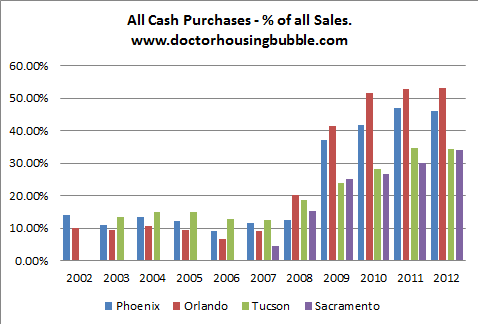
The fake retail recovery pales in comparison to the wolves of Wall Street produced housing recovery sham. They deserve an Academy Award for best fantasy production. The Federal Reserve fed Wall Street hedge fund purchase of millions of foreclosed shanties across the nation has produced media proclaimed home price increases of 10% to 30% in cities across the country. Withholding foreclosures from the market and creating artificial demand with free money provided by the Federal Reserve has temporarily added $4 trillion of housing net worth and reduced the number of underwater mortgages on the books of the Too Big To Trust Wall Street banks. The percentage of investor purchases and cash purchases is at all-time highs, while the percentage of first time buyers is at all-time lows. Anyone with an ounce of common sense can look at the long-term chart of mortgage applications and realize we are still in a recession. Applications are 35% below levels at the depths of the 2008/2009 recession. Applications are 65% below levels at the housing market peak in 2005. They are even 35% below 2000 levels. There is no real housing recovery, despite the propaganda peddled by the NAR, CNBC, and Wall Street. It’s a fraud.   

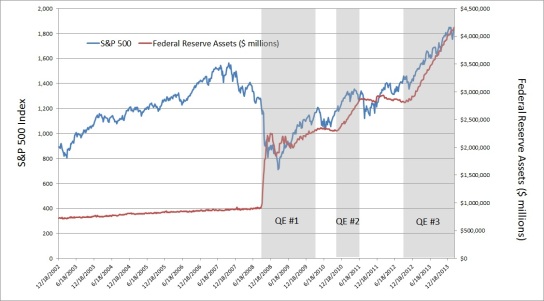
It is the pinnacle of arrogance and hubris that a few Ivy League educated economists sitting in the Marriner Eccles Building in the swamps of Washington D.C., who have never worked a day in their lives at a real job, think they can create wealth and pull the levers of money creation to control the American and global financial systems. All they have done is perfect the art of bubble finance in order to enrich their owners at the expense of the rest of us. Their policies have induced unwarranted hope and speculation on a grand scale. Greenspan and Bernanke have provoked multiple bouts of extreme speculation in stocks and housing over the last 15 years, with the subsequent inevitable collapses. Fed encouraged gambling does not create wealth it just redistributes it from the peasants to the aristocracy. The Fed has again produced an epic bubble in stock and bond valuations which will result in another collapse. Normalcy bias keeps the majority from seeing the cliff straight ahead. Federal Reserve monetary policies have distorted financial markets, created extreme imbalances, encouraged excessive risk taking, and ruined the lives of working class people. Take a long hard look at the chart below and answer one question. Was QE designed to benefit Main Street or Wall Street?  

The average American has experienced a fourteen year recession caused by the monetary policies of the Federal Reserve. Our leaders could have learned the lesson of two Fed induced collapses in the space of eight years and voluntarily abandoned the policies of reckless credit expansion, instead embracing policies encouraging saving, capital investment and balanced budgets. They have chosen the same cure as the disease, which will lead to crisis, catastrophe and collapse.  

“There is no means of avoiding the final collapse of a boom brought about by credit expansion. The alternative is only whether the crisis should come sooner as the result of voluntary abandonment of further credit expansion, or later as a final and total catastrophe of the currency system involved.” – Ludwig von Mises


IT’S ALWAYS THE BEST TIME TO BUY

“The continuing shortages of housing inventory are driving the price gains. There is no evidence of bubbles popping.”David Lereah, NAR mouthpiece/economist – August 2005

“The steady improvement in home sales will support price appreciation despite all the wild projections by academics, Wall Street analysts, and others in the media.” David Lereah, NAR mouthpiece/economist – January 10, 2007

“Buyer traffic is continuing to pick up, while seller traffic is holding steady. In fact, buyer traffic is 40 percent above a year ago, so there is plenty of demand but insufficient inventory to improve sales more strongly. We’ve transitioned into a seller’s market in much of the country. We expect a seasonal rise of inventory this spring, but it may be insufficient to avoid more frequent incidences of multiple bidding and faster-than-normal price growth.” – Lawrence Yun – NAR mouthpiece/economist – February 21, 2013

I really need to stop being so pessimistic. I’m getting richer by the day. My home value is rising at a rate of 1% per month according to the National Association of Realtors. At that rate, my house will be worth $1 million in less than 10 years. My underwater condo (figuratively – not literally) in Wildwood will resurface and make me rich beyond my wildest dreams. Larry Yun, the brilliant economic genius employed by the upstanding and truth telling NAR, reported that median home prices soared by 12.3% in January (down 3.7% from December) over the prior year and there is virtually no inventory left to sell – with a mere 1.75 million homes in inventory – the lowest level since 1999. The median sales price of $173,600 is up “dramatically” from last year’s $154,500 level. I’m sure the NAR meant to mention that home prices are still down 25% from the 2005 high of $230,000. Every mainstream media newspaper, magazine, and news channel is telling me the “strong” housing recovery is propelling the economy and creating millions of new jobs. Keynesian economists, Wall Street bankers, government apparatchiks and housing trade organizations are all in agreement that the wealth effect from rising home prices will be the jumpstart our economy needs to get back to the glory days of 2005. Who am I to argue with such honorable men with degrees from Ivy League schools and a track record of unquestioned accuracy as we can see in the chart below? 


Mr. Lereah added to his sterling reputation with his insightful prescient book Why the Real Estate Boom Will Not Bust—And How You Can Profit from It, which was published in February 2006. I understand Ben Bernanke has a signed copy on his nightstand. According to David, he voluntarily decided to leave the NAR in mid-2007 as home prices began their 40% plunge over the next four years. He then admitted in an interview with Money Magazine in 2009 that he was nothing but a shill for the real estate industry, no different than a whore doing tricks for $20. Except he was whoring himself for millions of dollars and contributing to the biggest financial fraud in world history:

“I was pressured by executives to issue optimistic forecasts — then was left to shoulder the blame when things went sour. I was there for seven years doing everything they wanted me to. I worked for an association promoting housing, and it was my job to represent their interests. If you look at my actual forecasts, the numbers were right in line with most forecasts. The difference was that I put a positive spin on it. It was easy to do during boom times, harder when times weren’t good. I never thought the whole national real estate market would burst.”

After Mr. Lereah slithered away from his post he was replaced by the next snake – Lawrence Yun. He proceeded to put the best face possible on the greatest housing collapse in recorded history, assuring the public it was the best time to buy during the entire slide. Five million foreclosures later he’s still telling us it’s the best time to buy. Why shouldn’t we believe the National Association of Realtors and the mainstream media that report their propaganda as indisputable fact? These noble realtooors only have the best interests of their clients at heart. Remember when they warned people about the dangers of liar loans, negative amortization loans, appraisal fraud, nefarious mortgage brokers, criminal bankers, corrupt ratings agencies and the fact that home prices had reached a high two standard deviations above the normal trend? Oh yeah. They didn’t make a peep. They disputed and ridiculed Robert Shiller and anyone else who dared question the healthy “strong” housing market storyline. In late 2011 this superb, above board, truth telling organization admitted what many financial analysts and “crazy” bloggers had been pointing out for years. They were lying about home sales. Their data was false. Between 2007 and 2010, the NAR reported 2.95 million more home sales than had actually occurred. This was not a rounding error. This was not a flaw in their methodology, as they claimed. It was an outright fraudulent attempt to convince the public that the housing market was not in free fall. These guys make the BLS look accurate and above board.   


We are now expected to believe their monthly reports as if they are gospel. The mainstream media continues to report their drivel about the lowest inventory level in 14 years without the slightest hint of skepticism.

The Incredible Shrinking Inventory

We are told by good old Larry Yun that there are only 1.74 million homes left for sale in this country and at current sales rates we’ll run out of inventory in 4.2 months. Oh the horror. You better buy now, before it’s too late. We must be running out of houses. Someone call Bob Toll. We need more houses built ASAP, before this becomes a crisis. But there seems to be problem with this storyline. Existing home sales are falling. Even using the NAR seasonally manipulated numbers, sales in January were lower than in November. In a country with 133 million housing units, there were 291,000 existing home sales in January. If there is an inventory shortage, why have new home sales fallen every month since May of 2012? There were a total of 10,000 completed new homes sold in December in the entire country. Housing starts plunged by 8.5% in January. Does this happen when you have a strong housing market? Do you believe the NAR inventory figure of 1.74 million homes for sale? The last time the months of supply was this low was early 2005 – during the good old days.


Let’s examine a few facts to determine the true nature of this shocking inventory shortage. According to the U.S. Census Bureau:

  • There are 133 million housing units in the United States
  • There are 115 million occupied housing units in the country, with 75 million owner occupied and 40 million renter occupied.
  • For the math challenged this means that 13.5%, or 18 million housing units, are vacant.
  • Only 4.3 million are considered summer homes, and 3.9 million are available for rent. That leaves 9.8 million homes completely vacant.
  • The Census Bureau specifically identifies 1.6 million of these vacant housing units as up for sale.

So, with 9.8 million vacant housing units in the country and 1.6 million of these identified as for sale, the NAR and media mouthpieces have the balls to report only 1.74 million homes for sale in the entire U.S. This doesn’t even take into account the massive shadow inventory stuck in the foreclosure pipeline. Of the 75 million owner-occupied housing units in the country, 50 million have a mortgage. Of these houses, a full 10.9% are either delinquent or in the foreclosure process. This totals 5.4 million households, with 1.9 million of these households already in the foreclosure process. The number of distressed households is still double the long-term average, even with historically low mortgage rates, multiple government mortgage relief programs (HARP), and Fannie, Freddie and the FHA guaranteeing 90% of all mortgages. Do you think the NAR is including any of these 5.4 million distressed houses in their inventory numbers?


Then we have the little matter of a few home occupiers still underwater on their mortgages. After this fabulous two year housing recovery touted by shills and shysters, only 27.5% of ALL mortgage holders are underwater on their mortgage. This means 13.8 million households are in a negative equity position. Those with 5% or less equity are effectively underwater since closing costs usually exceed 6% of the house’s value. That adds another 2.2 million households to the negative equity bucket. Do you think any of these 16 million households would be selling if they could?  

U.S. homeowners with a mortgage are slowly gaining equity back in their homes. 

The negative equity position of millions of homeowners gets at the gist of the effort to re-inflate the housing bubble. By artificially pumping up home prices, the Wall Street titans and their co-conspirators at the Federal Reserve and Treasury Department are attempting to repair insolvent Wall Street bank balance sheets, lure unsuspecting dupes back into the housing market, reignite the economy through the old stand-by wealth effect, and of course enrich themselves and their crony capitalist friends. The artificial suppression of home inventory has been working wonders, as 2 million homeowners were freed from negative equity in 2012. If they can only lure enough suckers back into the pool, all will be well. Phoenix must have an inordinate number of chumps with home prices rising by 22.5% in 2012 as investors and flippers poured into the market with cheap debt and big dreams. Of course everything is relative, as prices are still down 44% from the peak and 40% of mortgages remain underwater. I strongly urge everyone without a functioning brain to pour their life savings into the Phoenix housing market. Larry Yun says it’s a can’t miss path to riches.  

Despite the propaganda, hyperbole, and cheerleading from the corporate media, the fact remains that national homeowner’s equity is barely above its all-time low of 38%, down from 62% in 2000 and 70% in 1980. The NAR shills, Federal Reserve drug pushers, Wall Street shysters, and pliant media lured the middle class into the false belief that housing was an asset class that could make you rich. Homes became the major portion of middle class net worth. As prices were driven higher from 2000 through 2006, the middle class took the bait hook line and sinker and borrowed billions against their ever increasing faux housing wealth. This set up the impending collapse of middle class net worth, created by the 1%ers on Wall Street, in Washington DC, and in corporate executive suites across the land.  The median American household lost 47% of its wealth between 2007 and 2010. Average household wealth, which is skewed dramatically by the richest Americans, declined by only 18%. Real estate only accounts for 30% of the net worth of the rich. For the middle 60%, housing has risen from 62% to 67% of total wealth since 1983. Middle class families’ saw their cash cushion fall from 21% in 1983 to 8% before the crash. They were convinced that living on Wall Street peddled debt was the path to prosperity. After the crash, the middle class has been left with no cash, underwater mortgages, declining real wages, less jobs, and a mountain of credit card debt. Delusions have been crushed. But an on-line degree from the University of Phoenix funded by a Federal student loan of $20,000 will surely revive the fortunes of the average unemployed middle class worker.  


Despite the destruction of middle class hopes, dreams, and net worth, the ruling plutocracy has decided the best way to revive their fortunes is to lure the ignorant masses into more student loan debt, auto debt and mortgage debt.

Don’t Look Behind the Curtain

“The real hopeless victims of mental illness are to be found among those who appear to be most normal. Many of them are normal because they are so well adjusted to our mode of existence, because their human voice has been silenced so early in their lives that they do not even struggle or suffer or develop symptoms as the neurotic does. They are normal not in what may be called the absolute sense of the word; they are normal only in relation to a profoundly abnormal society. Their perfect adjustment to that abnormal society is a measure of their mental sickness. These millions of abnormally normal people, living without fuss in a society to which, if they were fully human beings, they ought not to be adjusted.” Aldous Huxley – Brave New World Revisited


What is normal in a profoundly abnormal, manipulated, propaganda driven society? The NAR and Federal government issue their public relations announcements every month and attempt to spin straw into gold. The media then fulfill their assigned role by touting the results as unequivocal proof of an economic recovery. This is all designed to revive the animal spirits of the clueless public. Statistics in the hands of those who have no regard for the truth can be manipulated to portray any storyline that serves their corrupt purposes. When I see a story about the housing market referencing a percentage increase as proof of a recovery I know it’s time to check the charts. You see, even a fractional increase from an all-time low will generate an impressive percentage increase. So let’s go to the charts in search of this blossoming housing recovery.

The media, NAHB, and certain bloggers look at this chart and declare that new home sales are up 20% from 2011 levels. Sounds awesome. I look at this chart and note that 2011 was the lowest number of new home sales in U.S. history. I look at this chart and note that new home sales are 75% below the peak in 2005. I look at this chart and note that new home sales are lower today than at the bottom of every recession over the last fifty years. I look at this chart and note that new home sales are lower today than they were in 1963, when the population of the United States was a mere 189 million, 40% less than today’s population. Do you see any signs of a strong housing recovery in this chart?    


The housing cheerleaders look at the chart below and crow about a 75% increase in housing starts. I look at this chart and note that housing starts in 2009 were the lowest in recorded U.S. history. I look at this chart and note that total housing starts are down 60% and single family starts are down 70% from 2006 highs. I look at this chart and note the “surge” in housing starts is completely being driven by apartment construction, because the student loan indebted youth can’t afford to buy houses. I look at this chart and note that housing starts are 40% below 1968 levels. Do you see any signs of a strong housing recovery in this chart?   


Those trying to lure the gullible non-thinking masses into paying inflated prices for the “few” houses available for sale declare that existing home sales are up 50% in the last two years. Of course, the 3.3 million low in 2010 was the lowest level in decades. Existing home sales are still 30% below the 2005 high of 7.2 million and the abnormal structure of these home sales is dramatically different than the normal sales of yesteryear.


The wizards behind the curtain don’t want you to understand how the 50% increase in existing home sales has been achieved. They just want you to be convinced that a return to normalcy has happened and it’s the best time to buy. The NAR wizards and the media wizards don’t publicize the composition of these skyrocketing sales. At the end of the NAR “buy a home before it’s too late” monthly press release you find out that distressed homes (foreclosed & short sales) now make up 23% of all home sales and have accounted for well over 30% of all home sales since 2010. Another 28% of home sales are all-cash sales to investors looking to turn them into rental units or flip them for a quick buck. Lastly, 30% of homes are being bought by first time home buyer pansies who have been lured into the market by 3.5% down payment loans through the FHA, with the future losses born by middle class taxpayers who had no say in the matter. Prior to the housing crash, normal buyers who just wanted a place to live, accounted for 90% of all home purchases. Today they make up less than 30% of home buyers. Does this chart portray a normal market or a profoundly abnormal market? Does it portray a healthy housing recovery based upon sound economic fundamentals?      

 all cash buyers

The answer is NO. The contrived elevation of home sales and home prices has been engineered by the very same culprits who crashed our financial system in the first place. This has been planned, coordinated and implemented by a conspiracy of the ruling oligarchy – the Federal Reserve, Wall Street, U.S. Treasury, NAR, and the corporate media conglomerates. Ben’s job was to screw senior citizens and drive interest rates low enough that everyone in the country could refinance, attract investors & flippers into the market, and propel home prices higher. Wall Street has been the linchpin to the whole sordid plan. They were tasked with drastically limiting the foreclosure pipeline, therefore creating a fake shortage of inventory. Next, JP Morgan, Blackrock, Citi, Bank of America, and dozens of other private equity firms have partnered with Fannie Mae and Freddie Mac, using free money provided by Ben Bernanke, to create investment funds to buy up millions of distressed properties and convert them into rental properties, further reducing the inventory of homes for sale and driving prices higher. Only the connected crony capitalists on Wall Street are getting a piece of this action. The Wall Street big hanging dicks have screwed the American middle class coming and going. The NAR and media are tasked with what they do best – spew propaganda, misinform, lie, cheerlead and attempt to create a buying frenzy among the willfully ignorant masses. The chart below reveals the truth about the strong sustainable housing recovery. It doesn’t exist. Mortgage applications by real people who want to live in a home are no higher than they were in 2010 when home sales were 33% lower than today. Mortgage applications are lower than they were in 1997 when 4 million existing homes were sold versus the 5 million pace today. The housing recovery is just another Wall Street scam designed to bilk the American middle class of what remains of their net worth.


The multi-faceted plan to keep this teetering edifice from collapsing is being executed according to the mandates of the financial class:

  • Distribute hundreds of billions in student loans to artificially suppress the unemployment rate, while the BLS adjusts millions more out of the labor force – CHECK
  • Have Ally Financial (80% owned by Obama) and Wall Street banks dole out subprime auto loans to millions and offer 7 year financing at 0%, while GM (Government Motors) channel stuffs its dealers, to create the appearance of an auto recovery – CHECK
  • Drive mortgage rates down, restrict home supply through foreclosure market manipulation, shift the risk of losses to the taxpayer, and allow Wall Street to control the housing market – CHECK
  • Have the corporate mainstream media continuously spout optimistic, positive puff pieces designed to convince an ignorant, apathetic public that the economy is improving, jobs are being created, and housing has recovered – CHECK

Free money, government subsidies, no regulation, Wall Street hubris, get rich quick schemes, media propaganda, and an ignorant public – what could possibly go wrong?   

Here is what could and will go wrong. Everyone in the country that could refinance to a mortgage rate of 4% or lower has done so. Contrary to Bernanke’s rhetoric that “QE to Infinity” would lower mortgage rates, they have just risen to a six month high as the 10 Year Treasury rose 60 basis points from its 2012 low. If mortgage rates just rose to a modest 5% the housing market would come to a grinding halt as no one would trade a 3.5% mortgage for a 5% mortgage. As I’ve detailed earlier, there are 3.9 vacant housing units available for rent. Almost half of the new housing units under construction are apartments. The Wall Street shysters are converting millions of foreclosed homes into rental units. This avalanche of rental properties will depress rents and destroy the modeled ROI calculations of the brilliant Wall Street Ivy league MBAs. These lemmings will all attempt to exit their “investments” at the same time. The FHA is already broke. The mounting losses from their 3.5% down payment to future deadbeats program will force them to curtail this taxpayer financed debacle. There will be few first time home buyers, as young people saddled with a trillion dollars of student loan debt are incapable of buying a home.

These are the facts. But why trust facts when you can believe Baghdad Ben and the NAR? It’s always the best time to buy.

    08-08-12c_baghdad_bob.jpg

“All that said, given the fundamental factors in place that should support the demand for housing, we believe the effect of the troubles in the subprime sector on the broader housing market will likely be limited, and we do not expect significant spillovers from the subprime market to the rest of the economy or to the financial system.  The vast majority of mortgages, including even subprime mortgages, continue to perform well.  Past gains in house prices have left most homeowners with significant amounts of home equity, and growth in jobs and incomes should help keep the financial obligations of most households manageable.” – Ben Bernanke – May 17, 2007