Who Does America Belong to?

Guest Post by Paul Craig Roberts

The housing market is now apparently turning down. Consumer incomes are limited by jobs offshoring and the ability of employers to hold down wages and salaries.  The Federal Reserve seems committed to higher interest rates—in my view to protect the exchange value of the US dollar on which Washington’s power is based.  The arrogant fools in Washington, with whom I spent a quarter century, have, with their bellicosity and sanctions, encouraged nations with independent foreign and economic policies to drop the use of the dollar.  This takes some time to accomplish, but Russia, China, Iran, and India are apparently committed to dropping  or reducing the use of the US dollar.

Continue reading “Who Does America Belong to?”

LIES, LIES & OMG MORE LIES

“There are three types of lies — lies, damn lies, and statistics.” – Benjamin Disraeli

Every month the government apparatchiks at the Bureau of Lies and Scams (BLS) dutifully announces inflation is still running below 2%. Janet Yellen then gives a speech where she notes her concern inflation is too low and she needs to keep interest rates near zero to save humanity from the scourge of too low inflation. I don’t know how I could survive without 2% inflation reducing my purchasing power.

This week they reported year over year inflation of 1.9%. Just right to keep Janet from raising rates and keeping the stock market on track for new record highs. According to our beloved bureaucrats, after they have sliced, diced, massaged and manipulated the data, you’ve experienced annual inflation of 2.1% since 2000. If you believe that, I’ve got a great real estate deal for you in North Korea on the border with South Korea.

Continue reading “LIES, LIES & OMG MORE LIES”

Housing Recovery – Not So Much

Guest Post by Lance Roberts


“Everyone wants a house, and that’s a big problem. 

We’ve noted in the past that there is a substantial issue in the housing market right now. Too few homes are being built for the number of people that want to move into them, thus driving up prices and keeping some lower-end or first-time buyers out of the market.

It is quite amazing that amount of optimism surrounding the housing market which has yet to recover substantially from post-financial crisis lows given the exorbitant amount of monetary stimulants injected into it.

The chart below shows the Total Housing Market Activity Index which is a composite of new and existing home sales, permits and starts. Yes, housing has recovered, but remains well below levels seen in 1999.

Housing-TotalActivity-Index-050416

But let’s not let a trivial matter of data get in the way of a good story.

“Meanwhile, according to the Conference Board, although the share of households planning on buying a home in the next six months ticked down in April to 5.4%, that is significantly above the average of 3.6% recorded since 1978,” wrote Matthew Pointon, property economist at Capital Economics.

Home-Buying-Plans-050416

While individuals may CLAIM they want to buy a home when asked, there is a massive difference between “wanting to do something” and actually being able to do it.

Notice in the chart above that the spike in “home ownership desires” spiked in 2011 and has been steadily climbing since then. Surely, if we have a record number of households planning to buy a home, that should be reflected in the home ownership rate as well.

Home-Ownership-050416

Considering that almost 80% of Americans can’t meet small emergencies, 1-in-5 families have ZERO members employed, and incomes are less than they were in 2000 – the chart above makes a good deal of sense. It is also why we have seen the rise of the “renter nation.” 

Home-RenterNation-050416

Of course, I am assuming that Matt Pointon wasn’t talking about the newest fad in housing for Millennials: The 150-sq. ft. micro-home. 

Collingwood-Shepherd-Hut-Gute-18


Dr. Allan Meltzer’s “Federal Reserve Failures” – Presentation at National Association of Realtors

Guest Post by

Today, I had the privilege of attending a fantastic seminar at the headquarters of the National Association of Realtors by Carnegie-Mellon University economist Dr. Allan Meltzer. The topic? The Federal Reserve and Housing.

Here are portions of his speech.

Federal Reserve Failures
By Allan H. Meltzer

Recently, Stanford Professor John Taylor and I circulated a statement calling on Congress to require the Federal Reserve to choose and adopt a rule—a clearly stated way to make its decisions—that would permit anyone to know what they would do in the future. Our statement was signed by several Nobel Laureates with longstanding interest in and contributions to economic policy. A number of former Fed policymakers and senior staff signed the statement also. Earlier, the House of Representatives adopted the proposal. It could become law. I will forward a copy of the statement on request.

The future is of course obscure and, at times, subject to unpredictable changes. The proposed law permits the Fed to depart from its policy rule temporarily. And the proposed legislation does not impose a specific rule. The Fed chooses the rule it follows, but unlike the present, monetary policy is more disciplined and predictable.

The Federal Reserve has made many large errors in the past. Two well-known examples are the Great Depression of the 1930s and the Great inflation of the 1970s. Recently, the Fed contributed to the Great Recession in 2008 and following. Several recent errors are described here. (Like the policy error of rapidly lowering The Fed Funds Target Rate in 2001 (tech bubble crash) only to start rapidly raising it again in 2004 as home prices were skyrocketing. Adjustable rate mortgages and loans to subprime borrowers both rose rapidly starting in 2003 and home prices peaked as The Fed Funds Target rate peaked in June 2006. The rest is history after the peak).

csfedsub

–The Fed made massive purchases of housing securities to bail out the industry that produced the crisis. Former Chairman Alan Greenspan had warned against and ended purchases of government backed mortgages. The Bernanke-Yellen Fed ignored that advice.

Continue reading “Dr. Allan Meltzer’s “Federal Reserve Failures” – Presentation at National Association of Realtors”

Here’s Why Housing Must Be Propped Up

Submitted by Charles Hugh-Smith of OfTwoMinds blog,

If housing tanks, the last prop under the veneer of middle class wealth collapses.

The Powers That Be have gone to extraordinary lengths to prop up housing by whatever means are necessary since the collapse of the housing bubble in 2008: the Federal Reserve has pushed mortgages rates down by buying mortgage-backed securities, the federal housing agencies (FHA, VA) have issued millions of low-down payment loans, and the federal government has essentially taken over the mortgage industry, backing 90+% of all mortgage loans.

Why is the status quo so keen on propping up housing? If we examine this chart of U.S. and Chinese household assets, we understand why Chinese authorities would be keen to prop up housing values–75% of China’s household assets are in real estate. Meanwhile, U.S. household assets are predominantly financial:

So why are U.S. authorities going all out to prop up housing if it represents such a modest share of total household wealth? I see two dynamics at work.

The majority of household assets are owned by the top 10%, and this includes the majority of financial assets. The top .1% own 22% of all U.S. household wealth, the top 1% own 35% and the top 10% own 75%.

Households below the top 10% may have financial assets such as insurance policies, 401K accounts or pensions funded by employers, but a house is typically the largest store of value the household owns.

Continue reading “Here’s Why Housing Must Be Propped Up”

How Do People in Different Countries Spend Their Money?

Courtesy of: Visual Capitalist

Have you ever wondered how much money Russians spend on alcohol and tobacco compared to the rest of the world? Or how much households in Saudi Arabia allocate to recreation?

Today’s data visualization from The Economist shows how much people in households around the world allocate to different expenses such as food, housing, recreation, transportation, and education.

The first thing to note is that this looks at private spending only, and does not include any public spending that could be allocated to each household. As a result, in places like Canada or the EU, spending on healthcare is much smaller than in comparison to the United States, where households spend 20.9% of their money.

Here’s a few interesting stats:

The Oligarch Recovery: Low Income Americans Can’t Afford To Live In Any Metro Area

Submitted by Mike Krieger via Liberty Blitzkrieg blog,

We were told we needed to bail out Wall Street in order to save Main Street. Well the results are in…

Wall Street has never done better, and Main Street has never done worse.

From the Huffington Post:

Low-income workers and their families do not earn enough to live in even the least expensive metropolitan American communities, according to a new analysis of families’ living costs published Wednesday.


The analysis, released by the left-leaning Economic Policy Institute, is an annual update of the think tank’s Family Budget Calculator that reflects new 2014 data. The Family Budget Calculator is a formula designed to determine the income “required for families to attain a secure yet modest standard of living” in 618 different communities across the country that the U.S. Census Bureau defines as metropolitan areas. The formula uses data collected by the government and some nonprofit groups to measure costs of housing, food, child care, transportation, health care, “other necessities” like clothing, and taxes for families of 10 different compositions in these specific locales.


The updated Family Budget Calculator shows that even the most affordable metropolitan areas in the country are beyond the reach of millions of American families with incomes above the official federal poverty level. The official federal poverty level for a family of two parents and two children in 2014 was $24,008, according to the EPI. But the least expensive metropolitan area in the country for this family type is Morristown, Tennessee, where a family needs an income of $49,114, according to the Economic Policy Institute’s budget calculator.

Continue reading “The Oligarch Recovery: Low Income Americans Can’t Afford To Live In Any Metro Area”

ARE YOU A LEBOWSKI ACHIEVER?

Guest Post by Anthony Sanders

The Failed Middle Class Housing Recovery In One Chart (Maybe A Few More)

True, house prices have been rising across the USA since the housing bubble burst. But the “recovery” has not been equal across income levels. The wealthiest Americans are doing quite well, but America’s middle class has not recovered.

Something happened in late 2008 that has skewed the recovery towards the wealthiest Americans. In part, it was the massive ,monetary intervention policies of The Federal Reserve. In addition, there has been a philosophy in Washington DC of managing the economy through regulation and non-growth policies. For example. the Brookings Institute has a study documenting the decline in business start-ups.

https://confoundedinterest.files.wordpress.com/2015/06/15597061-mmmain.png

The result of The Fed’s massive intervention in financial markets coupled with government policies favoring one group versus another (see George Stigler’s regulatory capture) has resulted in corporate profits after tax growing substantially since 2009 while wage growth is less than half of corporate profit growth.

Continue reading “ARE YOU A LEBOWSKI ACHIEVER?”

U.S. Households Under Pressure: Stagnant Incomes, Rising Basic Expenses

Guest Post by Charles Hugh Smith

How do you support a consumer economy with stagnant incomes for the bottom 90%, rising basic expenses and crashing employment for males ages 25-54? Answer: you don’t.

Frequent contributor B.C. passed along a sobering set of charts that provide context for How The Average U.S. Consumer Spends Their Paycheck. The basic story is well-known to the bottom 90%: most of the household income goes to taxes, housing, food and transportation, with healthcare and insurance, pensions and retirement contributions rounding out the big-ticket items. (Higher education is, as we all know, paid with student loans by all but the top-tier of families.)

Here’s the question this raises: is the sliver that’s left enough to support a $17 trillion consumer economy? The answer is obvious: no.

Stagnant household income has a number of systemic causes, including the generational decline of full-time employment (A Rising Share of Young Adults Live in Their Parents’ Home) and the concentration of wage gains in the top 10%. These dynamics are not easily addressed, for the simple yet profound reason that the amount of human labor that generates a meaningful profit in a stagnant, over-indebted, financialized economy is declining.

The only way most enterprises can sustainably earn a profit is to offload costly human labor (with its immense burdens of healthcare, pensions, workers compensation, disability insurance, etc., and the heavy regulatory burdens of workplace rules) and replace it with networked software and smart machines.

The types of human labor that generate hefty profits are increasingly scarce, and as a result entry-level pay and employment are both capped by the high costs of human labor (even at minimum wage) and the relatively meager profits generated by conventional labor.

Most of the big profits are generated not by labor but by financialization, stock buybacks and other financial gaming of debt and leverage.

The few areas of human labor that generate hefty profits are either in the protected fiefdoms of state-enforced cartels, or in financial services (i.e. those playing the financial games with debt and leverage) or those creating the software and machinery that replaces costly human labor.

Here are B.C.’s comments on the data:

Nearly half of disposable income is spent on housing and food.

More than 50% of disposable household income is spent on housing and transportation (overwhelmingly autos).

25% of disposable income is spent on autos and health care.

Two-thirds of gross income is spent on taxes, housing, transportation, and health care.

Millennials, most especially males, coming of age since the mid- to late 2000s do not earn enough to afford the major components of household spending, i.e., taxes, housing, autos, and health care (insurance).

Continue reading “U.S. Households Under Pressure: Stagnant Incomes, Rising Basic Expenses”

AFFIRMATIVELY FURTHERING FAIR HOUSING

Government mandated racial diversity coming to your neighborhood courtesy of your Savior in Chief using your tax dollars to ease the plight of former slaves by providing them housing they can’t afford, but you can. You too can now live next to Section 8 neighbors like Admin in Wildwood. Obama is the gift that keeps on giving. He’s got two years left and he will use executive orders to implement his left wing agenda while appeasing the Republicans with more war. Wait until the nasty parts of Obamacare kick in during 2015.

Guest Post by Anthony Sanders


Free To Choose? Obama Administration Likely To Impose “Affirmatively Furthering Fair Housing” Regulation After Midterm Elections

The midterm elections are on Tuesday, November 4th. After the elections, the Obama Administration is expected to operationalize the “Affirmatively Furthering Fair Housing” regulation in December.

What is the proposed “Affirmatively Furthering Fair Housing” regulation?

According to the New York Post,

After a delay, the administration’s final “Affirmatively Furthering Fair Housing” regulation is now expected to be announced in December. Originally scheduled for finalization in October, the new Housing and Urban Development Department rules will force all cities and suburbs to accept subsidized housing in the name of racial diversity, superceding all local zoning ordinances.

The Orwellian-sounding regulation would force some 1,200 municipalities to redraw zoning maps to racially diversify suburban neighborhoods.

Under the scheme, HUD plans to map every US neighborhood by race and publish “geospatial data” pinpointing racial imbalances. Areas deemed overly segregated will be forced to change their zoning laws to allow construction of subsidized and other affordable housing to bring more low-income minorities into “white suburbs.” HUD’s maps will be used to select affordable housing sites.

It’s part of the administration’s ambitious agenda to eliminate “racial segregation,” ZIP code by ZIP code, block by block, through the systematic dismantling of allegedly “exclusionary” building ordinances. In effect, federal bureaucrats will have the power to rezone your neighborhood.

Some cities are already complaining about the new regulation.

Here is how it will work. HUD and it’s agents will create racial maps and then “encourage” affordable housing construction in non-integrated neighborhoods.

hudracemap

The cost if a municipality doesn’t comply? Loss of HUD block grant funding. Or worse.

School busing was a previous attempt at “equality” of education, but that venture failed badly and was abandoned. So now HUD wants to bus people to your neighborhood … permanently.

Selective Enforcement

Of course, the HUD maps of racial divergence will not be applied equally. Does anyone believe that Democrat Nancy Pelosi will allow affordable housing projects in her swank San Francisco neighborhood? Will billionaires in the San Francisco Bay Area from Google, Apple, etc., allow affordable housing projects in Portola Valley, Los Altos Hills, etc? Will wealthy horse owners in Northern Virginia allow affordable housing projects plopped in the middle of their farms? Not likely.

This is massive Federal overreach and negates “voting with your feet.” That is, if you choose to move away from bad schools, crime, etc., the Federal government will negate your freedom of choice and plop the same problems in your new neighborhood.

And I doubt if President Obama will allow an affordable housing project next to whatever swank golf course he decides to move to after he leaves office.

No, the “Affirmatively Furthering Fair Housing” Regulation is another attack on the middle class.

This new regulation comes from HUD, the same people that brought us “The National Homeownership Strategy: Partners in the American Dream” under President Bill Clinton that turned out to be a nightmare for millions of American households.

Here is Nobel Laureate Milton Friedman discussing freedom of choice versus government control of markets.

The Big Lebowski Housing Market

Guest Post by Anthony Sanders

The Big Lebowski Housing Market: Declining Purchasing Power And Wage Growth … With Rising Home Prices

It has been a rough ride since 2007.

Purchasing power of the US consumer continues to decline and now we have declining average wage earnings (YoY).

purchpoweravaage

These rotten economic indicators are reflected in declining mortgage purchase applications and single family housing starts.

20140904_housing

And to make matters worse for US consumers, house prices have been rising again after the 2008-2009 bust.

ppcs20

With declining purchase power and wage growth, it’s time to find that special rental unit like the one that Jeffrey Lebowski occupied.

Dude House 2

And you can attend a Masters of Real Estate Development (MRED) Program and become a HUD-approved landlord … like Marty!

landlord

And you too can perform a dance cycle for your friends!

dancecycle

CAN BUBBLES YELLEN EXPLAIN THIS?

Applications for mortgages to purchase a house are 17% below last years level. They are 30% below levels in 2009/2010 during the depths of the recession. They are 12% below the level of 2012 when national home prices bottomed out.

The Case Shiller price index is up 25% from its low and is now back to mid-2008 levels. In mid-2008 mortgage applications to purchase homes were 100% higher than they are today. So we have mortgage applications dramatically lower since 2008, now at levels seen in 1997, but home prices have been driven 25% higher in the last two years. How could that be?

The chart below provides the reason. It’s certainly not growth in real household income, as that has plunged by 8% since 2008 and remains stagnant. Average hourly wages haven’t moved upwards in five years. How can people buy homes when their income is falling? They can’t.

The yellow line tells the story. Helicopter Ben and Bubbles Janet have printed fiat at a phenomenal rate and shoveled it into the troughs of their Wall Street owner pigs. The Wall Street shysters then created a fake housing shortage by withholding foreclosures from the housing inventory while buying up millions of homes in their own to rent scheme. Throw in the Chinese laundering their ill-gotten cash by buying up luxury real estate, and you’ve got a 25% increase in home prices.

Would a spineless, captured politician in Congress dare ask Bubbles Yellen about this immoral, criminal, treasonous act against the American people? Not a chance. So keep believing the economy is recovering, jobs are being created and the housing market is in great shape. The wealth of the oligarch pigs depends upon it.


WALL STREET HOUSING RECOVERY FOR THE .1%

Here’s your housing recovery.

It’s good to be the kings!!!!

America – run by the few for the benefit of the few.

Guess Who Is Propping Up The US Housing Market

Tyler Durden's picture

A month ago we showed a chart that, in our humble opinion, summarized all that is wrong with the US housing market. The chart in question showed the April breakdown of existing home sales on a Y/Y basis by pricing bucket.


Needless to say, what the chart showed was the symptomatic, and schizophrenic, breakdown of US housing into two camps: the housing market for the 1%, those costing $750K and above, where the bulk of transactions are mostly between non-first time buyers, and typically take place as all cash transactions, and the market for “everyone else” which continues to deteriorate.

Moments ago the NAR released its May data, which on first blush was widely lauded as bullish: the topline print came at a 4.9% increase, rising from 4.65MM to 4.89MM, above the 4.74MM expected. Great news… if only on the surface. So what happens when one drills down into the detail? As usual, we focused on the last slide of the NAR breakdown, located at the very end of the supplementary pdf for good reason, because what it shows is hardly as bullish.

So how does this “housing recovery” in which the NAR has proclaimed the “sales decline is over” look on a granular basis.

The answer is below, and it is even worse than the April data. It also explains why first time buyers have dropped to even further cycle lows of just 27%, down from 29% both a month and year ago.

This is bad because while in April there was a modest increase sales in house buckets from $250 all the way up to $1MM +, in May the only bucket that had an increase in sales from a year ago was that exclusively reserve for the ultra-richest, i.e., those who benefit the most from the Fed’s non-trickle downing wealth effect policies. In fact, on a price bucket basis, the May data was unformly worse than April!

The logical follow up question: what is the total percentage of sales by given price bucket? The answer, once again, below.

Housing recovery? Maybe for the richest, and even they are far less exuberant about purchasing $1MM+ mansions. For everyone else, enjoy “plunging” hedonically-adjusted LCD TV prices. Everything else is, well, noise.

The Housing “Recovery” In Four Charts

Submitted by Charles Hugh-Smith of OfTwoMinds blog,

The unintended consequences of the Fed’s unprecedented interventions will rip the heart and lungs out of the housing market

The housing “recovery” since 2010 can be summarized in four phrases: diminishing returns, unprecedented central state/bank intervention, unintended consequences, end-game. Three charts from our friends at Market Daily Briefing and one of the Case-Shiller Home Price Index tell the story.

Let’s start with what we all know: declining mortgage rates, mortgage securitization, poorly regulated/unregulated no-document, no-down mortgages, easy credit policies of the Federal Reserve and massive Federal subsidies of housing and mortgages fueled an unprecedented housing bubble from 2001 to 2007.

The index of major housing markets rose from 80 to 227–a staggering 280% rise in a few years.
The housing bubble was a classic Ponzi Scheme. A recent article in Scientific American explains that Ponzi schemes do not require a fraud–all they require is the belief that another buyer will pay significantly more for an asset than we did: The Whole Economy Is Rife with Ponzi Schemes (subscription required; look for the June issue at your local library).

This bubble dynamic needs nothing more than a supply of greater fools willing to pay substantially more for assets that haven’t changed qualitatively or quantitatively, and our expectation that the supply of greater fools is endless.

Alas, the number of people willing and able to borrow immense sums to buy more houses eventually falls below the number needed to sustain the bubble, and the bubble promptly implodes.

The Federal Reserve responded to the bubble collapse with unprecedented intervention to prop up housing values: the Fed dropped short-term interest rates to near-zero (i.e. ZIRP, zero-interest rate policy) and bought roughly $2 trillion of mortgage-backed securities in two waves. (That’s about 20% of the entire U.S. mortgage market.)

In this chart, we see the original housing bubble and the echo bubble blown by the Fed’s unprecedented interventions.

The home price index is now roughly 130% above its pre-bubble levels.

Not unsurprisingly, the housing market responded to the end of the Fed’s first wave of mortgage buying by tanking. The Fed quickly launched a second monumental wave of mortgage purchases, and this corresponded to a renewed surge in housing prices.

A decline of just over 2% in mortgage rates helped push the housing bubble to insane heights. The Fed’s unprecedented interventions pushed mortgage rates lower by almost 3% at the bottom, and housing prices rose by about 20%.

That’s called diminishing returns: The Fed has pulled out all the stops in its support of housing (as have the Federal housing agencies such as FHA), yet housing managed only a weak 20% expansion on the back of this extraordinary, multi-trillion-dollar manipulation (oops, I mean intervention).

The Fed’s policies of unlimited liquidity and zero-interest rates have generated an unintended consequence: the super-wealthy financiers closest to the Fed’s money spigot can borrow money to buy housing at absurdly low rates, while regular home buyers have been largely frozen out of the market as a result of 1) bidding wars with all-cash investors desperate for yield in a zero-rate environment and 2) banks that have tightened lending standards as rates have plummeted and risk has finally been priced into the housing market.

(Recall that virtually the entire mortgage market is Federally backed/subsidized; in effect, the mortgage market in the U.S. has been fully socialized, with taxpayers on the hook for all the debt guaranteed by Federal agencies.)

The echo bubble is entirely driven by all-cash purchases by investors desperately seeking some sort of yield in a Fed-engineered low-yield economy via rental housing. Investors driven to extremes by the Fed’s interevention are the greater fools, and the supply of these greater fools is finally diminishing. Once the pool of greater fools evaporates, the echo bubble will burst, just like the initial bubble burst.

Meanwhile, back in the real world where mortgages are serviced by earned income (wages and salaries), the ratio of mortgage debt to wages/salaries is still roughly double historical ratios. The debt/wages ratio rose in the go-go years of the dot-com stock market bubble, as rising wealth encouraged the belief that higher debt levels would be offset by rising income and stock market wealth.

But the current ratio is still 35% higher than the late 1990s.

Now we discern the end-game: the pool of greater fools is evaporating as prices reach nosebleed territory and newbie rental-housing investors discover houses and renters have all sorts of real-world issues that paper wealth doesn’t have. In other words, that promised 6% net yield is not guaranteed, but is fraught with risks– especially in a recession, where renters stop paying and the pool of renters able to pay sky-high rents dries up.

Since average wage earners are effectively frozen out of the market, that leaves current homeowners who are selling and “moving up”. Oops: 20% of all homeowners are effectively underwater and cannot sell/buy another home. Housing debt still traps 10 million Americans.

The returns on the Fed’s unprecedented interventions are diminishing, the pool of greater fools is shrinking, households are either underwater or frozen out of the market, and the economy is supposedly healthy.

So what happens when investors lose their appetite for housing? What happens when the economy slips into recession? What happens when the Fed’s purchases of mortgages slacken or end?

The whole echo bubble is based on unsustainable extremes of interest rates, central-planning intervention and investor fantasies that the supply of greater fools will never decline. If history is any guide, rates will rise (albeit modestly), the economy’s “recovery” will end in recession, the Fed’s manipulation will cease having any positive returns while the unintended consequences of the Fed’s unprecedented interventions will rip the heart and lungs out of the housing market.

Chronicling The Fed’s Follies: America’s Housing Fiasco Is On You, Alan Greenspan

Guest Post by David Stockman

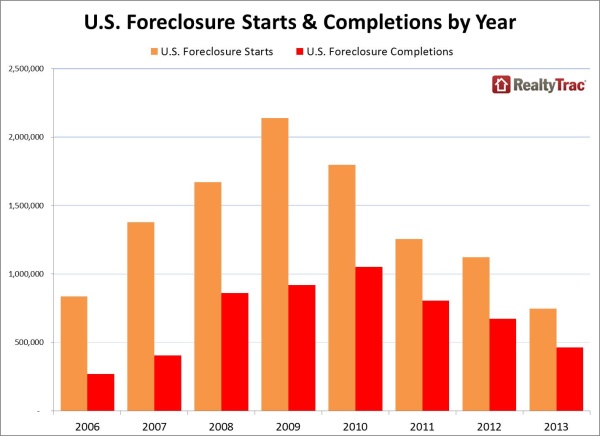
So far we have experienced 7 million foreclosures. Beyond that there are still 9 million homeowners seriously underwater on their mortgages and there are millions more who are stranded in place because they don’t have enough positive equity to cover transactions costs and more stringent down payment requirements.

And that’s before the next down-turn in housing prices—a development which will show-up any day. In fact, another downward plunge is a positive certainty now that the buy-to-rent LBO speculators are rapidly pulling out of those “flash” bull markets in Arizona, California, Los Vegas, Florida and elsewhere. The latter were merely short-lived price eruptions which were an artifact of the Fed’s free money policies.

Yet even as Wall Street heads out of Dodge City the normal wave of organic buyers is nowhere to be seen. That’s because the inexorable normalization of interest rates is already beginning to drive housing affordability even further south among the diminishing cohort of buy-to-occupy households with sufficient income to meet today’s financing standards.

Among the latter, incomes are stagnant in real terms and have been so for a decade. In the absence of real income gains, therefore, the “affordable” price of housing is essentially an inverse function of the cost of leveraged carry. As the latter goes up, the former goes down.

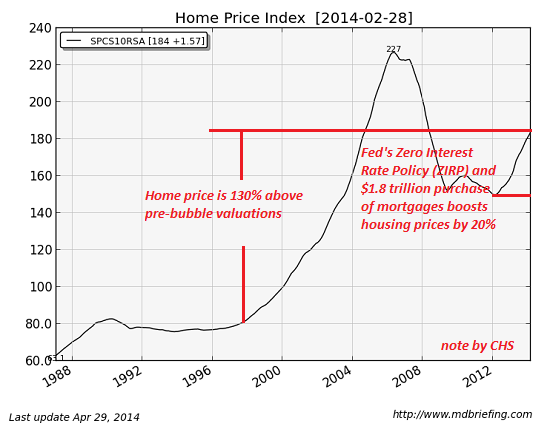
In short, the socio-economic mayhem implicit in the graph below is not the end of the line or a one-time nightmare that has subsided and is now working its way out of the system as the Kool-Aid drinkers would have you believe based on the “incoming data” conveyed in the chart. Instead, the serial bubble makers in the Eccles Building have already laid the ground-work for the next up-welling of busted mortgages, home foreclosures and the related wave of disposed families and social distress.

foreclosure-completions

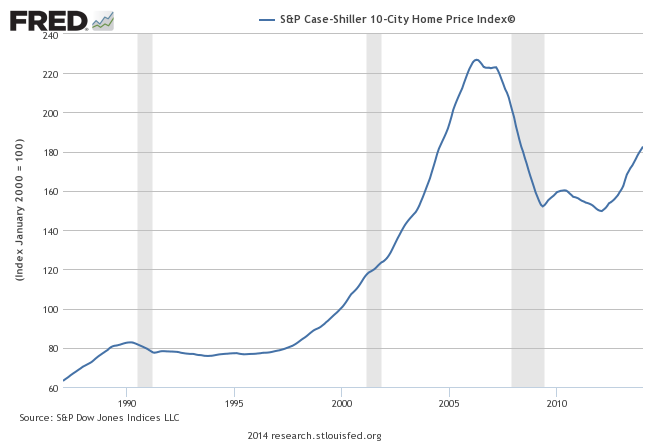
Yet none of this carnage was inexorable or necessary. In fact, a housing bubble of the fantastic magnitude that unfolded during the Greenspan era could not occur on the free market. The 3X gain in housing prices between 1994 and 2007 was entirely an artifact of the massive outpouring of cheap mortgage debt that occurred during that period. The latter, in turn, is a consequence of the Fed’s financial repression policies—–maneuvers that disable and paralyze market interest rates and thereby enable runaway speculations fueled by virtually unlimited cheap debt.

Case Shiller Index - Click to enlarge

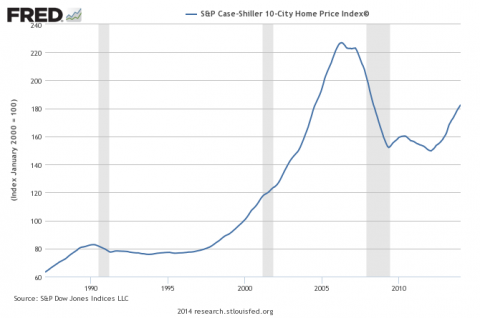
Case Shiller Index – Click to enlarge

Oddly enough, even the baby-steps toward normalization of interest rates recently taken by the Fed make it easy to benchmark the monumental scale of the mortgage bubble ignited by the Maestro’s abject capitulation to Wall Street after the Bush Republicans gained the White House in December 2000. On an all-in basis, Greenspan’s reckless money printing increased mortgage volumes by up to 5X what would have prevailed in an honest free market.

As I laid out in chapter 20 of the Great Deformation (“How The Fed Brought The Gambling Mania To America’s Neighborhoods”), during the 30 months after the Fed’s first bubble splattered—the dotcom crash—-Greenspan foolishly cut money market interest rates over and over until the 6.5% cost of money on Christmas eve 2000 had been reduced to 1% by June 2003. Never before in the Fed’s 100-year history had rates been reduced by 85% in such a short interval with such reckless abandon.

Not surprisingly, variable rate mortgage issuance exploded because teaser interest rates plummeted to lower levels than even during the Great Depression. Whereas mortgage issuance had rarely topped $1 trillion in earlier years, the run rate of issuance topped $5 trillion during the second quarter of 2003.

Such a massive explosion of ultra-cheap mortgage debt was guaranteed to elicit a frenzy of speculation in residential housing. Indeed, as is evident in the chart above during the roughly 60 months after Greenspan’s panicky rate reductions incepted, the national housing price index doubled.

The great Fed Chairman of yester-year like William McChesney Martin and Paul Volcker would have been appalled by such an outbreak of speculation and would not have hesitated to pick up the punchbowl and march straight out of the party. That’s what Martin did in August 1958 when he suspected too much speculation on Wall Street only six months after a business recovery had started.

But Greenspan had by then been coroneted as the Maestro and proceeded to prove exactly why monetary central planning is such a dangerous doctrine. When it became evident that large amounts of this massive outpouring of mortgage debt were being used as “cash-out” financing and applied to current spending on new carpets, autos and Caribbean cruises, Greenspan pronounced this destructive raid by mortgage borrowers on their own home equity nest-eggs as a fabulous new advance in financial innovation called “mortgage equity withdrawal”. It would even outdo Keynes: the people, not their government, would imbibe the magic elixir of more debt, and thereby generate more spending, income and economic growth.

In truth, America’s baby-boom generation was robbing its own future retirement years, but the Maestro was oblivious. Instead, he was busy tracking the quarterly rate of MEW (“mortgage equity withdrawal”) and crowing about how it was contributing to unprecedented prosperity on Main Street. It ended up in a conflagration of exploitive lending, fraud, default and trillions of financial losses, of course, but not until $5 trillion of cumulative MEW during the decade through 2007 had ruined the financial well-being of America’s middle class for a generation to come.

Under a regime of free market interest rates $5 trillion of MEW—that is, robbing from the future to party today—could not have happened. Long before the 2003-2006 blow-off top, mortgage interest rates would have soared to double digit levels, causing monthly debt service requirements to double or triple. Moreover, in an environment of market-set interest rates there would have been no Greenspan Put or ultra cheap wholesale financing that enabled Wall Street to fund mortgage boiler shops with warehouse credit lines and buyers of its toxic securitization products with cheap repo.

In short, free market interest rates are the vital check and balance mechanism which prevents runaway spirals of debt issuance and frenzied bidding-up of asset prices. Yet it was Greenspan’s “wealth effects” doctrine that destroyed the mechanism of honest price discovery once and for all. The carnage that has ensued in the nation’s credit and housing markets, therefore, is on you, Alan Greenspan.

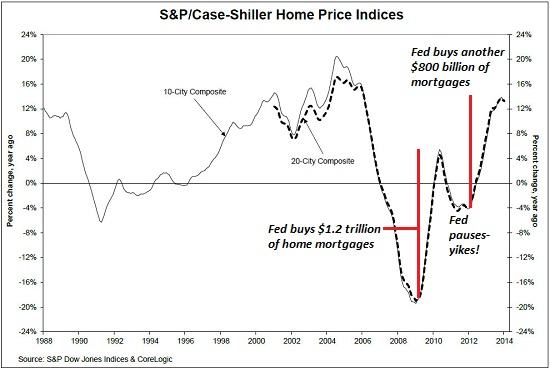
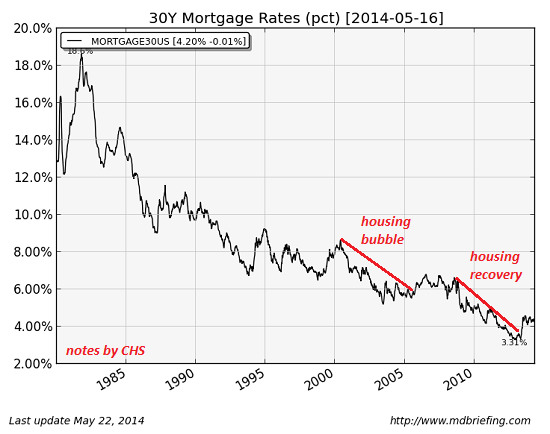
The outcome of the Bernanke money printing spree of 2008-2013 provides even further evidence of Greenspan’s original culpability. During that five-year period, the Fed drove the 30-year mortgage rate from 6.5% to a low of 3.3%, thereby trigging a renewed wave of “refi madness” as shown below:

Photo

Since the spring of 2013 when the Fed signaled that its massive bond purchases would enter the “taper”, however, the mortgage rate has rebounded to about 4.5%. Accordingly, about 35% of the Bernanke repression has already been retraced and even that modest start toward interest rate normalization has had dramatic impacts on mortgage volumes.

The mortgage refi machine is now virtually shutdown, meaning that the run rate of mainly purchase money mortgage originations has plummeted to about a $1 trillion per year. So the math is pretty basic: During much of the Greenspan housing bubble the mortgage origination rate was $3-4 trillion annually—a level dramatically above what is being generated right now in a market that has taken only a baby step toward normalization.

Needless to say, it was this massive and artificial excess of mortgage financing that created the original Greenspan housing bubble; that induced his successor to try to overcome the carnage of the bust with a new round of refi madness; and that has now left the nation’s residential housing market high and dry for the fourth time since 1990.

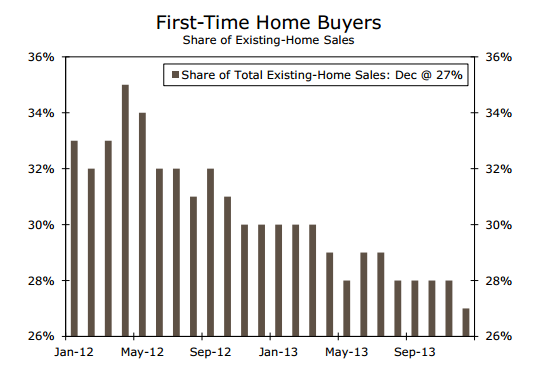
As shown below, this short-term flash boom in housing prices induced by Bernanke’s money printing spree has driven first time buyers out of the market. And now more and more “trade-up” buyers will be forced out too— as they face steadily higher interest rates on new purchase mortgages and therefore progressively lower levels of home price affordability:

first-time-home-buyer

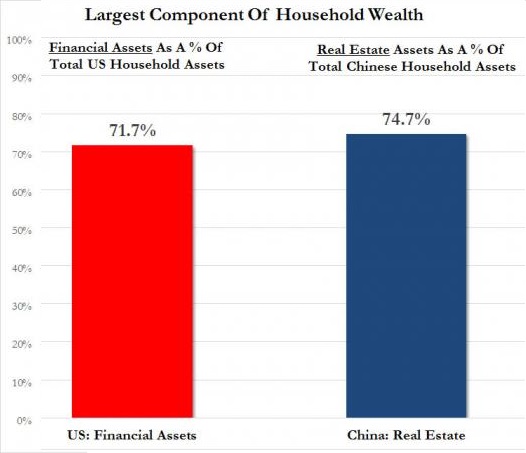
So the housing market is on the eve of another trip through the grinder of falling prices, rising defaults and spreading socio-economic distress on Main Street. Yet because the Fed gets away with ludicrous excuses about the mayhem it causes—such as Greenspan’s pathetic claim that the housing bubble was caused by the propensity of ex-rural serfs in China to save too much when they moved into the factory cities— the debilitating cycle of bubble finance goes on.

As this recent Wall Street Journal story so starkly conveys—policy makers and lenders are so desperate to restart a new round of phony housing finance that the 3% down mortgage is already back, and 10,000 pages of Dodd-Frank regulations have done nothing so stop it:

One such lender is TD Bank, Toronto Dominion’s U.S. unit, which on Friday began accepting down payments as low as 3% through an initiative called “Right Step,” geared toward first-time buyers and low- and moderate-income buyers.

Excess savings by Chinese factory girls, indeed!