Pessimism, Fatalism, Realism, Optimism, Hope

By Doug “Uncola” Lynn via TheBurningPlatform.com

When I first had the idea to write this piece, it was going to justify my own overwhelming sense of foreboding regarding future events that, to me, seem as inevitable as gravity drawing water down a drain. I wanted to defend my perspectives against those who still have hope. First, I would parse the meanings of pessimism, fatalism, and realism, and then use persuasive language to show how I was merely being honestly realistic because math.

I was going to entitle the essay “Embracing Realism with an Attitude of Pessimism and a Foreboding Sense of Fatalism” and demonstrate how I was not a pessimist or a fatalist per se, but rather a realist.  I would then use that construct to demolish any remaining hope still aflame within the hearts of the readers; as a favor to them.

In fact, I even conducted an informal poll to sample the perspectives of awakened and like-minded online travelers.  Like the flicker of lanterns in a dark wood, the glint of moonlight from metal on a mountain trail, or a midnight campfire tossing sparks into heaven – I was surprised to see that hope still shined for 6 out of 10 red-pilled wanderers traveling through the entropic cosmos, beyond the great digital divide.

Continue reading “Pessimism, Fatalism, Realism, Optimism, Hope”

Professor Claims Math, Algebra, And Geometry Promote “White Privilege”

Authored by Ian Miles Cheong via DailyCaller.com,

A University of Illinois math professor believes that algebra and geometry perpetuate “white privilege” because Greek terms give Caucasians unearned credit for the subject.

But that isn’t the professor’s only complaint. She also believes that evaluations for math proficiency perpetuates discrimination against minority students, if they do worse than their white counterparts.

Rochelle Gutierrez argues in a newly published math education book for teachers that they must be aware of the identity politics surrounding the subject of mathematics.

Continue reading “Professor Claims Math, Algebra, And Geometry Promote “White Privilege””

U.S. Kids Keep Getting Dumber; Ranked 31st Of 35 Developed Nations In Math, New Study Reveals

Tyler Durden's picture

The U.S. Department of Education has just released it’s latest ranking of international education systems (Program for International Student Assessment – “PISA”) and performance of U.S. students just continues to deteriorate on both absolute and relative terms.

Perhaps it’s time to have a real conversation about the complete failure of “Common Core” and the idiocy of allowing teachers’ unions to hold our children hostage while hiding behind ridiculous contracts that grant tenure after 6 months and make it impossible to fire underperformers.  Just a thought for the incoming Trump administration.

The Washington Post’s Valerie Strauss summed up the problems nicely:

Continue reading “U.S. Kids Keep Getting Dumber; Ranked 31st Of 35 Developed Nations In Math, New Study Reveals”

MORE MONEY, DUMBER KIDS

Hat tip Robmu1

It’s hysterical reading a NYT article about the atrocious state of our public education system. They give a couple of paragraphs with some hand picked facts, and then spend 75% of the article with excuses from the government drone bureaucrats, union teachers, and liberal academics. They have been rolling out Common Core for years. The amount of money spent per student has been going up for decades. We’ve had Headstart. We’ve had no child left behind. We’ve integrated the schools to make black kids smarter. We’ve implemented the curriculum demanded by the Federal government.

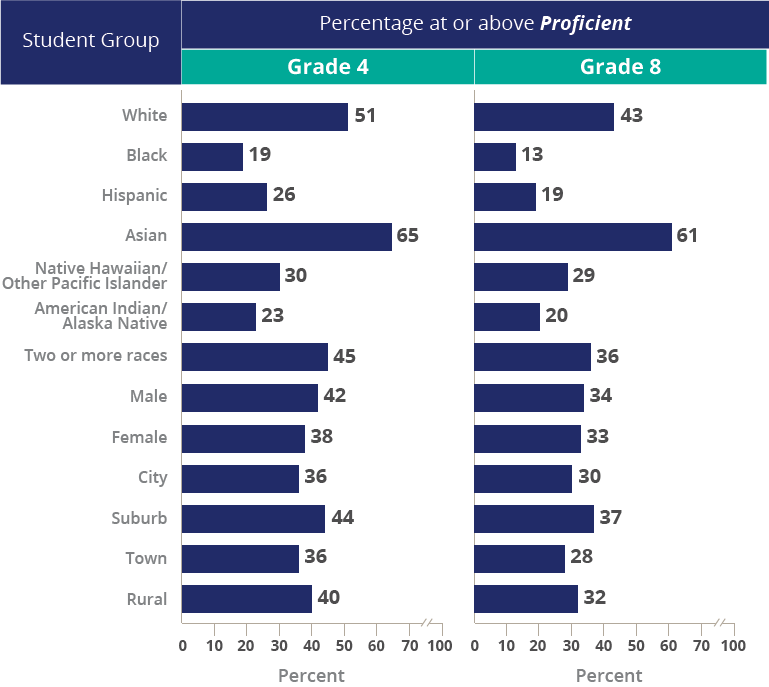
And kids just keep getting dumber and dumber. Only 40% of all Fourth graders are proficient at math. The most hysterical part of the report is that after four more years of government education, everyone’s proficiency DROPS. By eight grade, proficiency in math plunges to 33%. It’s almost as if the government wants to produce generations of dumb downed morons who remain willfully ignorant for their entire lives.

You can now see why the social justice warriors want to eliminate standardized testing. It seems black kids and hispanic kids, after decades of Great Society programs totaling $13 trillion, haven’t exactly caught on to maff and reading. If these tests are so terrible, why do Asians score 460% better than blacks and 40% better than whites in eight grade? 

Image of a horizontal bar chart, divided into 2 sections: one for grade 4 and for one grade 8. In each section the ‘X’ axis shows the percentage of students at or above the Proficient level, ranging from zero to 100 percent, and the ‘Y’ axis shows the student group.In mathematics at grade 4, the percentages of students who performed at or above the Proficient level were as follows: 51 percent of White students, 19 percent of Black students, 26 percent of Hispanic students, 65 percent of Asian students, 30 percent of Native Hawaiian/Other Pacific Islander students, 23 percent of American Indian/Alaska Native students, 45 percent of students of two or more races, 42 percent of male students, 38 percent of female students, 36 percent of students in cities, 44 percent of students in suburbs, 36 percent of students in towns, and 40 percent of students in rural areas. In mathematics at grade 8, the percentages of students who performed at or above the Proficient level were as follows: 43 percent of White students, 13 percent of Black students, 19 percent of Hispanic students, 61 percent of Asian students, 29 percent of Native Hawaiian/Other Pacific Islander students, 20 percent of American Indian/Alaska Native students, 36 percent of students of two or more races, 34 percent of male students, 33 percent of female students, 30 percent of students in cities, 37 percent of students in suburbs, 28 percent of students in towns, and 32 percent of students in rural areas.

They should test kids on how well they use a smart phone, texting speed, and what drugs Lamar Odom used on his weekend binge at a whorehouse. The funniest part is if you asked kids in eighth grade how smart they thought they were, the scores would be above the 80th percentile. These kids are so stupid, they don’t even know they’re stupid. All those participation trophies and being passed along from grade to grade with no requirement to actually learn anything has given these idiots high self-esteem to go along with their stupidity. What a combination.

Via NYT

Nationwide Test Shows Dip in Students’ Math Abilities

For the first time since 1990, the mathematical skills of American students have dropped, according to results of a nationwide test released by the Education Department on Wednesday.

The decline appeared in both Grades 4 and 8 in an exam administered every two years as the National Assessment of Educational Progress and sometimes called “the nation’s report card.”

The dip in scores comes as the country’s employers demand workers with ever-stronger skills in mathematics to compete in a global economy. It also comes as states grapple with the new Common Core academic standards and a rebellion against them.

Continue reading “MORE MONEY, DUMBER KIDS”

I’M 100% CONFIDENT MOST AMERICANS ARE MORONS

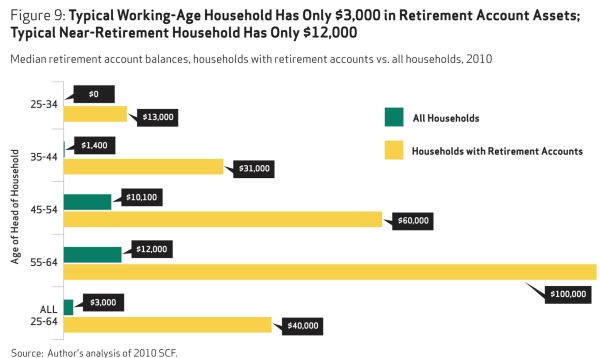
These polls crack me up. They prove how delusional and stupid the average American truly is. Americans are the most confident people on earth. Too bad they are also the most egotistical, clueless, and math challenged people on earth. The poll below shows that 58% of Americans are either very or somewhat confident about their retirement. A full 75% of them think they’ll have enough to take care of basic expenses and 56% think they’ll have enough for medical expenses. The average American is an imbecile if they think they are in good shape.

Here are the facts. The median retirement balance of all households is $3,000. The median retirement balance of 45 to 64 year old households is $11,000. But still, the delusional morons in this country are confident about their retirements.

Here is some basic math for these people. If we even use $100,000 as the starting retirement account of a newly retired 65 year old, the rule of thumb is that you can’t spend more than 4% of the balance per year in retirement. That’s $4,000. The average Social Security payment is $13,000 per year. Are these blithering idiots really CONFIDENT they will be able to pay basic and medical expenses on $17,000 per year? REALLY???

I’m 100% confident the majority of Americans are truly fucked and will beg for the government to save them. I’m also 100% confident this entire edifice of debt is going to collapse under the weight of delusion, stupidity and false confidence. Carlin was absolutely right.

“Think of how stupid the average person is, and realize half of them are stupider than that.”


A survey conducted by the Employee Benefit Research Institute has found that the percentage of Americans confident of a financially comfortable retirement is increasing. 22 percent of respondents said they were very confident about the financial aspects of life after work while 36 percent were somewhat confident.

Looking closer at certain elements of retirement, 37 percent of Americans feel very confident that they will have enough money to take care of their basic expenses. However, when it comes to taking care of medical expenses and paying for long-term care, this number fell. Just 18 percent of people are very confident of being able to handle their medical expenses while even fewer, 14 percent, feel confident about paying long-term care bills, should they need to.

Infographic: How Confident Are Americans About Retirement?  | Statista

You will find more statistics at Statista


Three unsustainable trends are about to collide

A perfect storm of demographics, debt and energy

The population of the United States is expected to continue growing.

It’s getting more and more difficult to write with interest about the challenges the world economy is currently facing. Not because there’s a shortage of interesting things to write about — wars, sanctions, failed money-printing experiments, the list is long — but rather because most of the negative news and major world events we see around us are symptoms of the disease, not the disease itself.

There are only so many times you can describe the disease, before it becomes too repetitive for both the writer and the reader. Instead, I find it far more interesting to focus on the root causes, because then real solutions can be explored that offer the possibility of actual remedy.

So let’s start here, with a simple grounding in the facts as we know them. No spin, no agenda; just some numbers.

Demographics

There are approximately 7.2 billion humans on the planet, and consensus estimates put that number at 9.6 billion by 2050. Over the same time period in the U.S., people aged 65 and older will increase from 46 million currently to 84 million, a 82% increase, while the entire U.S. population is projected to swell from its current 319 million to 400 million, a 25% increase.

Debts

Next, the net present value of the actual liabilities of the US federal government are somewhere between $69 trillion and more than $200 trillion depending on whether you prefer the Treasury as your source or the CBO.

The real fiscal deficit of the U.S. government, as opposed to what was reported, was just over $1 trillion in FY 2014 (as measured by the actual increase in the federal debt).

When your debts and liabilities are increasing at several multiples of your income growth, you have a math problem that sooner or later will catch up with you.

The only nonpainful way out of such a math bind is to reverse the situation and grow our income faster than our debts and liabilities. The painful way involves either a hard default or a stealth default via inflation. Let’s assume we all wish to avoid the painful route.

This means we have to ask some hard questions. What will be the engines of all that future growth? Why has growth been so difficult to come by of late? What if the hoped-for future growth doesn’t materialize? Even worse, what if we get a sustained period of negative growth? Then what?

Here’s where things get sticky.

Energy production

One of the more solid economic correlations we know of is that between a growing economy and growing energy usage. And oil is one of the main factors in this relationship, if not the key factor. For now, the U.S. is enjoying a resurgent period of oil production thanks to shale (or “tight”) oil. The U.S. can use that energy to grow its economy, or we can export it to other countries so they can grow theirs.

Now, let’s widen our view back out to 2050. Where is the U.S. tight oil story then? Well, according to the Energy Information Administration, it will be 31 years in the rearview mirror, as the EIA projects that U.S. tight oil production will peak in 2019. That’s right, in just five short years from now, the U.S. “shale oil miracle” will start becoming a historical artifact.

On top of that, virtually every single oil reservoir in the world currently in production will be in decline by 2050. Perhaps we’ll find additional oil under the Arctic, or in ultra-deep ocean deposits, or in even tighter rock formations, but it won’t be cheap oil —- the sort that we rely on to drive economic expansion.

These trends in oil, debt and demographics are stark all on their own, but together they are staggering.

And if we then tie them to the obvious ecological strains of meeting the needs of 7.2 billion souls (let alone the 9.6 billion by 2050), any adherence to the status quo seems worse than delusional. For example, since 1970, overall world wildlife populations have been reduced by 40% (land and sea) to 70% (river). Perhaps it’s time plot our course a bit more carefully, before those losses approach 100%.

The disease

The disease then is our blind adherence to growth at any cost. Its symptoms are the limits we are bumping into with increasing frequency along the way. They’re more numerous today than before the world’s central banks began their grand global money printing experiment and yet, like a quack doctor prescribing more Vicodin to mask a serious underlying malady, the central planners and their political overseers refuse to reconsider the situation.

As economist Herb Stein once said, “if something cannot go on forever, it will stop.” Someday, perhaps soon, the inexorable logic of simple math will force wrenching changes upon those who refuse to change on their own.

Which brings me to the title of this piece: Ready or Not. The unsustainable status quo will end, likely sooner than we want, whether we are prepared for it to or not.

Chris Martenson is is an economic researcher and futurist specializing in energy and resource depletion, and co-founder of PeakProsperity.com.

Un-Common, Not Core

Via American Thinker

I became a math teacher by a circuitous route.  My degree is in engineering.  I spent five and a half years refurbishing nuclear submarines, and then I quit work to bear, rear, and eventually homeschool our three children.

As a homeschool mom, I participated in co-ops, taking turns teaching groups of homeschooled children subjects such as nature study and geography. As our children entered their teen years, I began teach to teach algebra, trig, and calculus to small classes of homeschoolers at my kitchen table.  And as our children left home for their four-year universities, two to major in engineering and one in art, I began teaching in small private schools known as classical academies.

This last year, I have also been tutoring public-school students in Common Core math, and this summer I taught a full year of Common Core Algebra 2 compressed into six weeks at an expensive, ambitious private school. 

I’ve taught and tutored the gamut of textbooks and curricula: Miquon and Saxon to my own kids and whenever the choice of curriculum was mine to make; Foerster, Saxon, Jacobs, or Holt when hired to teach at a school.  I’ve tutored out of the California state adopted texts: CPM, Everyday Math, Mathland, Houghton Mifflin Harcourt, McGraw Hill, Addison Wesley, and Holt.  I’ve had students come to me from all of the above plus Teaching Textbooks, Singapore, and Math U See.

This last year was my first experience first tutoring, then teaching Common Core, and I was curious.  I had read the reports of elementary-school children crying over their homework and staying up past midnight to complete it, so I expected Common Core to be like Everyday Math, Mathland, and CPM: poorly explained, abstruse, confusing.  I was correct on those counts.

What surprised me was that Common Core was also hard.

Now, I like rigor.  I have high standards.  My goal for my students is that they will become competent and confident mathematicians.  But I was stunned to see that my tutoring student’s pre-algebra work incorporated about a third of a year of algebra 1.  The algebra 2 text incorporated about a third of the topics I would expect to find in a precalculus course.  And so forth.

This did not mesh with the reports from Pennsylvania, Wisconsin, Utah, or New York, where Common Core is alleged to lower standards – in one case, specifically, to move multiplication tables from third grade to fifth grade.  It appears that Common Core is not being implemented in a consistent (or common) way across the United States.  But I can only address pre-algebra through calculus in texts claiming to be Common Core in California.  These texts are shoveling about a third of the subsequent year’s topics into the current year.

This problem is exacerbated by the recent fad for accelerating students through their math classes.  Fifty years ago, algebra 1 was a ninth-grade course for fourteen-year-olds.  Now it is routinely taught in eighth grade, sometimes in seventh.  Algebra 1 in seventh grade means that pre-algebra is taught in sixth grade to eleven-year-olds, and few eleven-year-olds have achieved the cognitive development necessary to master the abstract logic of one third of a year of algebra.

Cognitive development proceeds not in a smooth curve, but in jumps and plateaus.  Just as most babies learn to walk at twelve months, so most adolescents become capable of logical operations such as algebra at twelve years.  And just as whether a baby walks at nine months or fifteen months has no bearing on whether he plays football in college, so whether a student learns algebra in 7th or 9th grade has no bearing on whether she becomes a National Merit Scholar…save that a child who is pushed and flounders and fails is unlikely to love an activity.

That is what I am seeing with my tutoring students: the math-bright ones are being encouraged to take honors pre-algebra at age eleven.  In prior years, this would have meant that they first had a thorough, final review of arithmetic: adding, subtracting, multiplying, and dividing whole numbers, decimals, and fractions; long division; changing fractions to decimals to percents and back.  Then for a treat, they would be introduced to the glories of algebra, the fun stuff: Rene Descartes’ brilliant invention, with plenty of lists of points that, if properly executed, form an outline of a fish or a dinosaur.  They would be taught signed numbers, order of operations, distributive property, and how to solve for x, and that would be about it.  They would finish the year happily aware that math is fun and that they are good at it.  If they were fortunate enough to be taught from Jacobs’s Mathematics: a Human Endeavor, they would learn about sequences and mosaics and logarithms and even networks, but all with a very concrete development, suited to the emergent logical thinker.

The reform mathematicians who put together Common Core are ignoring cognitive development.  My Common Core pre-algebra students are hurried through the arithmetic review and taught the coordinate system.  They graph lines and parabolas.  They do transformations, exponents (including zero and negative exponents), and a truly horrendous percentage of percentage problems.  The homework can be finished in an hour if the student’s parents can afford to hire a BS mechanical engineer to sit at his elbow and remind him when he takes a wrong turn.  Otherwise, he is up ’til midnight.  Students work hard at tasks beyond their strength; they flounder; they fail; they learn that math is no fun.

This isn’t education. This is child abuse.

Another aspect of Common Core that surprised me was the emphasis given to parent functions and transformations. People over forty years of age, even techies such as physicists, chemists, engineers, and mathematicians, won’t know what parent functions are.  People under thirty-five who have been educated in reform mathematics textbooks will be surprised that is possible to learn mathematics without learning about transformations.

Fifty years ago, transformations were not taught, although math-bright students would figure them out for themselves in analytic geometry (second-semester pre-calculus).  Today, they are taught systematically beginning in elementary school.

The treatment of transformations reminds me of the New Math debacle of the 1960s.  The reform mathematicians of the day decided that they were going to improve mathematical education by teaching all students what the math-bright children figured out for themselves.

In exactly the same way, the current crop of reform math educators has decided that transformations are an essential underlying principle, and are teaching them: laboriously, painfully, and unnecessarily.  They are tormenting and confusing the average student, and depriving the math-bright student of the delight of discovering underlying principles for herself.

One aspect of Common Core that did not surprise me was a heavy reliance on calculators.

The main problem I see with my algebra students is that they have poor number sense.  They can’t tell whether the answer their calculator shows is reasonable or not.  They cling to the notion that 1.41 is somehow more precise than square root of two.  They also can’t add fractions or do long division, which puts them at a severe disadvantage when they must add rational expressions or divide polynomials.

Common Core exacerbates this problem.  At every level, the problems are designed to be too hard to solve by hand.  A calculator is necessary even in elementary school – unless a child is to spend 5 hours a night on homework.  A graphing calculator is necessary for algebra – calculating correlation coefficients by hand is not a viable option.  My students are whizzes with their calculators.  But they reach for them to square 1/3…then write it as 0.11.

Common Core advocates claim that they are avoiding that boring, rote drill in favor of higher-order thinking skills.  Nowhere is this more demonstrably false than in their treatment of formulas.  An old-style text would have the student memorize a few formulas and be able to derive the rest.  Common Core loads the student down with more formulas than can possibly be memorized.  There is no instruction on derivation; the formulas are handed down as though an archangel brought them down from heaven.  Since it is impossible to memorize all the various formulas, students are permitted – nay, encouraged – to develop cheat sheets to use on the tests.

The second-biggest problem with Common Core is the problem of Big Mistakes.  Pretend for a moment that a homeschool family did something as asinine as giving their eight-year-old a calculator instead of teaching him his times tables.  That child would be a calculator cripple.

But that would be a small mistake, affecting one child.  Now consider what happens when a state made such a mistake.  We don’t even have to pretend.  In 1986, California adopted Whole Language Arts, which proved to be a disaster.  Within a decade, California plunged to 49th out of 50 in reading performance.  Millions of children were affected.  Big mistake.

If different states have different curricula, we can observe what works and what does not, and improve thereby.  But Common Core is being pushed nationwide.  This could be the Biggest of all possible Mistakes.

But the worst problem with Common Core is its likely effect on the educational gap between rich and poor in this country.  The students I tutor have parents who would describe themselves as “comfortable.”  No one likes to admit to being rich.  But the middle class and poor cannot afford to pay a tutoring company $50 to $100 per hour so that someone will sit with their children and explain trig identities.

The oft-repeated goal of Common Core is that every child will be “college or career ready.”  Couple that slogan with the oft-expressed admiration for the European system of education – in European countries, students are slotted for university or a dead-end job at age fourteen, based ostensibly on their performance on high-stakes tests, but that performance almost inevitably matches the student’s socioeconomic class.  Do we really want to destroy upward mobility and implement a rigid class structure in the United States of America?

To recapitulate: Common Core teaches about a third of algebra 1 in pre-algebra, a third of pre-calculus in algebra 2, et cetera.  Common Core teaches unnecessary abstractions as essential principles.  Common Core creates calculator cripples.  Common Core fails to derive mathematical expressions, instead presenting them as Holy Writ.

I predict that if we continue implementing Common Core, average students will drop out of math as early as they are allowed.  Even math-bright students will hate math.  Tutoring companies will proliferate to serve wealthy families.  The educational gap between rich and poor will widen.  If we want to destroy math and science education in this country, keep Common Core.

HELP ME OUT HERE

“Extending aid to the unemployed is not only the right thing to do, it is also one of the best ways to stimulate economic growth.” That has become a frequent talking point whenever the subject of unemployment compensation is discussed.

New Hampshire Senator Jeanne Shaheen used that argument during an MSNBC interview. “This is one of the best things we can do to help stimulate the economy, because for every dollar we put in unemployment, it pays back about $1.60. And we know that people who are on unemployment are going to go out, and they’re going to spend that money, they’re going to pay for groceries at their local grocery store, they’re going to buy gas in their car.”
—-from an article posted by PolitiFact.com

PolitiFact.com rated Senator Shaheen’s statement as “Half True.” Well, if it’s half true, that means it is also half false. So I sent Senator Shaheen a simple math test. I was surprised when she replied, and this is one of her answers. Her strong suit is not math.

Help me out here. I’m simply incapable of following the economics and math of sending checks to the unemployed. It may be due to a case of being terminally feeble-minded, but I don’t understand how an unemployed person spending a tax dollar drawn out of a state or federal treasury can magically produce a $1.60 return to the economy. In other words, the taxes YOU paid out of your labor were worth only a dollar, but somehow your tax dollar was suddenly worth $1.60 if the government takes it from you and sends it to someone who is unemployed and spent it.

Think about that. Your taxed labor is worth $1.00, while someone else’s non-labor is worth $1.60. One might say, “Well, you didn’t spend it.” Of course you didn’t. The government took it from you. But if the government lets you keep it and you spent it, is THAT suddenly worth $1.60? I have yet to find anyone who says it is. Oh, one more thing. Are there overhead expenses in handling your tax dollar, such as the salaries of hundreds or thousands of state and federal employess who take dollars out of the tax pile and process them over to the unemployment compensation pile? Yes. Are these overhead expenses part of the magic $1.60 equation? I’ll bet they aren’t. Here’s the new math, and it’s pretty damn close to what Senator Shaheen is claiming.

It gets worse. If you go to some websites, you’ll discover that spending unemployment dollars actually DECREASES THE NUMBER OF PEOPLE IN POVERTY AND CREATES JOBS, MILLIONS OF JOBS. Don’t believe me? Here’s some quotes from the website of Center for American Progress (CAP) (Footnote 1), and its logic is being used by many high-level federal elected leaders, including Senator Shaheen.

“Over the past few years, unemployment benefits have played a key role in helping unemployed workers pay their bills while they search for a new job. (Ok, I’m with you so far.) There are fewer people living in poverty in the United States because of these benefits. The Census Bureau has reported that unemployment benefits pulled 3.2 million people out of poverty in 2010, on top of 3.3 million in 2009.” Yikes! These statements peg the WTF meter. Then explain how the number of people in poverty has increased from 11% to 14% of the total population over that same time period, according to that same Census Bureau, which I quote as follows.

“The annual poverty rate rose to a rate of 11.3 percent in 2007 and increased from 11.3 percent in 2007 to 13.2 percent in 2009. The 2011 annual poverty rate of 14.0 percent was higher than the 2009 annual poverty rate of 13.2 percent.” So, how could over 6.5 million people be pulled out of poverty by unemployment compensation when nearly 10 million MORE people went into poverty in 2009-2011? Here’s the math that CAP used.

Back to more from these geniuses from CAP. “Unemployment benefits also boost the economy. They provide the biggest bang for the buck of the various kinds of government spending. Over the Great Recession, for every $1 spent on unemployment insurance benefits, the economy grew by $2, since recipients typically spend—not save—those dollars. That spending helps boost local economies as the unemployed can continue to pay their mortgage or rent and put food on the table.” Wow, this one tops Senator Shaheen’s claim of $1.60.

And even more from CAP. “The boost that benefits provide leads to job creation. According to a 2010 analysis by Wayne Vroman (Footnote 2), an economist and senior fellow at the Urban Institute for the Department of Labor, unemployment benefits increased employment on average by 1.6 million jobs each quarter from mid-2008 through mid-2010. Of that increase, nearly 900,000 more jobs existed because of regular unemployment benefits, while two federally financed programs—Emergency Unemployment Compensation and Extended Benefits, which provide additional weeks of benefits after workers have exhausted the standard 26 weeks—were responsible for increasing employment on average by slightly more than 700,000 each quarter.”

Yumping Yiminy, am I going mad? This gibberish says, “The longer you don’t work and continue to draw and spend unemployment compensation, the more jobs you create.” Did you do the math on that statement? I did. There are 8 quarters from mid-2008 through mid-2010. So 8 x 1.6 million jobs created per quarter equals 12.8 million jobs created. FROM UNEMPLOYMENT COMPENSATION, for Pete’s sake. Yet the Federal Reserve states that the total number of people employed in the U.S. during that exact same time period went DOWN by 8.7 million.

I just know that there is someone out there in the cyber world who can straighten me out on this. Am I incapable of critical thinking? Were the math and econ teachers in my caveman K-12 and higher education experience all fools? Is this where I’m headed? Some might say I’m already there.

Footnotes.

(1) The Center for American Progress (CAP) is no fly-by-night organization. It is a powerful, well-connected and partisan liberal public policy research and advocacy organization. Its website states that the organization is “dedicated to improving the lives of Americans through progressive ideas and action”. CAP presents a liberal viewpoint on economic issues and has its headquarters in D.C. Its president and chief executive officer is Neera Tanden who worked for the Obama and Clinton administrations and for Hillary Clinton’s campaigns. Its first president and chief executive officer was John Podesta, who served as chief of staff to President Bill Clinton. Podesta remains with the organization as chairman of the board and currently serves as a counselor to President Obama. He was born in Chicago.

(2) “According to a 2010 analysis by Wayne Vroman, an economist and senior fellow at the Urban Institute for the Department of Labor” Did that quote from the article, made by the Center for American Progress, lead you to believe that Vroman works for the USG, specifically the Department of Labor? He does not. He is an employee of the Urban Institute, a so-called “non-partisan think tank” established in 1968 under the Lyndon Johnson administration. It receives 55% of its income from the federal government for “studies.” 100% of the Urban Institute’s employees political contributions went to Democrats, as reported by U.S. News and World Report in 2013. Uh, that’s my definition of non-partisan.

COMMON CORE REQUIRES FRIENDLY ANSWERS TO MATH PROBLEMS

If your 2nd grader can add and subtract the way you learned to add and subtract, they will be told they are wrong. How did it come to this? When did we let the inmates take over the asylum? When did we allow our children to be brain washed with gibberish taught by mediocre union government employees?

The propaganda spewing government educators want our kids to be more friendly with their answers. We are so fucked as a society.

Via The Daily Caller

Friendly problems / Twitter screenshot and Paint

This Common Core math problem asks kids to write the ‘friendly’ answer, instead of the correct one!

Posted By Robby Soave On 10:06 PM 03/25/2014

A second grader’s answers to a Common Core-aligned math worksheet were marked as incorrect because they weren’t “friendly” enough… even though they were the right answers.

A screenshot of the worksheet was posted to Twitter. The teacher wrote that even though the questions — addition and subtraction problems — were solved correctly, the student used the wrong technique to arrive at the answers.

View image on Twitter

“Correct answers, but let’s find the ‘friendly’ numbers,” wrote the teacher.

The teacher wanted the student to solve “530 – 270 = ?” in the following manner: First, add 30 to both numbers, changing the problem to “560 – 300 = ?”. These numbers are the “friendly” numbers, because they are supposedly easier to work with.

The student, however, simply subtracted 270 from 530 the good old-fashioned way, arriving at the same answer. Unfortunately, this is not a Common Core-approved technique.

Though friendly numbers can be useful, the worksheet illustrates the weird priorities of Common Core, according to Twitchy:

In Common Core math, it often is not good enough to get the correct answer. Instead, students are required to show “higher order” thinking skills — in this case, use of the associative property. Yes, the associative property is important and should be taught at some point. Unfortunately, we suspect that many 7-year olds will not be able to understand this particular assignment. With limited days in the school year, wouldn’t second graders — second graders! — be better off spending their time attempting to master the traditional subtraction algorithm?

The Daily Caller readers know that this is not the first Common Core worksheet to baffle young children and infuriate adults.

(RELATED: EPIC FAIL: Parents reveal insane Common Core worksheets)

(RELATED: ANOTHER impossibly stupid Common Core worksheet sure to make your kid a moron)

(RELATED: This Common Core math worksheet offers a glimpse into Kafkaesque third-grade hell)

(RELATED: Can you solve this grammatically incorrect, impossible Common Core question?)

(RELATED: ‘Why are they making math harder?’ More absurd Common Core math problems)

(RELATED: Is this Common Core math question the worst math question in human history?)

Follow Robby on Twitter


DO YOU REALIZE HOW BAD IT REALLY IS?

This is the chart of doom for government workers across the land and the taxpayers funding these pension plans with their hard earned money. The truly frightening fact isn’t how underfunded these plans are today. The frightening fact is the change from 2009. The stock market bottomed out in March 2009. It has risen 120% since March 2009. The funding ratio of these pension plans should have soared higher, along with the stock market. Instead it has declined in most states. My great state of PA has seen its funding ratio PLUNGE from 85.45% in 2009 to 65.61% in 2012. This means that the states have not been contributing the required cash into these plans. This is because they would need to raise property taxes by 10% to 20% to honor the promises they’ve made to government workers.

Now for the kicker. They have been using an 8% long-term return assumption for their plans. Stocks are now overvalued to the point where the long-term expected return is 2.5% and bonds will be lucky to return 0%. Put that in your model and smoke it. If a realistic assumption was used to calculate the future value of these pension assets, you would slice 20% off each of those funding ratios. Now, with the stock market bubble reaching a new peak before the next pop, these pension plans are about to take a 30% to 50% hit over the next few years. Bye Bye pensions.

If you are a government employee and expect your state to honor their pension promise to you, then you are a delusional fool. It’s just math. The taxpayers are not going to allow their real estate taxes to be doubled in order to pay your pensions. I suggest you make alternative plans for your retirement. I hope you like the taste of cat food. The politicians and government bureaucrats lied to you.