2020 – YEAR OF LIVING DANGEROUSLY

“A shocking crime was committed on the unscrupulous initiative of few individuals, with the blessing of more, and amid the passive acquiescence of all.”

Tacitus, Publius Cornelius

Image result for 2020 crisis

The shocking crime being committed during this century under the unscrupulous initiative of a few evil men is ongoing and no longer hidden from those willing to open their eyes and see the truth. As conspiracy theorists have proven to be right through the sacrifice of Snowden, Assange, and other patriots for truth, the Deep State psychopaths have double downed and are blatantly flaunting their power and control over the levers of government, finance and media.

Never in the history of mankind have such devious, unscrupulous, arrogant, narcissistic and downright evil men seized hegemony over global finance, trade and politics. A minority of billionaire oligarchs and their highly compensated apparatchiks, ingrained in government bureaucracies, surveillance agencies and media outlets refuse to relinquish their dominance and would rather burn the world to the ground than lose their ill-gotten riches, un-Constitutional power and unlawful control.

Continue reading “2020 – YEAR OF LIVING DANGEROUSLY”

IT’S CALLED STAGFLATION

Two posts on ZH this morning tell you everything you need to know about Obama’s economy. Real wages are stagnant, just as they have been for the last eight years. In addition, the BLS drones are no longer able to hide the true inflation affecting average households across the nation. Even their “fake numbers” show inflation at 3.6% over the last four months. We know that is bogus, and the true number is in the 5% to 7% range for real Americans paying rent, health insurance premiums, heating their homes, and filling up their gas tanks. 

But the Fed continues to keep rates near 0% so Goldman Sachs can report record earnings and average pay of $338,000 for their “doing God’s work” bankers. When you have no wage growth, while your expenses are rising rapidly, you’ve got STAGFLATION. It’s the worst possible economic situation for deplorables living in the real world outside the bastions of the elite in NYC, DC, LA and SF.

Numerous low, middle and high end retailers have reported atrocious holiday sales and earnings. This contrasts with the bullshit reports from the National Retail Federation and the US government saying holiday sales were solid. Kohls, Macys, Sears, and now Target have admitted their business absolutely sucks. They are closing stores, laying off employees, and slashing their earnings estimates. Does that happen when an economy is booming, as our esteemed president has been crowing about on his farewell tour?

Do you trust your government or do you trust the reality of your bank account and what real businesses operating in the real world are saying?

Continue reading “IT’S CALLED STAGFLATION”

Core CPI Highest Since Lehman (Above Fed Mandate) As Rent, Healthcare Costs Soar

Even the world class data manipulators at the BLS can’t hide the crushing inflation impacting middle class Americans as home price soar due to Wall Street schemes, rent skyrockets because people can’t afford homes anymore, and healthcare cost are driven ever higher by the Obamacare disaster. And you wonder why the middle class is supporting Trump?
Tyler Durden's picture

“This is stagflation: the Fed is increasingly f#*ked,” exclaimed one veteran trader as Core CPI – among The Fed’s favorite inflation indicators after PCE – surged to +2.3% YoY, the highest since Sept 2008. This is the 10th month in a row above the Fed’s mandated 2% ‘stable’ growth as shelter and healthcare costs continue to surge.

Core CPI growth above Fed mandate for 10th month in a row.

Continue reading “Core CPI Highest Since Lehman (Above Fed Mandate) As Rent, Healthcare Costs Soar”

How Much Space Does $1,500 Rent You In America’s Most Populous Cities?

Tyler Durden's picture

While location, location, location is something that is empasized a lot, the best places often come with compromises that are hard to come to terms with – chief among which, the financial matters. Across the 30 most populous US cities, the following chart from CafeRent.com shows how much bang you get for your buck…

(click image for interactive version)


For the record, the proportions in this infographic are correct – if San Diego seems twice as large as San Francisco, it’s because its average price per square foot is half that of the Golden Gate City. And in case you were wondering: yes, the hypothetical Manhattan studio that you’d get for $1,500/month, fits loosely inside the living room of a four-bed, three-bath Memphis home you could rent for the same amount of cash:

In Boston’s 41 Saratoga community, one could rent a 386-square-foot studio unit for that price, and for an extra $100, that space could “grow” to 513 square feet. Although the apartments seem to lack bedroom furniture, they are brand new, featuring open floor plans with hardwood flooring, granite countertops and stainless steel appliances.

In the right column, Southport Crossing in Indianapolis offers three-bed townhome layouts with 2.5 baths in a broad price range topping out at a little over $1,600. The amenities here include a resort-style swimming pool as part of the common space, and individual units come with up to 400 square feet of enclosed patio area.

Read more here at RentCafe.com…


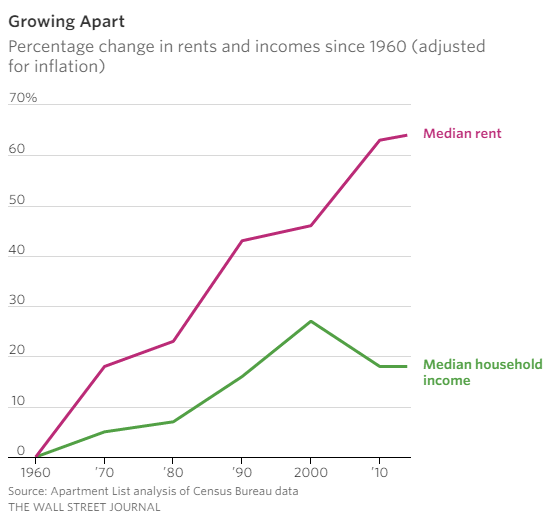
Are renters of today worse off than their parents? Examining rental and household income growth going back to 1960

Guest Post by Dr. Housing Bubble

The rental revolution continues unabated in this country.  While everyone is now trying to be on the home buying train, sales figures don’t really reflect a major shift.  Desires don’t always coincide with what the market is doing.  Prices are largely being driven by tight inventory, investors, and low interest rates.  Prices can be boosted by low rates but rents need to be paid out through real earned income.  This is important to understand especially in Los Angeles County with 10 million people and the majority of households actually being renters.  The reality is, today’s renters are worse off than their parents.  Over the last decade we’ve added 10 million renter households while homeownership has been stagnant – largely by 7 million completed foreclosures.  How bad has the rental situation gotten?

Renters are worse off today

Too poor to buy or even rent.  At least that is the case for millions of Millennials living at home with parents.  Unable to afford even rents, many are staying home.  The data backs this up in a dramatic fashion.  You have anecdotal stories of Taco Tuesday baby boomers sitting on big bucks giving out gifts to kids to buy homes.  While this of course happens, this completely ignores the reality of 2.3 million young adults living at home in California.  Many recent buyers are investors and high income households chasing the low amount of inventory on the market.  For those looking to rent, the market is also intense.

Take a look at rent growth and income growth since the 1960s:

median rent and income Continue reading “Are renters of today worse off than their parents? Examining rental and household income growth going back to 1960”

The Fed has fueled inflation — and it’s helping the rich

Higher stock and real estate prices don’t benefit average Americans

It may come as no surprise that in the aftermath of an epic single-family housing boom and subsequent bust, millions of more people have been renting — without much new multifamily housing supply until recently.

This situation has let to strong gains for apartment REITs and an astonishing ability for property owners to raise rents.

Now a research paper by Rob Arnott and Lillian Wu of Research Affiliates in Newport Beach, Calif. asks why the CPI doesn’t reflect the inflation that is apparent in places where people spend their money.

Arnott and Wu argue that the four biggest expenditures for most people — rent, food, energy, and health care — have been rising. Since 1995, rents have been rising at 2.7% clip, energy at a 3.9%, food at 2.6%, and health care at 3.6%. Notably, these four expenses account for 60% of the aggregate of people’s budgets, 80% of middle-class budgets, and 90% of the budgets of the working poor.

Research Affiliates

Indeed, these Four Horsemen are galloping along, outstripping headline CPI, but it has taken six years of massive government spending, borrowing, and central bank stimulus for real per-capita GDP to regain its pre-recession peak.

Continue reading “The Fed has fueled inflation — and it’s helping the rich”

Consumer Prices Jump Most In Over 3 Years Amid Rising Gasoline, Rent Inflation

Even the liars at the BLS can’t cover-up the raging inflation in gasoline, natural gas, rent, medical expenses, and food. I thought Janet was waiting for a little inflation before raising rates. I guess she’ll need a new excuse not to raise rates as the CPI is rising at an annualized rate of 4.8% according to the bullshit artists at the BLS. It’s over 10% for people living in the real world.

Tyler Durden's picture


Headline CPI rose 0.4% MoM (above +0.3% exp) for the biggest jump since Feb 2013 but sadly at the same time, price-adjusted hourly wages slid 0.1% in April.


Following a small drop in March, from 8 year highs, Core (ex food and energy) Consumer Prices rose 2.1% YoY (as expected) abesent the effect of Gasoline’s huge 8.1% MoM surge.


Of course this is probably transitory but we note that rent inflation remains at 3.7% YoY – its highest since 2008 and definitively not transitory.

Continue reading “Consumer Prices Jump Most In Over 3 Years Amid Rising Gasoline, Rent Inflation”

LIES, LIES AND OMG, MORE LIES

It’s that time of year again. It’s open enrollment for health plans at my employer. They are biggest employer in Philly and have the most leverage possible with the insurance companies. They have such good leverage that my premiums are going up “only” 9.8% this year for a basic HMO plan. Based on what I hear from others, I should be thankful for just a 9.8% increase.

This isn’t a new development. Since I’ve been tracking all my expenditures using Quicken since 1991, I know exactly what my annual health insurance costs have been every year. Obamacare was passed in 2009 and began to be implemented in 2010. Obama declared that families could expect $2,500 of savings per year. I know for a fact my annual medical expenses were $2,000 higher in 2015 than they were in 2010.

Continue reading “LIES, LIES AND OMG, MORE LIES”

This Is Where America’s Runaway Inflation Is Hiding

Tyler Durden's picture

The Census Bureau released its quarterly update on residential vacancies and homeownership for Q1 which is closely watched for its update of how many Americans own versus rent. It shows that following a modest pickup in the homeownership rate in the prior two quarters, US homeowners once again posted a substantial decline, sliding from 63.8% to 63.5%, and just 0.1% higher than the 50 year low reported in Q2 2015.


And perhaps logically, while homeownership continues to stagnate, the number of renters has continued to soar. In fact, in the first quarter, the number of renter occupied houses rose by precisely double the amount, or 360,000, as the number of owner occupied houses, which was a modest increase of 180,000. This brings the total number of renter houses to 42.85 million while the number of homeowners is virtually unchanged at 74.66 million.

Continue reading “This Is Where America’s Runaway Inflation Is Hiding”

This Is What You Spent Your Entire Pay Raise On

Tyler Durden's picture

There has been some muted cheering at the Fed (and the Obama administration) when as a result of numerous statewide minimum wage hikes, average hourly earnings finally started to rise in early 2016, recently hitting a 2% annual increase, even if on a weekly basis they dropped to post-recession lows as the number of hours worked actually dropped confirming the decline in US output continues.

The news is worse if one steps away from government “data” and looks at third party research. According to a recent report by Sentier Research, median income wages rose only 1.4%. As MarketWatch calculates, on the 2015 median income of $56,746, a 1.4% gain would translate to about $66 more a month, before taxes, or about $48 after tax.

Here’s the problem. As we have repeatedly shown in the past, as a result of the death of the US housing dream, which has pushed the homeownership rate to record lows

… and as Americans are either unable to afford a house, or the bank just won’t give them the necessary mortgage, median asking rents have soared to record highs.


Furthermore, as we showed yesterday following the latest monthly CPI report, the cost of rent rose 3.7% compared to a year ago in March. That was the fourth straight month with such a strong gain, the highest since before the financial crisis.


So here’s the math: across the nation, the median rent for a two-bedroom apartment is $1,300, according to Apartment List. So a 3.7% rent rise, or about $48, which means that just the official rise in asking rent prices… swallowed the entire salary “gain”of $48 in after tax dollars.

Oh and that excludes Obamacare: as the government also reported, medial bills soared, in fact in February, medical care grew at the fastest rate in more than three years.

So the next time someone wonders why US households are spending far less than expected, tell them it’s because they need to live, preferably with a roof above their heads..


THE FED CAN’T FIND INFLATION ANYWHERE

The lying pricks at the Federal Reserve give speech after speech about no inflation, keeping rates low, and even blathering about negative interest rates. I guess these idiots don’t need to drive cars, eat food, pay rent, buy houses, or essentially live in the real world. Gas prices are up 22% since mid-February. Food prices are up 6% since early January. Rent has been ratcheting higher at a 4% annual rate for awhile. Home prices have been going up 5% to 10%. Various government taxes, fees and tolls have been accelerating at a 5% to 10% pace. And Yellen can’t find any inflation????

Via Anthony Sanders

CRB Foodstuff Index UP 6% Since Jan 4th (24% Annualized) – It’s Beginning To Look A Lot Like Inflation

It’s beginning to look a lot like inflation.

The Commodity Research Board’s Foodstuff index is up 6% since January 4, 2016. That is just in a little over 3 months. That translates to just under 24% growth on an annualized basis.

foodinf

With US Real Average Weekly Earnings 1982-1984 USD YoY at 0.7%, it really does feel like inflation. Although The Federal Reserve thinks inflation is just shy of 2%.

realweeklyee

When The Federal Reserve conducts their closed meeting today (and meets with President Obama), I certainly hope it is to discuss rising food prices and NOT negative interest rates!

santayellena


Chart Of The Day: Core CPI Gains 2.3% Y/Y—–Most Since October 2008

So we have inflation rising, and we supposedly have a tremendous jobs market, as the unemployment rate is below 5% and unemployment claims are at decade lows. Shouldn’t Janet be raising rates with such numbers? Or does the government and the Fed ignore the numbers because they know it’s all bullshit? The beatings will continue until morale and the net worth improves among the establishment.

Core CPI print has not been higher since October 2008

Rent and shelter inflation soaring.

Even the lying BLS has medical services inflation at 3.9%


GRANNY’S RENT IS GOING UP 8% WHILE HER SOCIAL SECURITY GOES UP 0% NEXT YEAR

Two little blurbs from Marketwatch tell the story of our country today. In case you haven’t noticed, we’re an aging country. Over 15% of the US population is over 65 years old, collecting Social Security. That is approximately 50 million people. Another 10,000 people per day turn 65. Thanks to Alan Greenspan’s bullshit adjustments to the CPI and the apparatchiks at the BLS weighting the index in a ridiculously false manner, senior citizens are getting screwed and have been getting screwed for years.

Your government has the balls to tell your grandma and grandpa they have no inflation, therefore they don’t need an increase in their pitifully small Social Security check. The CPI is a joke. Not only did plunging gasoline prices drive it lower, but the fake owners equivalent rent calculation doesn’t capture the massive surge in home prices. It drastically under weights the cost of health insurance, and purposely under reports the increases in food costs.

Senior citizens don’t drive much, so lower gasoline costs don’t reduce their expenses much. Many live in apartments and rent is likely one of their largest costs. Rent has been going up at 4% to 5% per year, and landlords plan on increasing rents by 8% next year. Food prices will rise. Energy costs are near decade lows, so in all likelihood will rise. We already know the impact of Obamacare. Health related costs are skyrocketing. Senior citizens tend to have a few health issues. Old people aren’t buying iGadgets, 52 inch HDTV flat screens, and the other Chinese produced shit that falls in price.

The cumulative increase in Social Security payments since 2009 is about 6.2%. Think about that for a minute. This is six years. Does anyone believe inflation in the things senior citizens need to survive have only gone up 6.2% in the last six years? You’d have to be a blithering idiot or a Princeton economist to believe that bullshit. In addition to being screwed by the BLS on their Social Security payments, Helicopter Ben threw them under the bus and Grandma Janet is backing the bus over them again with their 0% interest rates on savings. A widowed grandmother with a modest $200,000 retirement nest egg could earn $10,000 of interest in 2008, to supplement her $16,000 of Social Security. Today she can earn $150 of interest, while her SS  has risen to $17,000.

Do you think the demographic trends of 10,000 people per day turning 65, virtually no increase in their Social Security, the vaporization of interest income to save Wall Street bankers, and real inflation in the real world of 5% or more, has anything to do with the terrible retail sales and stagnant economy? Don’t ask a CNBC talking head or Fox News bimbo. Their job is to convince you all is well, while your grandmother is forced to eat Fancy Feast for dinner.

Continue reading “GRANNY’S RENT IS GOING UP 8% WHILE HER SOCIAL SECURITY GOES UP 0% NEXT YEAR”