WHAT DO WE DO NOW?

As this vitriolic, unpredictable, outrageously entertaining presidential campaign enters its final stages I find myself pondering what happens next. I was reminded of the last scene in the 1972 movie, The Candidate. The movie is about a young untested non-politician candidate for U.S. Senator in California who puts his fate in the hands of a veteran political operative and overcomes a double digit polling deficit to win a huge upset victory. His entire focus during the campaign was to win. In the final scene of the movie he is standing among the celebrating campaign staffers and the fawning press corp. with a befuddled look on his face. He grabs his political consultant campaign manager and pulls him into a room. As the press break into the room he asks, “What do we do now?” The question goes unanswered and the movie ends.

The chattering class on the boob tube is enthralled and aghast at every seizure, collapse, and deplorable comment by the two most disliked presidential candidates in U.S. history. The establishment and their corporate media mouthpieces are perplexed and irate that Donald Trump has overcome their propaganda campaign to be leading in the polls with 51 days to go. He is a non-politician who was behind by double digits in the polls a month ago. He hired professional political operatives who have molded his message, while his opponent has been lying about her health, lying about selling access while Secretary of State, and denigrating blue collar middle class Americans in campaign speeches. The momentum is clearly in his favor and absent a major gaffe during the debates he could win an unlikely come from behind victory in November.

Continue reading “WHAT DO WE DO NOW?”

“If Everything’s Going So Great, How Come I’m Not?”

Submitted by Charles Hugh-Smith via PeakProsperity.com,

We’re ceaselessly told/sold that the U.S. economy is doing phenomenally well in our current slow-growth world – generating record corporate profits, record highs in the S&P 500 stock index, and historically low unemployment (4.9% in July 2016).

While GDP growth is somewhat lackluster by historical standards – less than 2% in 2016 – it’s growth nonetheless. And the rate of consumer-price inflation is hovering around 1%; negligible by historical standards.

But this uniformly positive statistical view of the U.S. economy raises a question among those not in the top 0.1%: If everything’s going so great, how come I’m not?

Whether it’s struggling to keep up with the rising cost of living, a 0% return on savings, working longer hours while real wages stagnate, scrimping to pay back education loans, despairing at the abuses of power in our banking and political systems, or lamenting the loss of nourishing social interaction in our increasingly isolated and digital lifestyle – most “regular” people find their own personal experiences to be at odds with the rosy “Everything is awesome!” narrative trumpeted by our media.

The Scorecard

To get a more concrete understanding of this gap, let’s establish a scorecard we can individually fill in to make an assessment of just how well we’re doing.

The key point about such a scorecard is this: We can only optimize what we measure. If we don’t measure (for example) leisure time and well-being in our assessment of Are we doing better than we were 10 years ago? then those issues simply aren’t considered.

And this is the flaw in using broad, easily-fudged statistics such as the unemployment rate as the primary measures of how great we’re doing (or not). What actually matters in life—our experiences, our stress level, our leisure time, our well-being and our sense of security, to name a few—is completely ignored by statistics such as GDP and unemployment.

I propose that a more accurate assessment requires responding to this list: Are you better off than you were 10 years ago in 2007, and 16 years ago in 2000?

Continue reading ““If Everything’s Going So Great, How Come I’m Not?””

A CRISIS IN AMERICAN HOUSING

Guest Post by Dr. Housing Bubble

Americans are realizing something is wrong with the system.  You can see it this year with the rise of outsiders in both political parties.  People realize the system is rigged.  Instead of some folks that kowtow and simply move forward like subservient lemmings, millions are mobilizing and taking action.  Many are voting with their wallets.  The number of renter households has increased by 10 million over the last decade while net homeowners has been stagnant.  The bailouts were supposed to help American families but what happened is that many were kicked out of their homes (for missing payments) and then giving them to banks that also missed much larger payments (too big to fail).  People got a quick education on how things work.  This is why the homeownership rate fell dramatically yet somehow, homes sold to investors and now rents are at all-time highs while incomes are stuck in neutral.  This is a major problem and people are taking notice.

A crisis in American housing

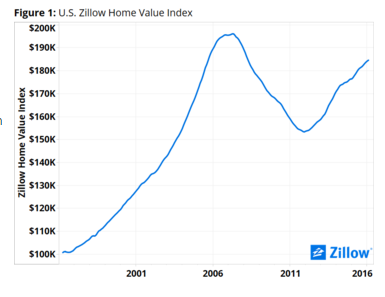
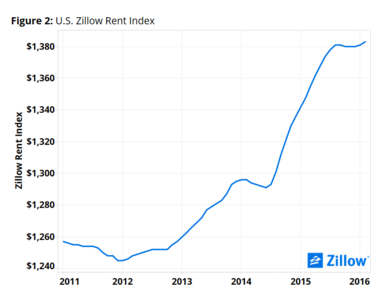
Zillow has some really good research on the topic.  You would think that rising home prices and rising rents would be a sign of more families buying.  Yet it is more of a sign of continued manipulation in the market.  It is also a sign of outside money, either from big investors, Wall Street, or foreign money pushing up values and crowding out regular families from buying.  The Fed has set the stage.  By creating a low interest rate environment, big pools of money are hungry for yield in nearly any sector.

First take a look at home prices:

home price index

Source:  Zillow

The trend is clear and at least in the short-term, prices seem to nearing a plateau.  It is certainly being reflected in rents:

rent index

Continue reading “A CRISIS IN AMERICAN HOUSING”

ANYONE NOTICE THE 22% INCREASE IN GAS PRICES?

It’s funny how the MSM breathlessly reports the decline in gas prices and how it is truly a tremendous savings to the American consumer. But they are strangely silent when gas prices surge by 22% in the last 45 days. Is this somehow beneficial to the American consumer too? Yellen is worried about deflation. Are you? Rents are surging. Home prices are off the charts. Food costs are rising. Obamacare related healthcare cost increases are destroying middle class households. Tuition is increasing. Taxes are higher. Tolls have been increased. And now gasoline prices are skyrocketing. And Yellen doesn’t have the balls to raise rates above .25%. Yeah, she’s working for you alright.


MEANWHILE, WHILE WALL STREET PROFITS & BONUSES REACH ALL-TIME HIGHS….

WINNING!!!!

I thought Bloomberg was a man of the people. I guess just some people.


Explaining NYC’s Record Homelessness In One Disastrous Chart

Tyler Durden's picture

By any measure, New York City’s homelessness crisis broke every record during the final year of the Bloomberg administration. The already record-high homeless shelter population soared even higher, to more than 50,000 people per night. There are, of course, numerous reasons for this disastrous situation but we suspect the following chart, from the coalition of the homeless, may just be enough to wake up the average American to the reality of this ‘recovery’.

Over the past year, the average monthly number of homeless people sleeping each night in the New York City shelter system increased by 7 percent, from 50,135 people in January 2013 to 53,615 people in January 2014 – the highest level ever recorded.


The following are the tragic benchmarks of the past year in New York City:

  • The average number of homeless children living in municipal shelters increased by 8 percent over the prior year, reaching an all-time-high 22,712 children in January 2014.
  • The average number of homeless families in shelters increased by 6 percent over the past year, reaching a record-high 12,724 families in January 2014.
  • The average number of homeless single adults sleeping each night in the New York City shelter system rose five percent to 11,342 women and men in January 2014, a new record. 
  • Average shelter stays for homeless families with children rose by two months (60 days), or 16 percent, during the past year.  The average shelter stay for homeless families with kids reached a record-high 14.5 months (435 days) in January 2014.
  • The average shelter stay for homeless families without children rose to more than 17 months (518 days), the longest ever recorded.  Average shelter stays for childless families in emergency shelter rose by more than a month (34 days), or 7 percent, during the past year. 
  • The number of newly homeless families entering the shelter system, 13,465 families in FY 2013, was 12 percent higher than the previous City fiscal year.
  • More New Yorkers sought emergency shelter: A remarkable 111,210 different men, women and children slept in the shelter system during FY 2013, a five percent increase over the previous City fiscal year.
  • More children slept in NYC’s municipal shelter system:  During FY 2013, City data show 40,189 different girls and boys lived in homeless shelters, a 7 percent increase from the previous City fiscal year.

And this is among the most critical reason why…


Thank you Ben Bernanke… working for Main Street once again


Source: coalition for the homeless