

The premature ejaculators who love to scorn John Hussman for being wrong about the stock market always amuse me with their touchdown dancing before the game is over. Their pea-brains are incapable of understanding stock market cycles, history, basic math, investor psychology, and the lemming like behavior of the highly educated MBA Wall Street crowd. John’s method is designed to outperform the stock market over a COMPLETE bull/bear market cycle.
John’s latest article, Pushing Luck, is filled with facts, figures, charts, and common sense. The usual suspects will ignore the data and crow about Hussman being wrong since 2009. These knuckleheads are too enraptured with their gains through the first half of this bull/bear cycle that they are blinded to the bear portion of the cycle that has just begun. I’m sure they’ll exit gracefully before seeing all their paper gains vaporize.
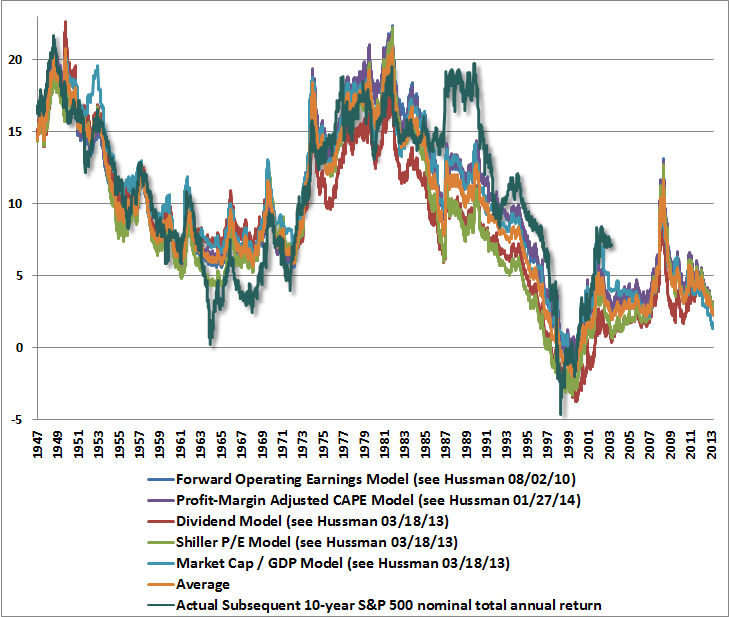
There are a couple of charts and some choice facts that you should be noted in Hussman’s article. Five independent valuation models that have accurately assessed future stock market returns going back over 60 years are all in 100% complete agreement. The S&P 500 will be no higher in 2024 than it is today. I bet Boomers and Xers will not like that news, but reality bites.
There are certain points in history where the projections of S&P 500 total returns have differed somewhat depending on which fundamental measure one uses. At present, a wide range of valuation methods that are actually historically reliable show very little variation. Uniformly, and across fundamentals that have reliably correlated with actual subsequent market returns, we project likely S&P 500 total returns in the range of 1-3% annually over the coming decade. Given a 2% dividend yield, this implies that we fully expect the S&P 500 to be no higher a decade from today than it is at present.
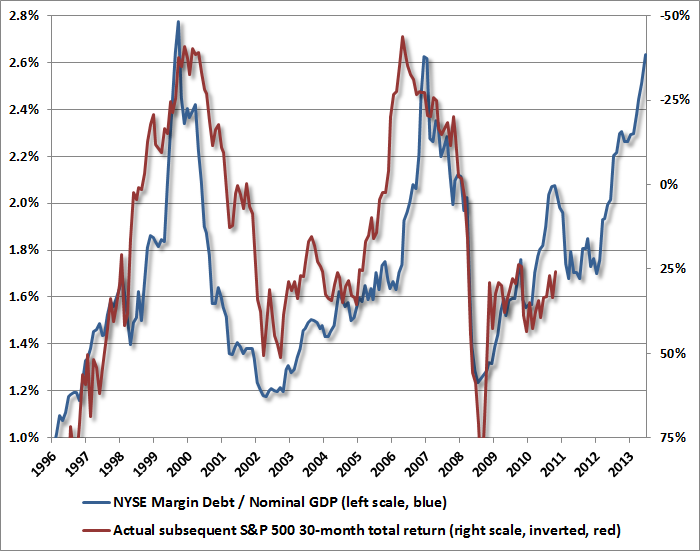
Margin debt continues to rise as the speculative blow-off has arrived. Hussman points out the prior peaks and the subsequent valleys.
Points of rampant speculation on margin strongly overlap points of extreme bullish sentiment and extreme valuation. For that reason, and also because numerous valuation measures have a more direct relationship with subsequent market returns, margin debt is best used as a confirming indicator of cyclical market extremes. Prior spikes in margin debt / GDP in June 1968, December 1972, August 1987, March 2000, and October 2007 were followed by a bear market losses of at least one-third of market value shortly thereafter.
Margin debt to GDP has been a fantastic indicator of stock market returns over the next 30 months. Note that the scale on the right side is inverted and the red line (S&P 500 stock market return) lags the marging debt ratio by 30 months. You can be pretty darned sure that in June of 2017 the S&P 500 will be at least 40% lower than today.
The myopic believers in the this time is different mantra will continue to scorn Hussman until reality sets in. They said the same thing in early 2000 when Hussman predicted negative returns over the next ten years. Returns were negative over the next ten years.The cycle is half over and the lemmings shouldn’t be doing their touchdown dance just yet. History always wins.
Still, nearly all of the current disputes about valuations, profit margins and so forth can be settled by an evaluation of the historical evidence. The unsettled arguments are the ones that require the present to depart from history against a century of evidence. There are two main beliefs here: that profit margins will remain elevated dramatically above norms that have been revisited in every cycle, including the two most recent ones; and that strenuously overvalued, overbought, overbullish conditions can be sustained indefinitely. These beliefs are identical to those in 2007 that we thought were settled by the 55% market plunge that followed. Investors have become speculators, and now rely on both, in the face of the same conditions that have repeatedly emerged at the most memorable market peaks in history.

There’s no fault in his analysis of the data… thanks for sharing this.
Another sign all is not well, and is trending lower for the future:
Walmart warns of weakness in Q4
The US retail giant unleashed something of a shockwave earlier today, offering an unscheduled update on Q4 trading. Unscheduled updates are never going to be good news, and so it proved. The business warned that “underlying EPS for the fourth quarter of fiscal 2014 will be at or slightly below the low end of [its] range of USD1.60-1.70.” So, by all accounts a profits warning.
In case the article requires a login, it goes on to state that consumers have not only had to tighten their belts, but many have also been forced to lower-cost “dollar stores.” It also points out that Sam’s Club, the bright spot in the early days of the recession, is showing the effects of the downturn. PlanetRetail admits that weather can only be partially blamed for bad results and suggests a greater, structural weakness in the economy.
“when disillusion falls upon an overoptimistic and overbought market, it should fall w/ sudden & catastrophic force”
John Maynard Keynes