

A most interesting thread popped up on Twitter Sunday from a data scientist who wishes to remain anonymous, regarding mail-in ballot data which strongly suggests fraud occurred in the wee hours of election night, when several swing states inexplicably stopped reporting vote counts while President Trump maintained a healthy lead over Joe Biden.
Using time series data ‘scraped’ from the New York Times website, the data – comparing several states (swing and non-swing) – clearly illustrates what fraud does and does not look like, and how several anomalies in swing states left ‘fingerprints of fraud’ as Biden pulled ahead of President Trump.
Presented below via @APhilosophae:
The following information is provided via an anonymous data scientist and another anonymous individual who wrote a script to scrape the national ballot counting time series data of off the @nytimes website.
— CulturalHusbandry (@APhilosophae) November 9, 2020
Continued…
This is based on their proprietary “Edison” data source which would ordinarily be impossible to access for people outside the press. The CSV is available here. And the script to generate it is here. I suggest that everyone back up both of these files, bc this is an extremely important data source, and we cant risk anyone taking it down.
What we are looking at will be time series analysis and you will see that it is extremely difficult to create convincing synthetic times series data. By looking at the times series logs of the ballot counting process for the entire country, we can very easily spot fraud.
One of the first things noticed while exploring the dataset is that there seems to be an obvious pattern in the ratio of new #Biden ballots to new #Trump ballots.
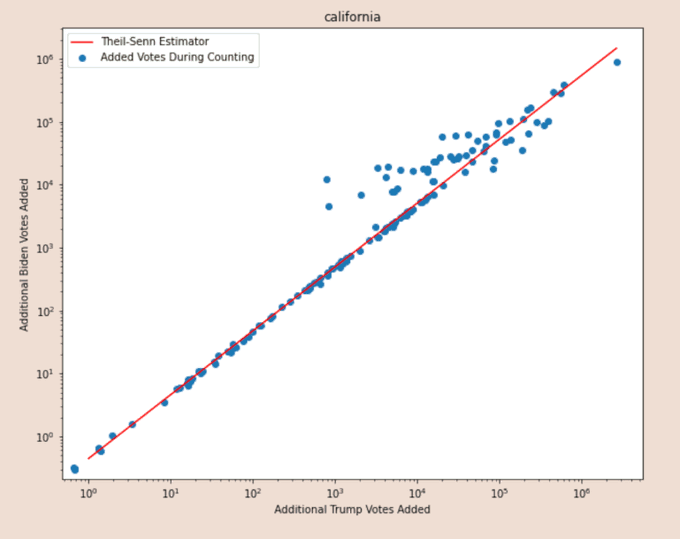
As we can see on this log-log plot, for many of the counting progress updates, we see an almost constant ratio of #Biden to #Trump. It’s such a regular pattern that we can actually fit a linear regression model to it with near-perfect accuracy, barring some outliers. How could this be possible? Is this a telltale sign of fraud? Surprisingly, as it will be shown, the answer is no! This is actually expected behavior. Also, we can use this weird pattern in the ballot counting to spot fraud!
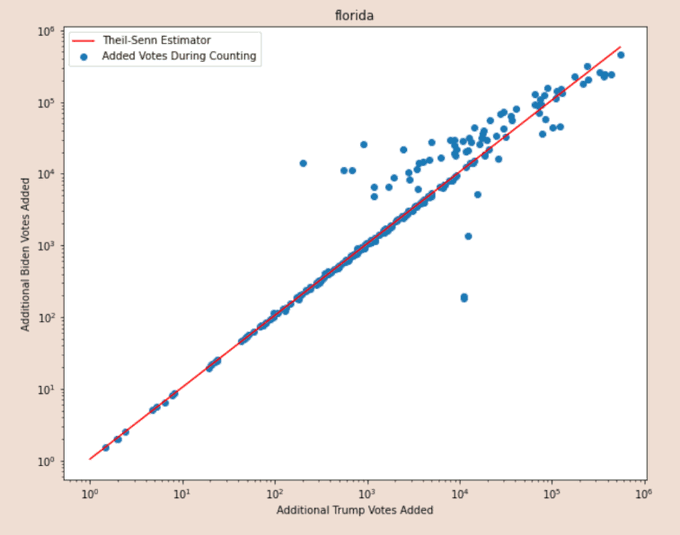
Here is the same pattern for Florida. We see this linear pattern again.
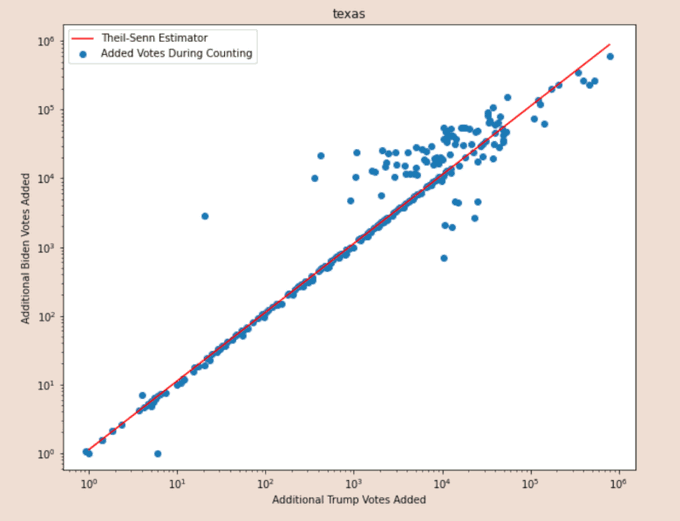
And again (Texas)
And again (South Dakota)
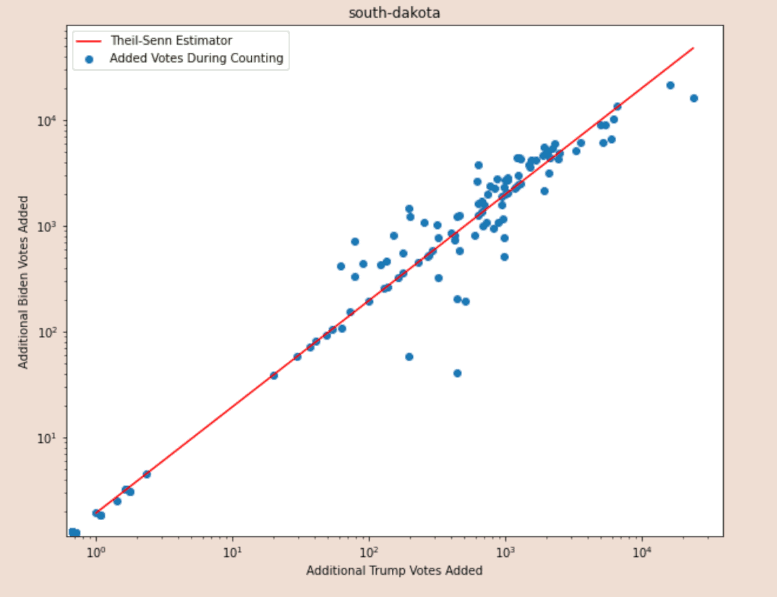
And again all over the country. What appears to be happening is that points on the straight line are actually mail in votes. The reason they’re so homogeneous across with respect to the ratio of #Biden vs #Trump votes is that they get randomly shuffled in the mail like a deck of cards. Since the ballots are randomly mixed together during transport, spanning areas occupied by multiple voting demographics, we can expect the ratio of mail-in #Biden ballots to mail-in #Trump ballots will remain relatively constant over time and across different reporting updates.
Lets dig a little deeper into this:
Here is a plot of the same Florida voting data, but this time it’s the ratio of #Biden to #Trump ballots, versus time. What we see is that the initial ballot reportings are very noisy and “random”.
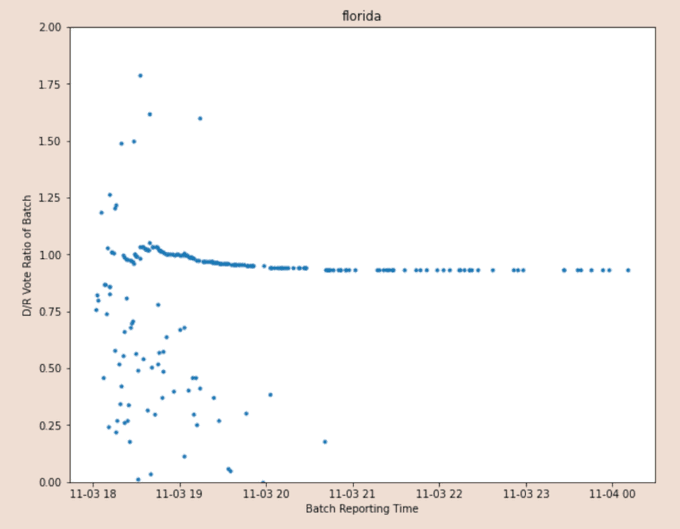
The initial reporting represents in-person voting. These vote reports have such large variation bc in-person voting happens across different geographic areas that have different political alignments. We can see this same pattern of noisy in-person voting, followed by homogeneous mail-in reporting in almost all cases. What we see in almost all examples across the country is that the ratio of mail-in Dem to Rep ballots is very consistent across time, but with the notable drift from Dem to slightly more Rep.
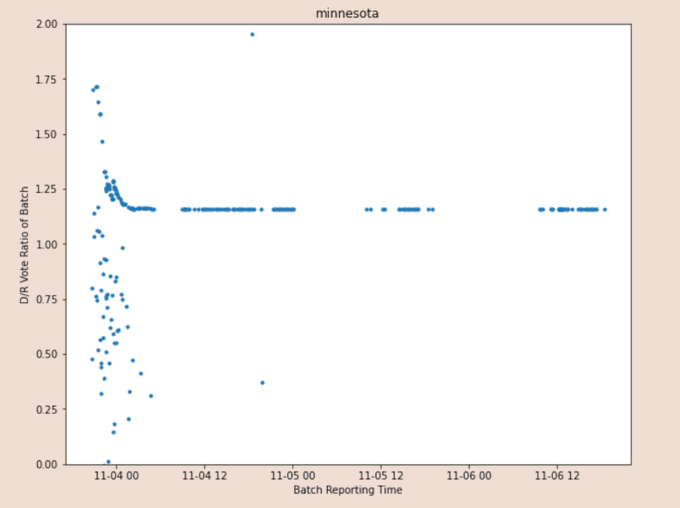
This slight drift from D to R mail-ins occurs again and again, and is likely due to outlying rural areas having more R votes. These outlying areas take longer to ship their ballots to the polling centers.
Now we’re getting into the really good stuff. When we see mail-in ballot counting where there isn’t relatively stable ratios of D and R ballots that slightly drift R, we have an anomaly! Anomalies themselves are not necessarily fraud, but they can help us spot fraud more easily.
Now let’s look at some anomalies:
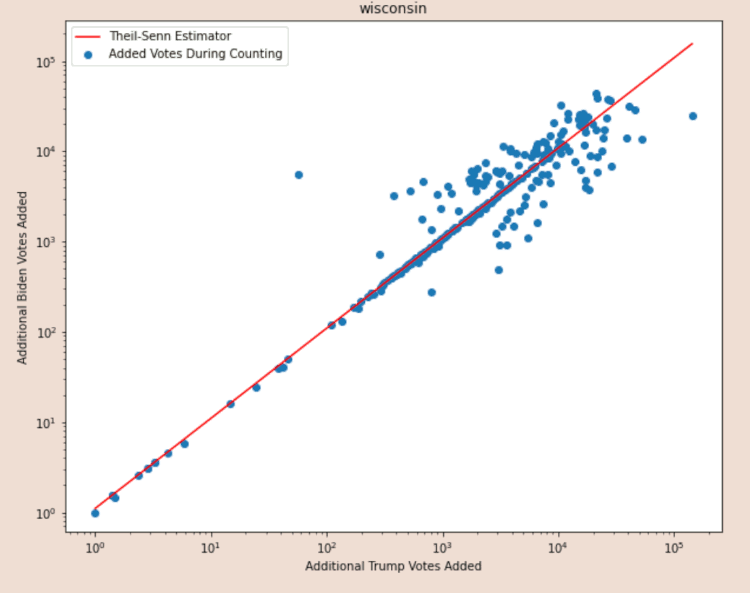
This is the Wisconsin vote counting history log. Again, on the Y axis we have the ratio of D to R ballots in reporting batch, and on the X axis we have reporting time. Around 4am there, there is a marked shift in the ratio of D to R mail-in ballots. Based on other posts in this thread, this should not happen. This is an anomaly, and while anomalies are not always fraud, often they may point to fraud.
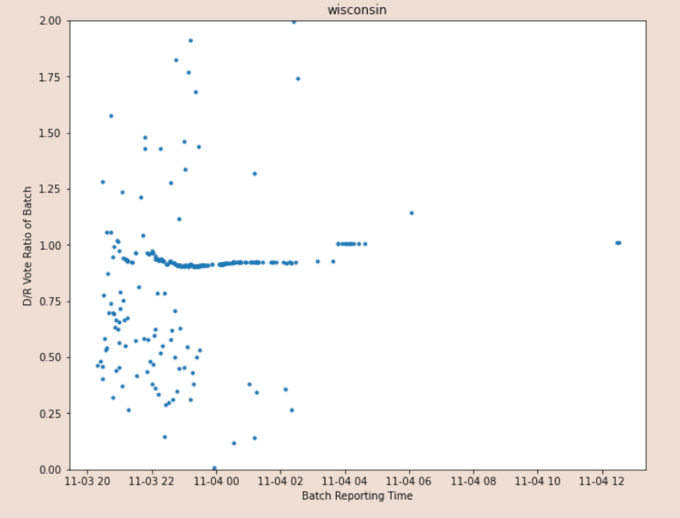
Around 4am there, there is a marked shift in the ratio of D to R mail-in ballots. Based on other posts in this thread, this should not happen. This is an anomaly, and while anomalies are not always fraud, often they may point to fraud.
— CulturalHusbandry (@APhilosophae) November 9, 2020
By 4am the D to R ratio was all thrown out of whack. That is because these ballots were not sampled from the real Wisconsin voter population, and they were not randomized in the mail sorting system with the other ballots. They inherently have a different D to R signature than the rest of the ballots quite possibly bc additional ballots were added to the batch, either through backdating or ballot manufacturing or software tampering. This of this being kind of analogous to carbon-14 dating, but for ballot batch authenticity.
Lets look at another anomaly (Pennsylvania):
Here is Pennsylvania’s vote counting history. For the first part of the vote counting process, we see the same pattern for mail-in ballots that we’ve seen in every other state in the country, which is relatively stable D to R ratio that gradually drifts R as more ballots. But then as counting continues, the D to R ratio in mail-in ballots inexplicably begin “increasing”. Again, this should not happen, and it is observed almost nowhere else in the country, because all of the ballots are randomly shuffled in the mail system and should be homogeneous during counting. The only exceptions to this are other suspect states that also have anomalies.
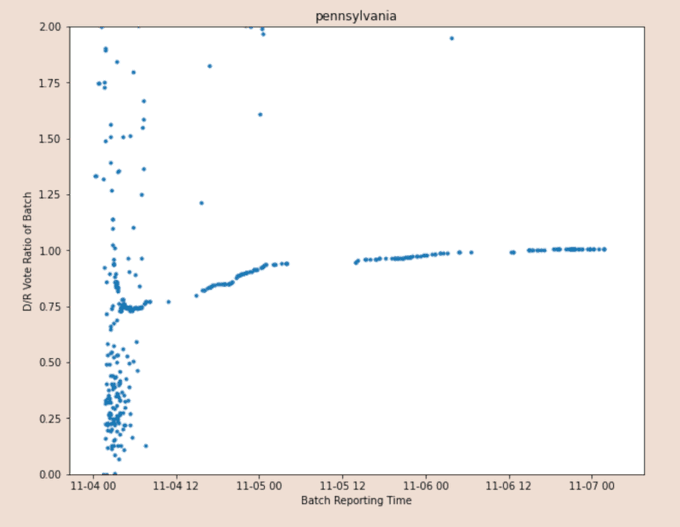
Again, this is evidence of ballot backdating, manufacturing of software tampering.
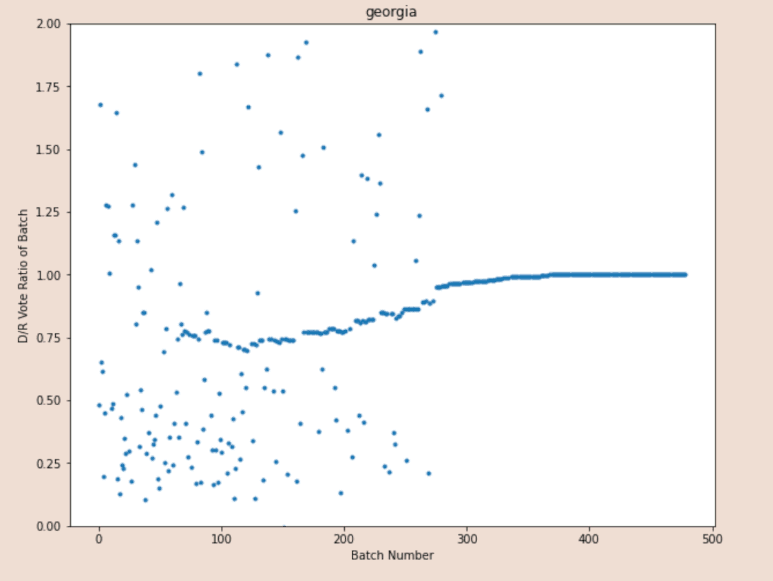
Lets look at another anomaly:
In Georgia we see pretty much the same story as Pennsylvania: increasing fractions of mail-in D ballots over time even though it defies logic and we see this pattern no where else in the country.
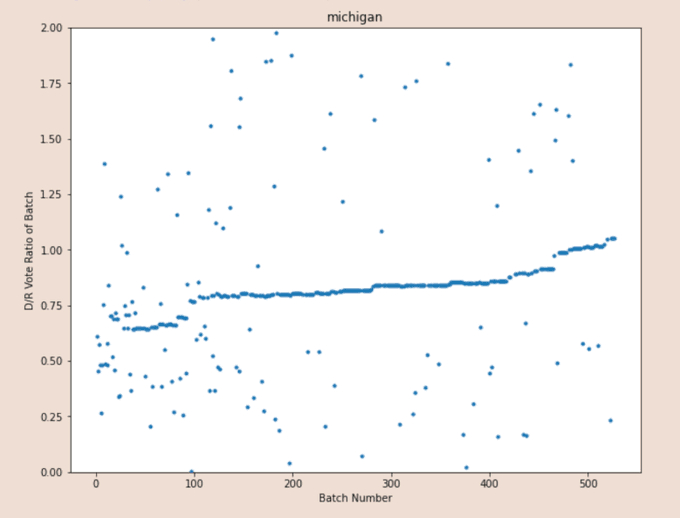
In Michigan, we see a combination of Wisconsin strangeness, together with the GA/PA weirdness. We see both signs of contaminated ballot dumping, and ballot ratios drifting toward dems when they should not be.
Virginia:
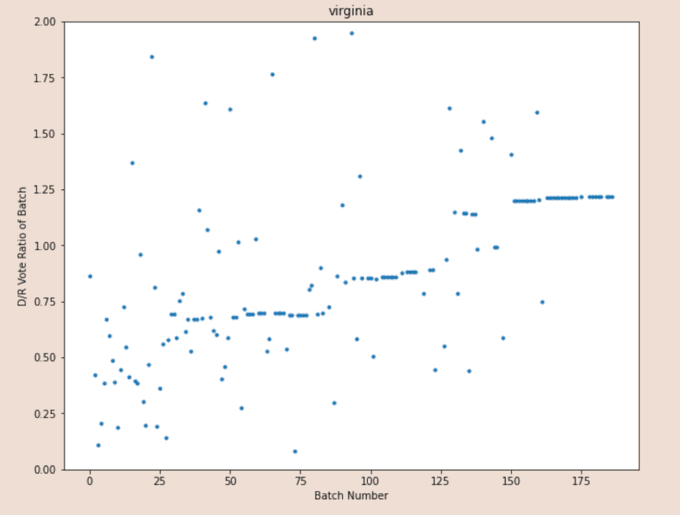
Now in fairness, VA is the only state out of the 50 that has anomalies but has not had accusations of voter fraud, yet. I think this is the exception that proves the rule. Yet to figure out what causes this anomalous shift, but here it is so no one accuses me of holding it back.
Lets wrap this up: It appears Dems shot themselves in the foot bc making everyone do mail-in ballots actually makes it easier to catch mail-in ballot fraud. Bc all of the ballots go through the postal system, they get shuffled like a deck of cards, so we expect reported ballot return to be extremely UNIFORM in terms of D vs R ratio, but to drift slightly towards R over time bc some of those ballots travel farther. This pattern proves fraud and is a verifiable timestamp of when each fraudulent action occurred.
It is my sincere desire to provide readers of this site with the best unbiased information available, and a forum where it can be discussed openly, as our Founders intended. But it is not easy nor inexpensive to do so, especially when those who wish to prevent us from making the truth known, attack us without mercy on all fronts on a daily basis. So each time you visit the site, I would ask that you consider the value that you receive and have received from The Burning Platform and the community of which you are a vital part. I can't do it all alone, and I need your help and support to keep it alive. Please consider contributing an amount commensurate to the value that you receive from this site and community, or even by becoming a sustaining supporter through periodic contributions. [Burning Platform LLC - PO Box 1520 Kulpsville, PA 19443] or Paypal
-----------------------------------------------------
To donate via Stripe, click here.
-----------------------------------------------------
Use promo code ILMF2, and save up to 66% on all MyPillow purchases. (The Burning Platform benefits when you use this promo code.)


Will it matter?
and yet, talking to a very intelligent friend and former colleague, who is generally skeptical of all politicians, i am surprised to find that 4 years of pervasive anti-trump propaganda has gotten him to say ‘well perhaps he just lost support after people saw how he was president’ … and he somehow refuses to see anything unusual in the graphs above!
the ideological blinders have been sold amazingly well to people.. the very existence of mass media is one of the most evil things in the history of humanity and one of the biggest tools in the hands of the enemies of humanity.
They can’t see if they don’t look, and they have no reason to want to look. Besides, just because a guy is standing with a smoking pistol in his hand over the dead and bleeding body of his mortal enemy doesn’t mean he shot the guy. The dead guy might have shot himself while throwing the gun into the air and then the other guy might have caught the gun in mid-air right before he was seen. That could totally happen.
Did you see the stock market along with the vaccine news? Of course you all did. What we have witnessed is the high tech. assassination of this era’s JFK. It truly is that simple. And they will get away with it. For the last eight weeks . I had been writing …. ‘They will steal this election. Mark my words.’ And they have. The globalists are firmly in control. They have demonstrated this over the last week. Just the way it is.
But are they firmly in control? I think this is on a knife’s edge……and Trump could still pull it out. Assuming he doesn’t….then shut the FUCKING USA DOWN…..everything. Looks the truckers got the memo.
https://www.theorganicprepper.com/trucker-strike-november/
There’s a . . . I hate this overused term but I think it applies here . . . conspiracy theory going around that says this is all smoke and mirrors, that the elites ensured the fraud was obvious and idiotic so that the courts would have no alternative but to overturn the election and award it to Trump. This would guarantee leftist hysterics and ongoing violence in the big cities, thereby tearing apart the United States, which is what the oligarchs want. I think that’s a stretch but for anyone interested here’s a recent article advocating this theory:
https://www.naturalnews.com/2020-11-08-globalists-are-maneuvering-trump-right-into-the-dictator-scenario.html
Bob, you were saying earlier about being a statistician earlier, unless I’m mistaken, and if so please forgive; but based on just what an admittedly small amount of hard data is showing, what’s your take on this?
I never took advanced math courses, but I can add/subtract/divide/multiply well enough to have lived 50+ years — and from what I can understand, these people cannot possibly believe these numbers can stand up to inquiry. Unfortunately, I remember the blind eyes people took in regards to 9/11, so…
Where do I need to start shooting?
The stats here are elementary; the main charts are merely a ratio of D to R ballots over time. As the author states, they should form a fairly straight line since the mailing system should randomly sort them like shuffling a deck of cards. That is, there’s no reason the ratio should differ much from one time to the next, except for minor factors such as Republicans tending to live in more rural areas so the ballots might take a bit longer to arrive where ballots are counted; so, if anything, the ratio of D to R should fall a bit over time. But here the ratio in every state suddenly jumps after the polls are closed. There is no valid reason for this to occur, unless Democrats en masse waited till the last minute to mail their ballots. That this would happen in every swing state defies belief. The anecdotal evidence suggested that Democrat ballots were dumped in during the wee hours of the morning (e.g., Democrat-only tranches numbering in the thousands of ballots). This proves it (assuming the data are genuine).
Or perhaps once the polls closed a list of registered voters who did not vote was used to provide votes favorable to the Democrat party candidate? Some data suggest that many ballots only had Biden marked and no down ballot candidates (total number of votes of presidential candidates and down ballot candidates were widely unequal).
As far as stats go, all I did was compare the down ballot voting. Over 90% of voters go straight ticket. Republican down ballot votes held to the norms in the Red areas & Dems. did basically likewise except where the repubs. pulled out a win. There would have to be an excessive amt. of split tickets. Why would any liberal voter go for Biden/Harris but vote the rest of the ticket Repub.?? I could see a “never Trumper” doing that.
Yeah Brandon over at alt market called this outcome before it happened for the same reason. The chaos and strife it will cause is ideal for TPTB.
That was me..
This article is the most persuasive evidence of vote-counting fraud I have seen to date. Bravo to the “data scientist” behind it.
I just look at all the results with rep winning across the board, except for the guy heading the ticket.
Search on “election fraud forensics” if you want to learn about other techniques.
Is it that difficult to type ‘because’?
And that’s what you took from all that to comment on?
Hang around, you make my comments look good.
T
The ballots that went thru the postal system were photographed and counted by the USPS, easy to check. They will also have pictures of the ballots that couldn’t be delivered (dead/moved/etc) and returned to the elections departments, just check those and see if they “somehow” ended up voting.
Familiar with USPS’ free “Informed Delivery” offering in certain areas of the country? Early in the day an image of your residential mail to be delivered later that day is available online for your viewing pleasure. Funny thing in our area: Informed Delivery has not been working very often in the last 2 weeks.
The mail in ballots were expected to skew towards Biden, since Trump told his supporters to vote in person. This data shows just that. We cannot assume that mail in ballots would have the same ratio as in person voting. This is an important variable that is not mentioned in this article. Therefore, your conclusion is flawed.
The point that the ratio of Biden to Trump mail-in ballots should be mainly constant over time, as the ballots all get shuffled in the mail. Instead, the ratio of Biden to Trump mail-in ballots suddenly jumps out of nowhere. Read the descriptions of the data more carefully.
I’d need to see county-by-county breakdowns. Right now you’re assuming that ALL mail-in ballots to ALL locations within a state are mixed together. However, the earlier batches will include more data from smaller counties where the counting ended earlier, and later batches will include more data from larger counties where the counting ended later.
Where did you get your data?