

The middle class, once the economic stratum of a clear majority of American adults, has steadily contracted in the past five decades. The share of adults who live in middle-class households fell from 61% in 1971 to 50% in 2021, according to a new Pew Research Center analysis of government data.
From 2020: Are you in the American middle class? Find out with our income calculator
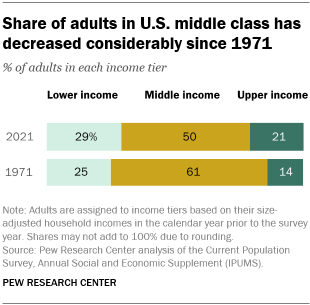
The shrinking of the middle class has been accompanied by an increase in the share of adults in the upper-income tier – from 14% in 1971 to 21% in 2021 – as well as an increase in the share who are in the lower-income tier, from 25% to 29%. These changes have occurred gradually, as the share of adults in the middle class decreased in each decade from 1971 to 2011, but then held steady through 2021.
The analysis below presents seven facts about how the economic status of the U.S. middle class and that of America’s major demographic groups have changed since 1971. A related analysis examines the impact of the coronavirus pandemic on the financial well-being of households in the lower-, middle- and upper-income tiers, with comparisons to the Great Recession era. (In the source data for both analyses, demographic figures refer to the 1971-2021 period, while income figures refer to the 1970-2020 period. Thus, the shares of adults in an income tier are based on their household incomes in the previous year.)
Household incomes have risen considerably since 1970, but those of middle-class households have not climbed nearly as much as those of upper-income households. The median income of middle-class households in 2020 was 50% greater than in 1970 ($90,131 vs. $59,934), as measured in 2020 dollars. These gains were realized slowly, but for the most part steadily, with the exception of the period from 2000 to 2010, the so-called “lost decade,” when incomes fell across the board.
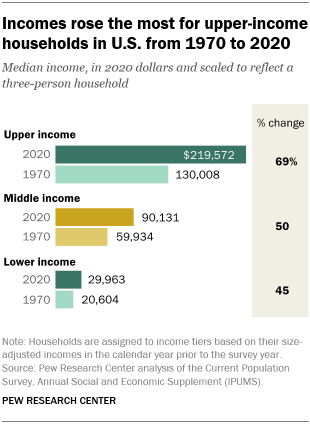
The median income for lower-income households grew more slowly than that of middle-class households, increasing from $20,604 in 1970 to $29,963 in 2020, or 45%.
The rise in income from 1970 to 2020 was steepest for upper-income households. Their median income increased 69% during that timespan, from $130,008 to $219,572.
As a result of these changes, the gap in the incomes of upper-income and other households also increased. In 2020, the median income of upper-income households was 7.3 times that of lower-income households, up from 6.3 in 1970. The median income of upper-income households was 2.4 times that of middle-income households in 2020, up from 2.2 in 1970.
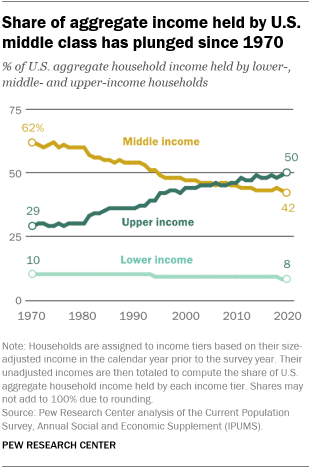
The share of aggregate U.S. household income held by the middle class has fallen steadily since 1970. The widening of the income gap and the shrinking of the middle class has led to a steady decrease in the share of U.S. aggregate income held by middle-class households. In 1970, adults in middle-income households accounted for 62% of aggregate income, a share that fell to 42% in 2020.
Meanwhile, the share of aggregate income accounted for by upper-income households has increased steadily, from 29% in 1970 to 50% in 2020. Part of this increase reflects the rising share of adults who are in the upper-income tier.
The share of U.S. aggregate income held by lower-income households edged down from 10% to 8% over these five decades, even though the proportion of adults living in lower-income households increased over this period.
Older Americans and Black adults made the greatest progress up the income ladder from 1971 to 2021. Among adults overall, the share who were in the upper-income tier increased from 14% in 1971 to 21% in 2021, or by 7 percentage points. Meanwhile, the share in the lower-income tier increased from 25% to 29%, or by 4 points. On balance, this represented a net gain of 3 percentage points in income status for all adults.

Those ages 65 and older made the most notable progress up the income ladder from 1971 to 2021. They increased their share in the upper-income tier while reducing their share in the lower-income tier, resulting in a net gain of 25 points. Progress among adults 65 and older was likely driven by an increase in labor force participation, rising educational levels and by the role of Social Security payments in reducing poverty.
Black adults, as well as married men and women, were also among the biggest gainers from 1971 to 2021, with net increases ranging from 12 to 14 percentage points.
On the other hand, not having at least a bachelor’s degree resulted in a notable degree of economic regression over this period. Adults with a high school diploma or less education, as well as those with some college experience but no degree, saw sizable increases in their shares in the lower-income tier in the past five decades. Although no single group of adults by education category moved up the income ladder from 1971 to 2021, adults overall realized gains by boosting their education levels. The share of adults 25 and older who had completed at least four years of college stood at 38% in 2021, compared with only 11% in 1971.
Progress up the income ladder for a demographic group does not necessarily signal its economic status in comparison with other groups at a given point in time. For example, in 2021, adults ages 65 and older and Black adults were still more likely than many other groups to be lower income, and less likely to be middle or upper income.
Married adults and those in multi-earner households made more progress up the income ladder from 1971 to 2021 than their immediate counterparts. Generally, partnered adults have better outcomes on a range of economic outcomes than the unpartnered. One reason is that marriage is increasingly linked to educational attainment, which bears fruit in terms of higher incomes.
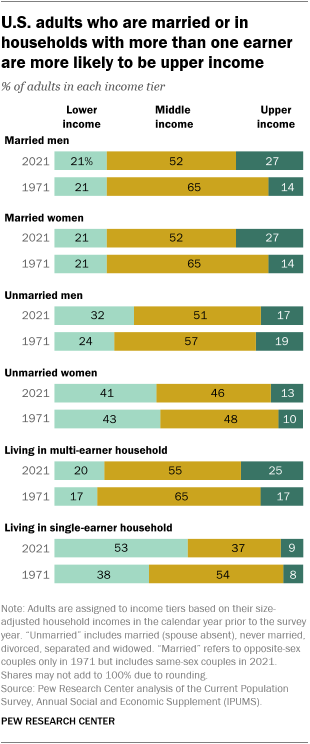
Married men and women were distributed across the income tiers identically to each other in both 1971 and 2021. Both groups nearly doubled their shares in the upper-income tier in the past five decades, from 14% in 1971 to 27% in 2021. And neither group experienced an increase in the share in the lower-income tier.
Unmarried men and women were much more likely than their married counterparts to be in the lower-income tier in 2021. And unmarried men, in particular, experienced a sizable increase in their share in the lower-income tier from 1971 t0 2021 and a similarly large decrease in their share in the middle-income tier. Nonetheless, unmarried men are less likely than unmarried women to be lower income and more likely to be middle income.
Adults in households with more than one earner fare much better economically than adults in households with only one earner. In 2021, some 20% of adults in multi-earner households were in the lower-income tier, compared with 53% of adults in single-earner households. Also, adults in multi-earner households were more than twice as likely as adults in single-earner households to be in the upper-income tier in 2021. In the long haul, adults in single-earner households are among the groups who slid down the income ladder the most from 1971 to 2021.
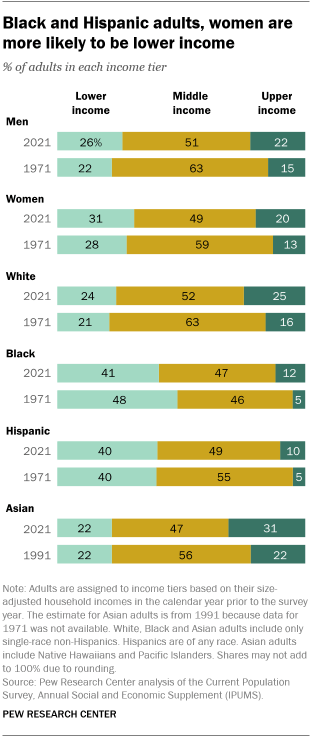
Despite progress, Black and Hispanic adults trail behind other groups in their economic status. Although Black adults made some of the biggest strides up the income tiers from 1971 to 2021, they, along with Hispanic adults, are more likely to be in the lower-income tier than are White or Asian adults. About 40% of both Black and Hispanic adults were lower income in 2021, compared with 24% of White adults and 22% of Asian adults.
Black adults are the only major racial and ethnic group that did not experience a decrease in its middle-class share, which stood at 47% in 2021, about the same as in 1971. White adults are the only group in which more than half (52%) lived in middle-class households in 2021, albeit after declining from 63% in 1971. At the top end, only about one-in-ten Black and Hispanic adults were upper income in 2021, compared with one-in-four or more White and Asian adults.
The relative economic status of men and women has changed little from 1971 to 2021. Both experienced similar percentage point increases in the shares in the lower- and upper-income tiers, and both saw double-digit decreases in the shares who are middle class. Women remained more likely than men to live in lower-income households in 2021 (31% vs. 26%).

Adults 65 and older continue to lag economically, despite decades of progress. The share of adults ages 65 and older in the lower-income tier fell from 54% in 1971 to 37% in 2021. Their share in the middle class rose from 39% to 47% and their share in the upper-income tier increased from 7% to 16%. However, adults 65 and older are the only age group in which more than one-in-three adults are in lower-income households, and they are much less likely than adults ages 30 to 44 – as well as those ages 45 to 64 – to be in the upper-income tier.
All other age groups experienced an increase in the shares who are lower income from 1971 to 2021, as well as a decrease in the shares who are middle income. But they also saw increases in the shares who are upper income. Among adults ages 30 to 44, for instance, the share in upper-income households almost doubled, from 12% in 1971 to 21% in 2021.
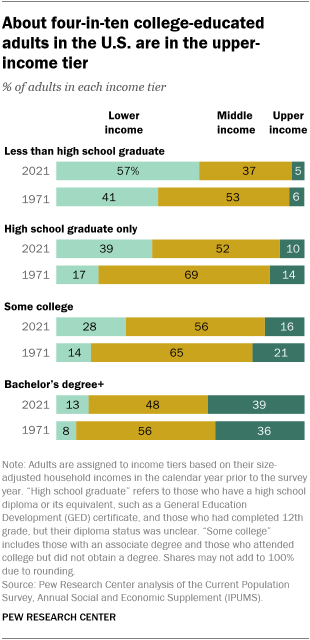
There is a sizable and growing income gap between adults with a bachelor’s degree and those with lower levels of education. In 2021, about four-in-ten adults with at least a bachelor’s degree (39%) were in the upper-income tier, compared with 16% or less among those without a bachelor’s degree. The share of adults in the upper-income tier with at least a bachelor’s degree edged up from 1971 to 2021, while the share without a bachelor’s degree either edged down or held constant.
About half or a little more of adults with either some college education or a high school diploma only were in the middle class in 2021. But these two groups, along with those with less than a high school education, experienced notable drops in their middle class shares from 1971 to 2021 – and notable increases in the shares in the lower-income tier. In 2021, about four-in-ten adults with only a high school diploma or its equivalent (39%) were in the lower-income tier, about double the share in 1971.
Note: Here is the methodology for this analysis.
It is my sincere desire to provide readers of this site with the best unbiased information available, and a forum where it can be discussed openly, as our Founders intended. But it is not easy nor inexpensive to do so, especially when those who wish to prevent us from making the truth known, attack us without mercy on all fronts on a daily basis. So each time you visit the site, I would ask that you consider the value that you receive and have received from The Burning Platform and the community of which you are a vital part. I can't do it all alone, and I need your help and support to keep it alive. Please consider contributing an amount commensurate to the value that you receive from this site and community, or even by becoming a sustaining supporter through periodic contributions. [Burning Platform LLC - PO Box 1520 Kulpsville, PA 19443] or Paypal
-----------------------------------------------------
To donate via Stripe, click here.
-----------------------------------------------------
Use promo code ILMF2, and save up to 66% on all MyPillow purchases. (The Burning Platform benefits when you use this promo code.)


I used to enjoy your website but it is now so crowded with ads blocking the content that I can’t be bothered anymore. Goodbye
If you are too stupid to download a free adblocker, I don’t want you on the site.
Don’t let the door hit you in the ass on the way out.
I think the exit door should be specifically engineered TO hit people in the ass on the way out. Forcefully. With hydraulic hinges!! Furthermore, I would recommend an array of rusty sharp iron claws and maybe an electric cattle prod or three, mounted on the door’s striking surface. Additionally, a greased aluminum sidewalk featuring a steep downward slope leading to a pool of used motor oil could be installed just for fun.
for any other “stupid” people out there, I just started using “Ghostery” and it’s working really well
If using firefox add on NoScript.
Brave browser is great at blocking ads.. This site is my first visit everyday. Than you admin!
Kevin, does it still hurt? Where your mom dropped you on your head?
Everyone with an IQ above room temperature knows how to get around ads, and everyone who has ever complained about it has been told how to do it, yet here you are, pitching a hissy fit because you can’t be bothered.
You’re not really here for the fine articles, are you?
I have not downloaded an ad blocker and it has become a sort of a game. How much can I still read with 6 windows popping up everywhere? It trains my focus to ignore “Find the right speakers for your live sound needs” and “Gorgeous women looking to chat with mature men”. Fun! I don’t get much entertainment otherwise.
If it wasn’t for this place, I might have already lost my sanity. Your loss, Kevin, if you do not appreciate that.
I haven’t downloaded an ad blocker either. I just deal with it. Looks like we’re too stupid to be here, Svarga. 😂
Or our svelte physique has allowed us to dodge the door repeatedly, making us uniquely suited to stick around here.
Admin isn’t calling anyone stupid if they don’t use an ad blocker. He’s calling those who complain about ads and doing nothing about it stupid for not knowing how.
Thx…Not a fine distinction either…
Same. The beige box with “No Stories” kind of threw me, but at work we cut through tech issues with bandaids. It works. It’s challenging and fun!
See that bottom line in every graph that says ‘lower income’, that’s where Klaus and his pals want all of us to be, and to be happy about being there (or else)
Now that is a great reply. Thanks
You’re welcome.
I aim to please.
Cable tv became prevalent about 50 years ago, also computer/Internet came into household not long after . It has been downhill since all this “Information” invaded the American household. The more information and ability to access this information has made us STUPID. Cable news, the constant drone of consumerism and immorality is thanks to 24/7/365 piped in tv poison.
And now we whine that folks are broke, our government is a joo commie adversary and we are godless physically sick morans afraid of our own shadow. Clean it up or live in this filth, it’s that simple.
Oh Bea, I just love it when your forceful like that.
Mornin’ Flea- Thanks, that and $5 will buy you a small coffee at the beanery.
I don’t know, BL, but it kinda sounds like you want to agree with me from yesterday…but you just don’t want to tell me so. That’s ok, I can read between the lines. 😉
AA- I’ll agree with you if you’ll agree with me……Mmkaay? 🙂
Let’s just agree with Gump, “Stupid is as stupid does”. And the Zionist Elders are “WINNING”.
Agreed.
Some of us “Human Beans” have more value than others, depends which cap you wear.
If I cut the bill off of my Bass Pro cammo ball cap, it would kind of look like a yarmulke.
Just do it Red! You could go from lowly goy to “WINNING” overnight.
From Wiki below: 1976, and we still have the same basic problems from 45 plus years ago. I use this scene sometimes in my job to get people off dead center.
Those 3 categories are too generalized to see the bigger picture trends. The main trend is – and always has been – the rich get richer and the poor get poorer. The middle class? They are just the population segment who are literally in the middle, and it does not matter if over time some of them have slowly migrated to another side of those two imaginary and arbitrary dividing lines.
What matters is – what has been happening to the standard of living for all those people? Does their income buy more, less or the same in 2021 vs. 1971 ? We all know the answer….and it’s not in this article.
What is the dividing line between those whose purchasing power improved in that timeframe vs. those whose purchasing power diminished? That’s the stat I’d like to know. My guess is that it’s somewhere around the 90th to 95th percentile meaning standard of living improved for only 5 to 10% of the population over that time, and declined for the other 90 to 95%.
Middle should not be a goal. Rather it’s a stopover.
In every statistic presented the upper grew more than the lower while the middle shrank. That is despite importing millions of 3rd world poor non-English speaking illegals.
To me, those graphs are a good sign.
They’re stupider , by degrees, for one…
Future Democrat Congresswomen.
One degree stupider than a 10 ounce silver bar versus a snickers bar. But green dress is cute, maybe she’ll get lucky and marry rich.
Call me stupid if you like, my skin is as tough as a brand new baseball mitt but I don’t see a problem with any of this. The biggest gains for every demographic are moving up the economic scale. The poorest are moving up by just a couple of percentage points. And the middle class are a firm 50% which I also don’t have a problem with. If the rich were static, the middle was shrinking and the poor were growing by double digit percentage points, maybe you’d have something to worry about. This is literally a nothing burger.
The problem is not what the data is showing, it’s what the data is NOT showing. See my post above.
I was nimble enough to avoid the door hitting me in the arse (correct spelling). I took your advice and it’s working well thank you. May I come back now please?
Bring coffee and donuts every Saturday for a month.
And don’t ever throw shit at the proprietor again!!!
Welcome back. You’re lucky I treated you so civilly.

Yeah, Kevin, not all of us get treated as well.
That’s right Abigail
^^^ You see that, Kevin?? Count your blessings. Here’s Admin’s favorite song. You’ll be required to memorize the lyrics of you want to stick around.
Cheers thanks for accommodating an old dinosaur technophobe
Ass – arse, potato – potato.
You seem like a nice guy. I vote for inviting you back in 🙂
What’s an ass potato?
Well I’ll be a Suck Egg Mule.
Lol, Abbie. So funny and thanks for the laugh. It could also be po”tits”o.
Glad you laughed, Leah. 🙂
Complete bullshit statistics.
Charles at oftwominds.com had an article some time ago, about what would be required to constitute being part of the middle class, I’m too lazy to search it now.
But end result is, if the middle class still amounts to 20% of the population, that would be a lot (with upper class~10%).
So, m is saying 70% is the lower class.
The median household income in the US is around $70,000. m’s position is that at $70,000 a household is lower class.
The household income at the 70th percentile is around $120,000 – the figure at which your middle class starts, according to m. Thus m, in its wisdom, suggests that middle class family income is between $120,000 and $205,000. m is a real Einstein, it is.
At the 25th percentile family income is around $35,000 – the bottom end of what is generally considered the current middle class. That is tight, for sure. But it would include a lot of retirees and welfare types. m is somehow suggesting that those families should be earning $85,000 more so they reach m’s middle class income figure of $120,000. I suppose m thinks we should just give each of those families an additional $85,000. We can wave a magic wand I suppose.
The stupid around hear is incredible at times. It warms my heart to see that some, like Kevin, are capable of learning.
But dear m shows itself to be incapable of such. It spouts off shit without any thought or research whatsoever, time and again. It gobbles up bullshit and craps it out onto the site time and again. It will never learn. It suggests the middle class income band is actually between $120,000 and $205,000, and suggests it with all the authority one would expect from such a blithering idiot.
“The stupid around hear is incredible at times.”
Psst…it’s spelled ‘here’.
Voices. I hear voices.
I believe you.
Your white Karen fragility is showing. 😉
Please. That was FUNNY! ZERO sense of humor, you have.
I thought I too waaar funny.
Llpoh you are right as rain on ~m~, A legend in his own mind and the last to discover he’s the town clown.
Thanks Flea. He (?) hangs around like a bad smell. How are you? Good to see you post. I am slowly regaining some momentum around here. Been laying low.
I’m not spitting out my pablum yet but not hear* much longer. Asleep from low oxy half the day but blessed with no painful disorders so I’m just posting to make sure I keep in fighting trim. I may have to box St. Pete to make him let me in so I want to be sharp.
This new crowd doesn’t know how to fight and think their opinions are not supposed to be challenged. They think they’re still in “group” where your “Share” is sacred. Makes me want to barf.
Like the pigeon that knocks over the chess pieces, craps on the board, and then struts like it won the game.
Hang tough, old friend. When the boxing match is on with St Peter we will broadcast it live on TBP. He won’t last 3 rounds.
I hope so because my spit won’t clear my truck door nowadays and it’s building up like candle wax.
It’s the worst I’ve ever seen especially that new floating one that blocks articles it’s advertising. It’s truly amazing actually. I figure it’s a way to not get censored or not get new readers. Good plan.
(Was supposed to be under the first comment but the site magically shifted me down. Amazing)
Brave. Ad blocker du jour. But you are correct, it will drive away some new traffic. Admin has to make money to support this place. A balancing act no doubt. That floating ad does suck the sweat off hairy balls with no ad blocker, for sure.
I very very rarely ever clicked on ads, even before changing to Brave a year or so ago.
Maybe it is just camouflage.