

Well, that should have been a wake-up call. The 30-year mortgage rate soared by 24 basis points recently to 6.18%. So the latter now stands at well more than double the 2.65% rate which prevailed just 18 months ago in January 2021, and at the highest level since the tail end of the Great Financial Crisis in 2009.
In a word, the Fed’s fake economy based on ridiculously unsustainable ultra-low interest rates is coming to a thundering end. And far more abruptly and violently than the Fed and its Wall Street megaphones ever remotely imagined.
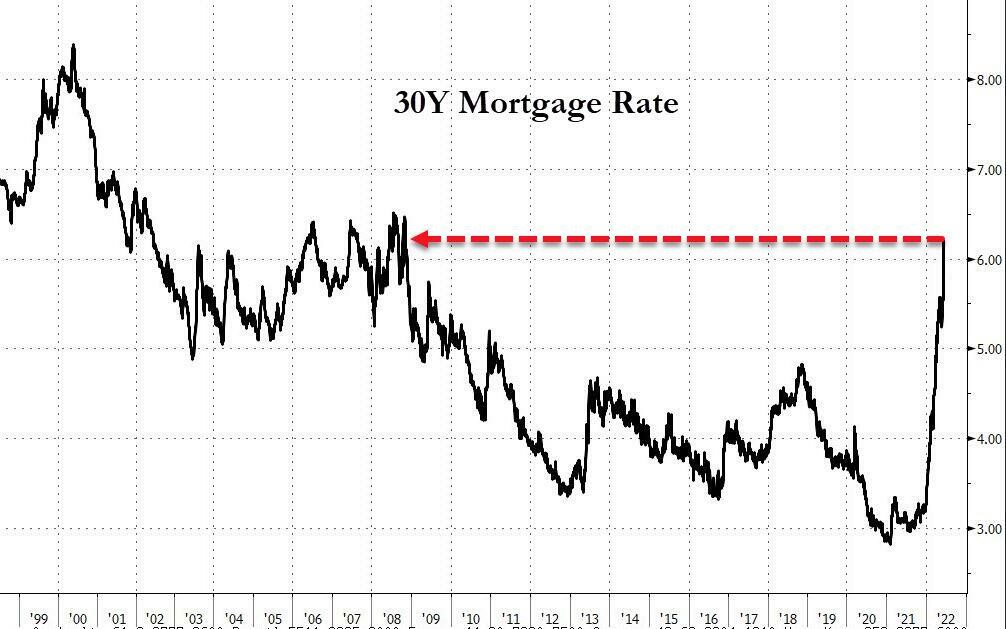
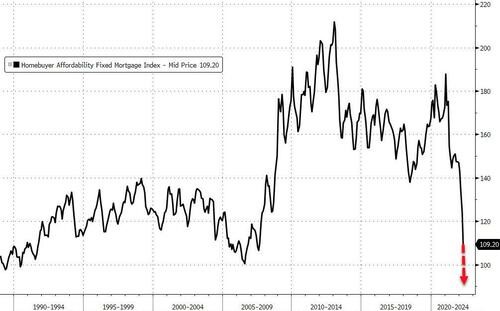
Not surprisingly, the eruption of the mortgage rate depicted above has sent housing “affordability” into the drink. In fact, housing affordability is now at the lowest point on record going back to the late 1980s.
Needless to say, household budgets are about to get hammered and the housing market is fixing to experience another great implosion. It would actually take a 30% drop in average home prices to reverse the affordability plunge just since the pre-Covid levels.
Homebuyer Affordability Index, 1988-2022
Alas, the surge in homeowners’ carry cost especially during the last six months is truly startling. A simple back of the envelope calculation reveals that the jump in mortgage rates from 3.25% to 6.13% during that brief period means that new homebuyers face an average monthly payment on a typical new $350,000 mortgage (at the median price) that has gone up from $1,523 to $2,128. That’s a 40% increase in 6 months!
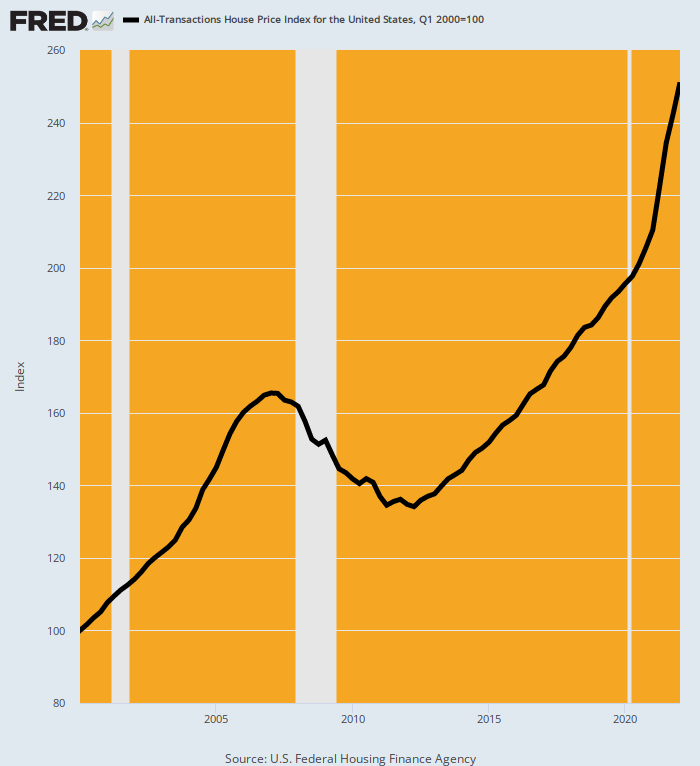
So whether it was intended or not, the Fed is about to unleash the biggest housing crisis since the bursting of the 2007 bubble. And there should be no doubt: The housing price bubble this time is even more egregious than back in 2005-2007.
House Price Index, 2000-2022
Likewise, junk bond yields have gone from 4% at the end of Dec (i.e. just 6 months ago) to 8.4% today. That’s another lightening fast doubling of rates.
So with junk bond yields at their highest level since 2015, the myth of low defaults is about to be monkey-hammered. That’s because the “refi” game which papered over bad credits is now over: When you rollover your leveraged debt to a 2X higher interest rate, rather than to a lower one compliments of the Fed money printers as per the last decade, the jig is up.
As the excellent bond maven, Stephanie Pomboy, tweeted recently:
Prepare to see an absolute ONSLAUGHT of corp defaults and downgrades. The myth of corp B/S strength is about to be shattered spectacularly.
She got that right. And that’s also the true economic evil of the Fed’s financial repression policies. It causes the financial signalling system to go wildly askew, thereby generating massively falsified financial values.
For instance, the market cap of the FANG stocks went from $3.0 trillion to $5.1 trillion and then back to $3.0 trillion, all in the space of hardly two years. But that’s not honest price discovery in any sense of the word; it’s just the consequence of liquidity fueled bubbles being inflated and then deflated by speculative forces.
Indeed, at the individual company level, the bubble dynamics as between the Covid-19 stock rally from March 23, 2020 to January 3, 2022 and then what is now being labelled the subsequent “bear market” is truly astounding.
Covid-19 Bull Market Versus Plunge Since January 3, 2022 Peak:
- Nividia: Up 466%, Down 48%;
- Apple: Up 224%, down 28%;
- Google: Up 175%, Down 27%;
- Microsoft: Up 145%, Down 28%;
- Facebook/Meta: Up 129%, Down 51%.
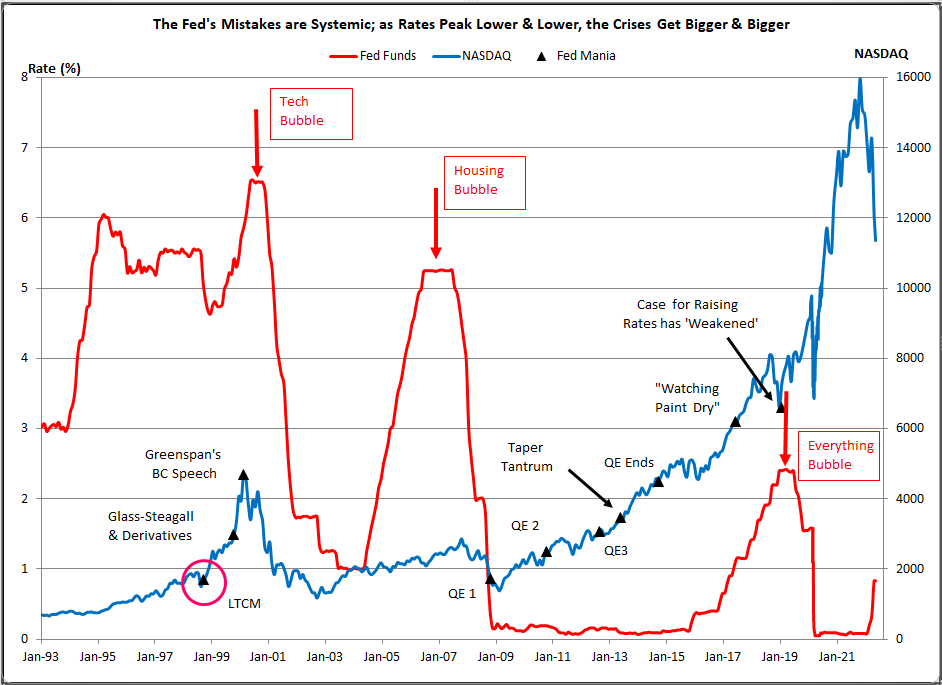
There is one constant, of course, which was ever cheaper overnight money (red line) supplied by the Fed that provided the carry traders with the wherewithal for massive, sustained momentum driven speculation.
Indeed, as indicated by the chart, the Fed’s mistakes were systemic: As rates peaked lower and lower with each cycle, the financial bubbles got larger and larger.
At the same time that the bejesus was being inflated out of Wall Street, the planking was being laid for a new bout of goods and services inflation on main street. And this gets us to the May PPI index released this AM.
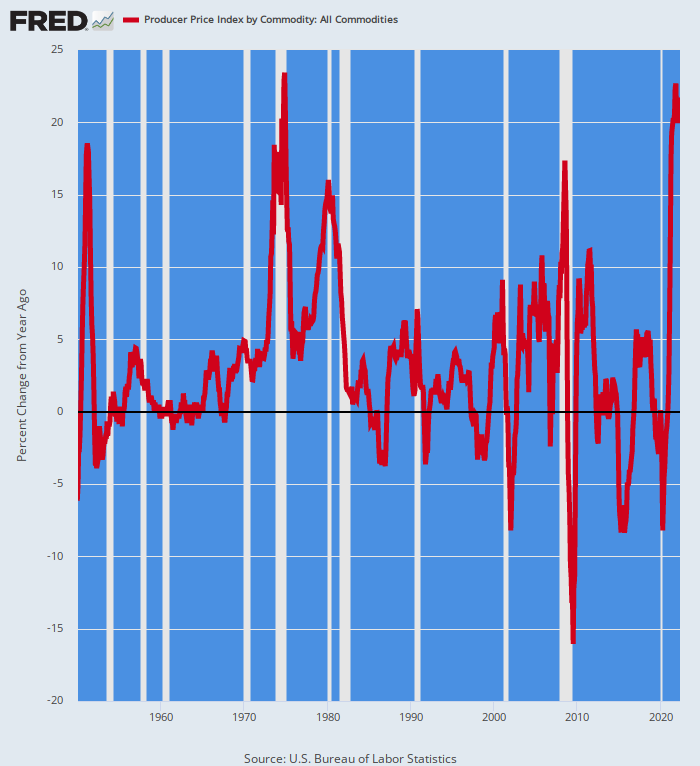
There are various measures of producer prices, but the index that requires special attention at the moment is the All Commodities PPI. It was up a red hot 21.5% versus prior year.
More importantly, the 20%+ Y/Y readings of the last few months exceed almost all prior inflation peaks since 1950. For instance, the July 2008 peak posted at 17.4% versus prior year, and even at the top of the inflation blow-off in November 1974, the Y/Y gain came in only slightly higher at 23.4%. Even the Korean War induced inflation-surge in 1951 peaked at just 18.4% on a Y/Y basis.
In other words, producer inflation is roaring down the pipeline at rates seen less than 0.01% of the time during the past three-quarters of a century. The Fed belated attempt to cope with it, therefore, will not end well or soon.
Y/Y Change In All Commodities PPI, 1950-2022
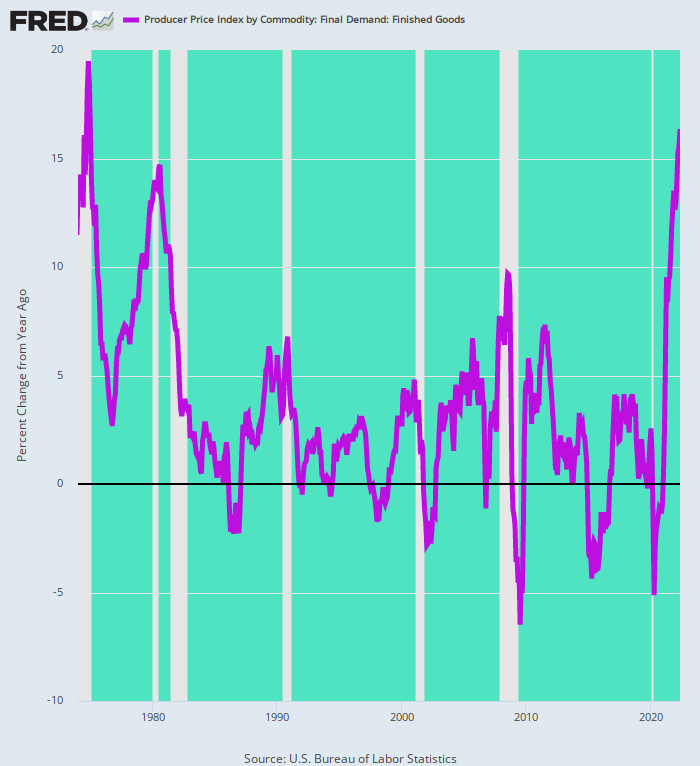
Even if we look at May’s readings for PPI finished goods as opposed to commodities, there is no evident relief in sight. The Y/Y gain was 16.4%, the largest advance since December 1974 when the finished goods PPI posted at 18.5%.
That was 48 years ago, of course, but the mechanics of inflation transmission do not change. That is, producer prices fuel the costs of production of goods and services in the business sector, which, in turn, work their way into the retail price level with a lag.
Accordingly, we are not yet even close to “peak inflation”. The only scenario in which these soaring producer level price increases do not show-up in the CPI is in the event of a thundering recessionary collapse in which producer profit margins are crushed on the way down.
The latter is always a possibility, but the issue is timing and sequence: What buckles first—output and employment or producer profits margins?
Currently, we are in such uncharted waters that it is difficult to know. But no matter: Both outcomes are on the way, and in the not too distant future, too.
Y/Y Change In Producer Price Index For Finished Goods, 1974-2022
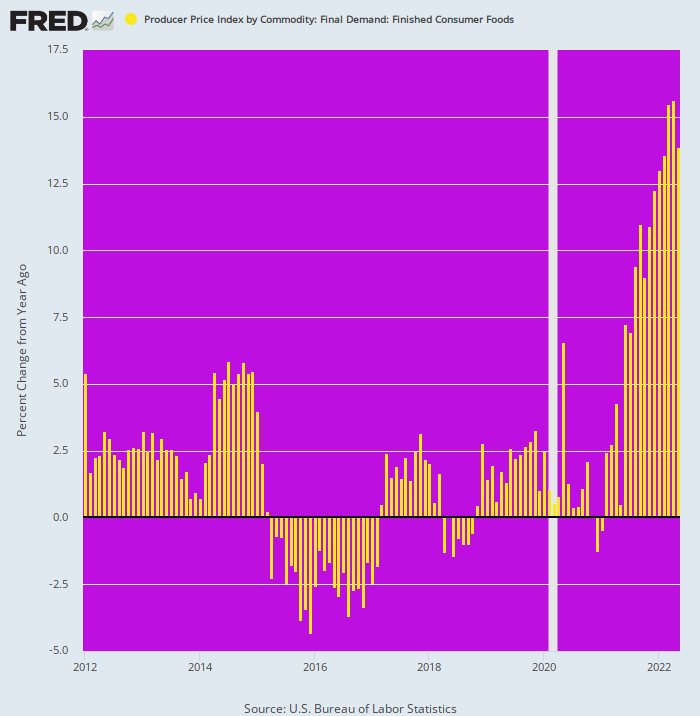
In the case of the final demand for consumer foods, the index was up nearly 14%, and that was the seventh straight month of double-digit gains. We have a hard time seeing how household budgets will survive the grocery bill assault coming down the inflation pipeline or how the idea that inflation has peaked has any basis in the facts conveyed by the May PPI release.
Indeed, the chart below conveys quite pointedly that we are in a wholly new inflation ball game. After the Fed adopted inflation targeting in January 2012 it took to lamenting that it was missing its 2.00% target from below, thereby justifying its madcap money-printing.
One of the reasons, however, was that the global foods market was in temporary surplus, causing food inflation to oscillate between +2.5% and -2.5%. That had nothing to do with the monetary policies being cranked out in the Eccles Building, save for the license it provided other central banks to flood their economies with cheap capital and thereby generating a temporary abundance of agricultural investment.
But that era was never sustainable, and was always at risk for exogenous disruptions like the Ukraine based global Sanctions War now roiling the global commodities and food markets. Accordingly, the idea that the Fed had license to print money with reckless abandon because headline inflation was being temporarily pulled lower by deflation in foods, energy and manufactured goods will surely rank as one of the great follies of all time.
Y/Y Change In PPI For Finished Consumer Foods, 2012-2022
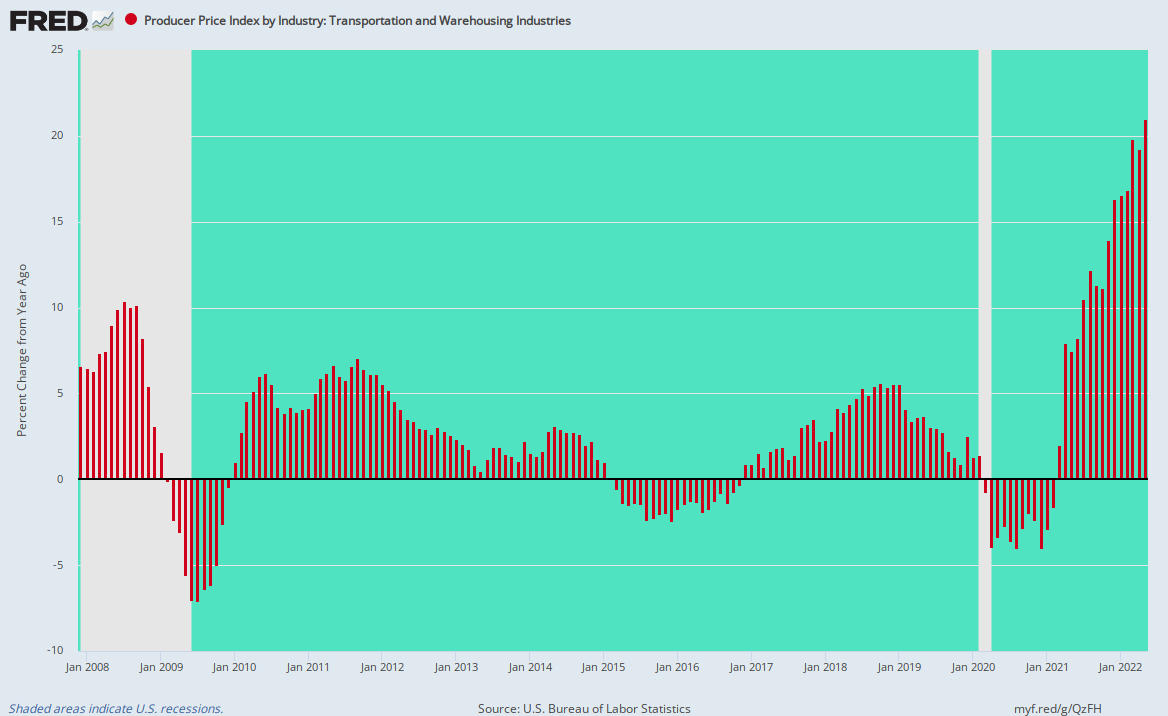
Another sign that inflation has a growing head of steam was the 21.0% Y/Y rise in the PPI for transportation and warehousing. As shown below, that’s off-the-charts of recent history, and more than double the surge that occurred during the inflationary blow-off top in mid-2008.
Needless to say, these are services industries that are being hit by the double whammy of rising energy and wage costs, neither of which is likely to be abating any time soon. Nor would resolution of current global supply chain dislocations make much difference—the problem in this instance is shortages of capacity across a broad spectrum of modalities, from railroads to trucking and the ocean ports.
Y/Y Change In PPI For Transportation And Warehousing Industries, 2008-2022
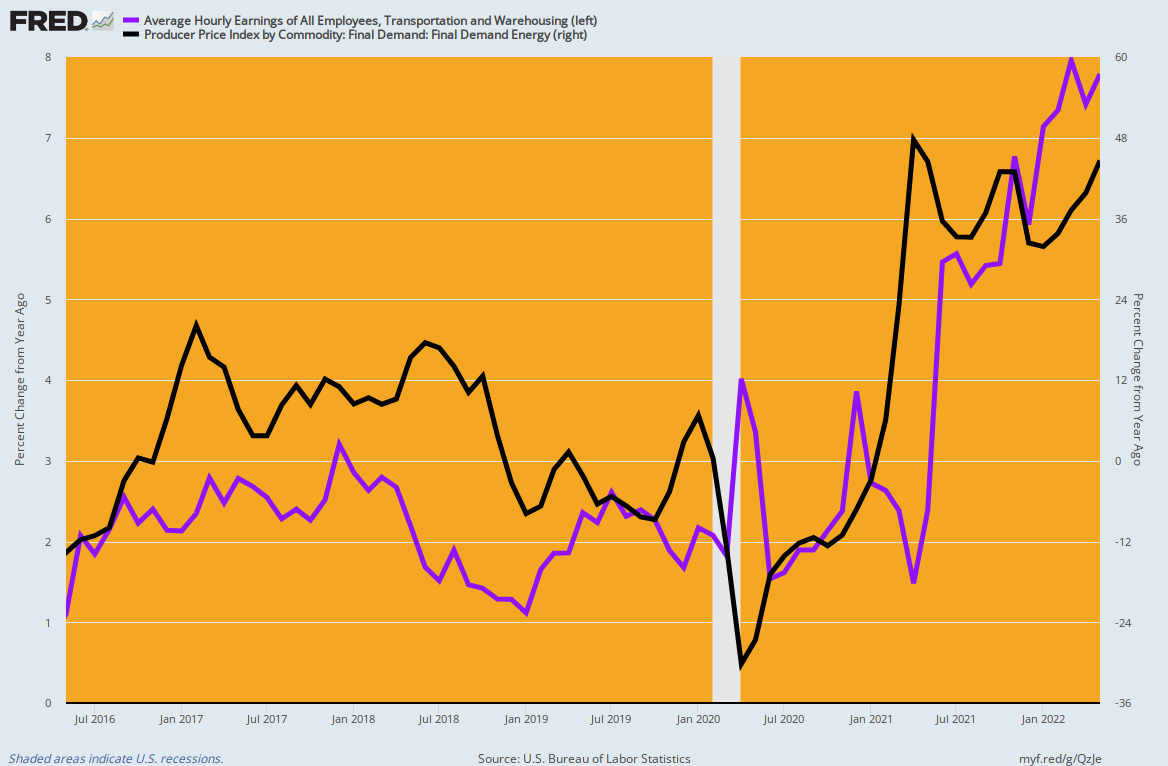
For want of doubt, here are the PPI indices for energy and for transportation and warehouse wages. In the latter case the wage gain (purple line) was 7.8% on a Y/Y basis, a figure more than triple the 2.5% per annum trend that prevailed prior to February 2020.
Similarly, the gain in the PPI for energy during May was 45%, a Y/Y level which has prevailed since the spring of 2021. That is, there is nothing in the black line below that says the worst is over.
Y/Y Change, Transportation And Warehousing Costs And Energy, 2016-2022

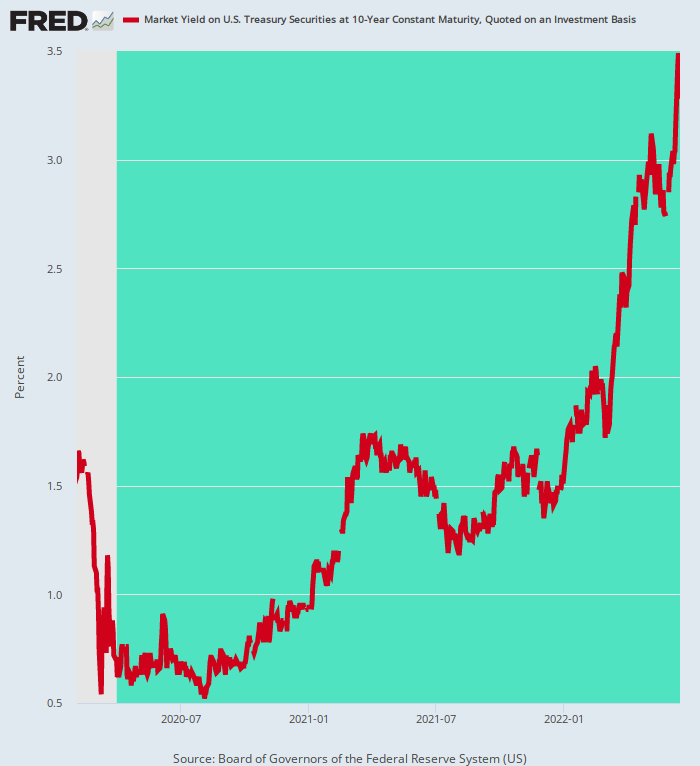
In short, the central banks have unleashed an inflationary whirlwind that has left the false pricing of the stock and bond markets high and dry. That’s why the very benchmark security of the global financial system has nearly gone parabolic in recent weeks.
At today’s 3.48% closing yield, the 10-year US Treasury yield was up 50 basis points from 5 days ago, 130 basis points from mid-March, and is in a totally different universe than prevailed when the Fed went berserk buying government bonds after March 2020.
But here’s the thing. Out of anti-inflation desperation, the Fed has pivoted to QT, but the impact of Fed held-bonds flooding into the trading pits has barely begun. And that’s to say nothing of the $95 billion per month bond shrinkage rate which will commence in September.
So the Great Reckoning has now commenced. The soaring red line below tells you all you need to know. It means that the artificially low cap rates of the last decade or more have reached their sell-by date and that the great money bubble the fostered is now heading for the wall.
10-Year Treasury Yield, February 2020-June 2022
It is my sincere desire to provide readers of this site with the best unbiased information available, and a forum where it can be discussed openly, as our Founders intended. But it is not easy nor inexpensive to do so, especially when those who wish to prevent us from making the truth known, attack us without mercy on all fronts on a daily basis. So each time you visit the site, I would ask that you consider the value that you receive and have received from The Burning Platform and the community of which you are a vital part. I can't do it all alone, and I need your help and support to keep it alive. Please consider contributing an amount commensurate to the value that you receive from this site and community, or even by becoming a sustaining supporter through periodic contributions. [Burning Platform LLC - PO Box 1520 Kulpsville, PA 19443] or Paypal
-----------------------------------------------------
To donate via Stripe, click here.
-----------------------------------------------------
Use promo code ILMF2, and save up to 66% on all MyPillow purchases. (The Burning Platform benefits when you use this promo code.)


I would enjoy seeing a 30% drop in housing prices,looking for a good chunk of land(minimum 20 acres at least)with something livable on it,can build it out the way I want.
I though a carpenter/builder have no interest in building a new home with the nonsense that entails!
Either way, a cash buyer while cash still has any value so we will see.
You seem to be equating Stockman’s call for a 30% housing price drop – which in his words just takes prices back to 2019 and speaks nothing of a major cyclical housing price decline – with changes in land values. I live where the available land (potentially to be developed and at least 40 acres) is nearly infinite. The last housing boom here most definitely blew undeveloped land values through the roof. But their current values are nowhere near their 2005 peak. The future, by definition, is unknowable but you can most surely bet that if you’re looking at land values rather than housing values then you’re going to miss the boat.
I think if you get a little west of Concord, NH and then a little north of 89 you can find that James.
In other words, everything is going according to plan.
Except now the ten year yield is back down to 2.9%. Not sure when Stockman wrote this… Chip
This too.
If Socrates is so astute, it should just cut Martin out of the loop, and publish its prognostications itself.
Tucker Carlson lays out the Demented One, not just for being stupid and incompetent,
which most all know to be a fact, but for his Criminal Impeachable actions!!
https://www.youtube.com/watch?v=mJo18QHPlSk
El Presidente gets a proper review on his efforts to destroy the country!
Great articlde, thx. Have spent 46+ yrs either as an oil jobber or environmental consultant to the same.
To me, a “gas station” is a 2 bay facility w/ 3 pumps. Pumper or C-store is the norm, and the average cost of either will run between $5-10MM. You litderally give away 87 octane to get inside traffic.
Bought my 1st house in April 1977. 20 yrs, 9%. Only had enough $$$ to do 10% down, so a point was added. 20% down, 8%. Was asked if I wanted a fixed or variable, thank God I said fixed.
Shows how bad things are that a 6.5% 30 yr will wreck the economy. And, it won’t be a 30% correction, guessing more like 50-60% over a 2-3 yr. period.