Schiller Cyclically Adjusted PE Ratio (CAPE) – Real or Misleading?

Guest Post by Martin Armstrong

The Shiller Cyclically Adjusted PE Ratio known as CAPE,  is a particular PE ratio invented by Robert Shiller of Yale University. Unlike his index on real estate, this one tracking the period of 1870 to date is not very good. True, you will arrive at one of two conclusions that either the CAPE today is near the same level as in 1929, or it is higher today than it was just before the Panic of 2008. Does this really mean anything? Absolutely not!

Continue reading “Schiller Cyclically Adjusted PE Ratio (CAPE) – Real or Misleading?”

Bubbles? Shiller P/E Ratio Nears Roaring ’20s Bubble High As Home Prices Increased 43.6% Since Feb ’12

Guest Post by Anthony Sanders

Supreme Court Justice Potter Steward said in 1964 in the Jacobellis v. Ohio case,  “I shall not today attempt further to define the kinds of material I understand to be embraced within that shorthand description [hard-core pornography]; and perhaps I could never succeed in intelligibly doing so. But I know it when I see it, and the motion picture involved in this case is not that.”

Asset bubbles too are difficult to define, but I know it when I see it.

Continue reading “Bubbles? Shiller P/E Ratio Nears Roaring ’20s Bubble High As Home Prices Increased 43.6% Since Feb ’12”

STUPID IS AS STUPID DOES

If you prefer fake news, fake data, and a fake narrative about an improving economy and stock market headed to 30,000, don’t read this fact based, reality check article. The level of stupidity engulfing the country has reached epic proportions, as the mainstream fake news networks flog bullshit Russian conspiracy stories, knowing at least 50% of the non-thinking iGadget distracted public believes anything they hear on the boob tube.

This stupendous degree of utter stupidity goes to a new level of idiocy when it comes to the stock market. The rigged fleecing machine known as Wall Street has gone into hyper-drive since futures dropped by 700 points on the night of Trump’s election. An already extremely overvalued market, as measured by every historically accurate valuation metric, soared by 4,000 points from that futures low – over 20% – to an all-time high. Despite dozens of warning signs and the experience of two 40% to 50% crashes in the last fifteen years, lemming like investors are confident the future is so bright they gotta wear shades.

The current bull market is the 2nd longest in history at 8 years. In March of 2009, the S&P 500 bottomed at a fitting level for Wall Street of 666. In a shocking coincidence, it bottomed on the same day Bernanke & Geithner forced the FASB to rollover like mangy dogs and stop enforcing mark to market accounting. Amazingly, when Wall Street banks, along with Fannie and Freddie, could value their toxic assets at whatever they chose, profits surged. The market is now 240% higher.

Continue reading “STUPID IS AS STUPID DOES”

A BIASED 2017 FORECAST (PART ONE)

“The idea that the future is unpredictable is undermined every day by the ease with which the past is explained.”Daniel Kahneman, Thinking, Fast and Slow


A couple weeks ago I was lucky enough to see a live one hour interview with Michael Lewis at the Annenberg Center about his new book The Undoing Project. Everyone attending the lecture received a complimentary copy of the book. Being a huge fan of Lewis after reading Liar’s Poker, Boomerang, The Big Short, Flash Boys, and Moneyball, I was interested to hear about his new project. This was a completely new direction from his financial crisis books. I wasn’t sure whether it would keep my interest, but the story of Daniel Kahneman and Amos Tversky and their research into the psychology of judgement and decision making, creating a cognitive basis for common human errors that arise from heuristics and biases, was an eye opener.

In psychology, heuristics are simple, efficient rules which people often use to form judgments and make decisions. They are mental shortcuts that usually involve focusing on one aspect of a complex problem and ignoring others. These rules work well under most circumstances, but they can lead to systematic deviations from logic, probability or rational choice theory. The resulting errors are called “cognitive biases” and many different types have been documented.

Continue reading “A BIASED 2017 FORECAST (PART ONE)”

SOMETHING WICKED THIS WAY COMES

I stopped trying to predict markets back in 2008 when the Federal Reserve, Treasury Department, Wall Street bankers, and their propaganda peddling media mouthpieces colluded to rig the markets to benefit the elite establishment players while screwing average Americans. I haven’t owned any stocks to speak of since 2006. I missed the the final blow-off, the 50% crash, and the subsequent engineered new bubble. But that doesn’t stop me from assessing our true economic situation, market valuations, and historical comparisons in order to prove the irrationality and idiocy of the current narrative.

The proof of this market being rigged and not based upon valuations, corporate earnings, discounted cash flows, or anything related to free market capitalism, was the reaction to Trump’s upset victory. The narrative was status quo Hillary was good for markets and Trump’s anti-establishment rhetoric would unnerve the markets. When the Dow futures plummeted by 800 points on election night, left wingers like Krugman cackled and predicted imminent collapse. The collapse lasted about 30 minutes, as the Dow recovered all 800 points and has subsequently advanced another 1,500 points since election day. Krugman’s predictive abilities proven stellar once again.

Continue reading “SOMETHING WICKED THIS WAY COMES”

The stock market’s oldest indicator just flashed red

Guest Post by Brett Arends

I hate to rain on this parade. But the latest lurch upwards in stock prices has just taken market valuations up into the skybox levels, according to the market timing measure with the longest pedigree on Wall Street. It’s just gone from flashing amber to flashing red — meaning, if it’s right, that there is now a significant and rising risk of a crash, and a bigger risk of simply very poor returns.

This has little to do with President-elect Donald Trump, by the way — and much more to do with President Ulysses S. Grant and all his successors.

Wall Street’s jump this week has taken the S&P 500 SPX, +1.32%  to an eye-watering 27.9 times the corporate earnings of the past 10 years. That’s according to data compiled by Yale finance professor Robert Shiller and some simple math.

Continue reading “The stock market’s oldest indicator just flashed red”

Here’s The Great Big Lie The Bulls Tell About The Stock Market

Guest Post by Mark Hulbert

Bearish P/E ratio calculation carries the most weight

MW-EV318_real_p_20160905141158_ZH

The U.S. stock market’s P/E ratio is telling us in no uncertain terms that stocks are hugely overvalued. Given that, I would have thought the bulls would simply ignore it.

I was wrong.

In fact, many of the bulls have figured out how to torture the data in order to make it appear as though the stock market’s current valuation is in line with historical averages. It’s crucial that you understand what they’re doing so you don’t get seduced by their sweet-talking rationales.

The reason the P/E can seem to tell more than one story is that there is more than one way of calculating it. Though the “P” in the ratio — the price — is fixed, the “E” can vary by a lot. Some analysts focus on trailing 12-month earnings, for example, while others focus on estimated earnings over the coming year. Some calculate the P/E based on earnings as they are actually reported by the companies, while others rely on so-called “operating earnings” (which reflect a firm’s profits after excluding non-operating expenses such as taxes and interest).

Continue reading “Here’s The Great Big Lie The Bulls Tell About The Stock Market”

How The Baby Boomers Blew Up The Stock Market

Guest post by Jesse Felder

In my last piece, I openly worried about a few very smart investment minds who have recently attempted to rationalize or justify the persistently high equity valuations we have seen over the past 25 years. I don’t believe that, “it’s different this time.” The modern economy doesn’t have any new magical component that makes a standard stream of cash flows any more valuable than they were 50 or 100 years ago. Nor have investors become generally more intelligent.

I think there’s a very simple explanation for the high stock market valuations since 1990: demographics. From 1981-2000, the baby boom generation came into their peak earning and investing years. Is it just coincidence that during that very same time we witnessed the largest stock market valuation bubble in history? No. In fact, there is a statistically significant correlation between demographic shifts like this and stock market valuations.

6a0133f3a4072c970b017c37501fd9970b-550wi

A few years ago a pair of research advisors to the Federal Reserve Bank of San Francisco demonstrated this link. They found that demographics (specifically, the ratio between retirement age workers to peak earning and investing age ones) is responsible for 61% of the changes in the price-to-earnings ratio of the stock market over time. Additionally, they found that when their model’s forecast p/e was off by a significant amount the real p/e consistently reverted to their forecast p/e.

Continue reading “How The Baby Boomers Blew Up The Stock Market”

DANGEROUS DIVERGENCE

The chart below would appear to be in conflict with the results of a recent Gallup poll regarding stock ownership by Americans. The ratio of household equities to money market fund assets is near a record high, 60% above the 2007 high and 30% above the 1999 internet bubble high. The chart would appear to prove irrational exuberance among the general populace.

In reality, the lowest percentage of Americans currently own stock over the last two decades. With the stock market within spitting distance of all-time highs, only 52% of Americans own stock, down from 65% in 2007. As the stock market has gone up, average Americans have left the market. They realize it is a rigged game and they are nothing but muppets to the Wall Street shysters.

InvestInStocks1

Continue reading “DANGEROUS DIVERGENCE”

WHY STOCKS WILL CRASH IN TWO CHARTS

“Things always become obvious after the fact”Nassim Nicholas Taleb

“Facts do not cease to exist because they are ignored.”  – Aldous Huxley

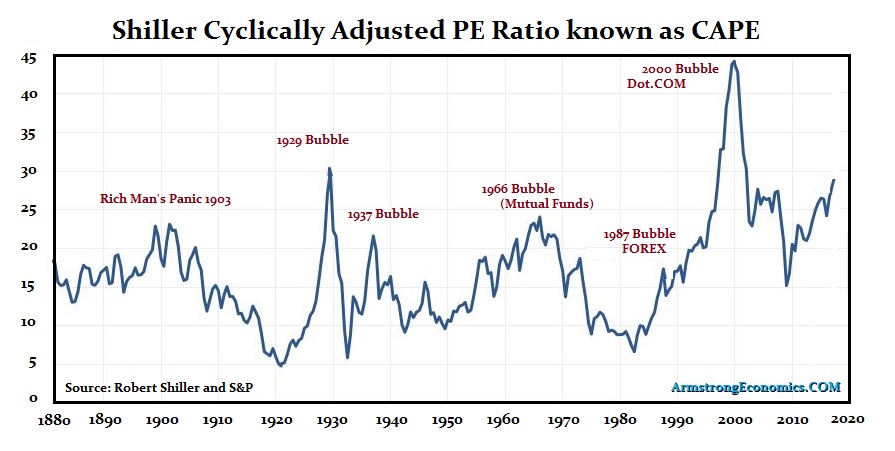
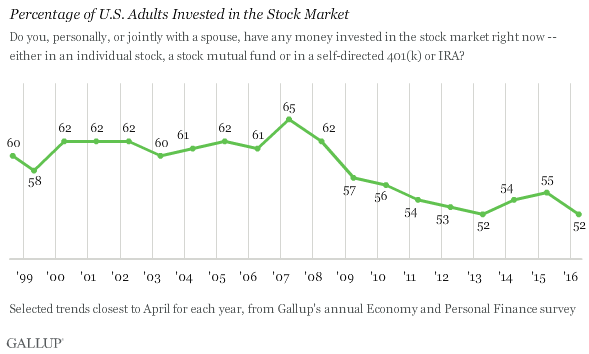
The S&P 500 currently stands at 2,126, fractionally below its all-time high. It is now 300% above the 2009 low and 34% above the 2008 and 2001 previous highs. Most people believe this is the new normal. They are comfortably numb in their ignorance of facts, reality, the truth, and the inevitability of a bleak future. When the herd is convinced progress and never ending gains are the norm, the apparent stability and normality always degenerates into instability and extreme anxiety. As many honest analysts have proven, with unequivocal facts and proven valuation measurements, the stock market is as overvalued as it was in 1929, 2000, and 2007.

Facts haven’t mattered, as belief in the infallibility and omniscience of Federal Reserve bankers, has convinced “professionals” to program their high frequency trading supercomputers to buy the all-time high. If central bankers were really omniscient and low interest rates guaranteed endless stock market gains, then why did the stock market crash in 2000 and 2008? The Federal Reserve’s monetary policies created the bubbles in 2000, 2007 and today. There was no particular event which caused the crashes in 2000 and 2008. Extreme overvaluation, created by warped Federal Reserve monetary policies and corrupt Washington D.C. fiscal policies, is what made the previous bubbles burst and will lead the current bubble to rupture.

Benjamin Graham and John Maynard Keynes understood how irrational markets could be over the short term, but eventually they would reach fair value:

“In the short run, the market is a voting machine but in the long run, it is a weighing machine.” – Graham

“The market can stay irrational longer than you can stay solvent.” – Keynes

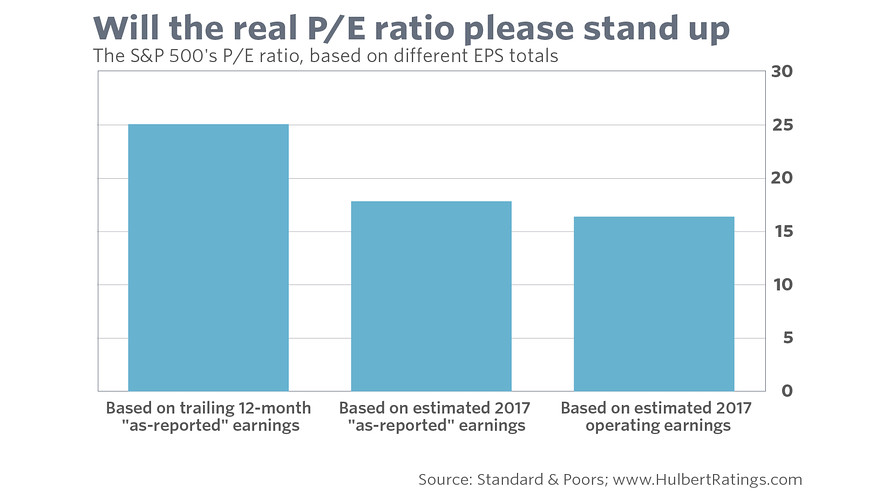
Graham’s quote reflects the difference between hope and reality. This explains the ridiculous overvaluation of Amazon, Shake Shack, Twitter, Linkedin, Tesla, Google, and the other high flying new paradigm stocks. Story stocks soar because the herd believes the stories peddled by Wall Street and company executives. Five of these six stocks don’t have a PE ratio because you need earnings to calculate a PE ratio. In the long run the market will weigh the value these companies based upon profits and cashflow. It is the same story for the market as a whole. There is no question who is to blame for what now amounts to a three headed hydra of bubbles poised to burst.

Continue reading “WHY STOCKS WILL CRASH IN TWO CHARTS”

IT AIN’T OVER ‘TIL IT’S OVER

It ain’t over until it’s over. The lows were not reached in 2009. Central bank manipulations and schemes temporarily delayed reaching a true bottom. They have failed. A true secular bottom would be 60% to 80% below today’s levels. Are you prepared for that? That would put the Dow at 7,000 or below. Do you think that is impossible? It was trading at 6,500 in March of 2009. If Bernanke and Geithner hadn’t forced the FASB to allow Wall Street bankers to value their worthless assets as if they were worth 100 cents on the dollar, the 4,000 secular low would have been reached. Now we will pay the price with a far worse scenario. The Fed has shot their load. Fourth Turnings are relentless and nasty.

Are We About to Enter a Secular Bear Market?

Guest Post by Chris Hunter


Wall_Street_bubbles_-_Always_the_same_-_Keppler_1901_1

Source: wikimedia

Today’s chart, from the folks at Crestmont Research, speaks volumes about current investor behavior.

In particular, it calls into question claims being bandied about in the mainstream media that we could be at the start of a new secular bull market in US stocks.

It shows that previous secular (long-term) bear market cycles tend to start when the US stock market is trading on a Shiller P/E – a price-to-earnings ratio is based on average inflation-adjusted earnings from the previous 10 years – of between 20 and 25 (blue-shaded area on the chart).

Continue reading “IT AIN’T OVER ‘TIL IT’S OVER”