CHRISTMAS IN OCTOBER – DESPERATE MEASURES

The desperation of retailers grows by the day. I head to Wal-Mart and Giant in Harleysville every Sunday morning at 7:00 am. to do my weekly grocery shopping. I go to Wal-Mart at opening to avoid the freaks we see weekly on the People of Wal-Mart post. The workers at Wal-Mart are only a small step above the customers. They can barely communicate, rarely look you in the eye, and generally act like they are prisoners in an asylum.

I’m in winter/bad times ahead prep mode. I had a load of fire wood delivered yesterday which I wheelbarrowed to the back yard and stacked with my already decent sized stack. Last week I took an empty propane canister back to Wal-Mart to replace it with a full canister. That would give me three full propane tanks. I left the empty tank outside next to the propane cage and went in to pay. The old lady cashier with the gravelly smoker voice told me she would call for someone to get me a new tank.

I went over the cage and patiently waited for a Wal-Mart drone to come out, unlock the propane cage and give me a full tank. Two minutes, five minutes, and eventually ten minutes go by with no one coming out to help me. The cashier pokes her head out the door and shrugs her shoulders and says no one is responding to her calls. What a well oiled machine they have at Wal-Mart. Eventually the old lady abandoned her cashier post and in a painstakingly slow manner proceeded to unlock one bin after another until she found a full tank. I’m sure a line of unhappy customers were piling up at the only register in the garden center while she spent ten minutes getting me my propane tank.

A transaction that should have taken five minutes from start to finish ended up taking closer to twenty five minutes, with another five or six customers also dissatisfied with their extra long wait. This is a perfect example of how not to do business. Maybe Wal-Mart’s problems are bigger than households having less to spend. They are attempting to maintain their profit margins by reducing staff hours, hiring low quality people, and paying them shit wages. In the short run it may keep profits higher, but in the long-run customers will go elsewhere. Except most of the elsewhere stores closed up years ago when Wal-Mart arrived and underpriced them into bankruptcy.

My shopping experience at Giant is generally pleasant. The staff are nice, competent, and have been there for years. They know what they are doing and serve you with a smile. But their store is part of a worldwide conglomerate, so things have changed for the worse over the last four months. They renovated the entire store, creating bigger aisles and moving stuff around. That’s annoying, but after a while you figure out where they moved the stuff you want. The real negative change was the dreaded “Everyday Low Pricing”. This weasel phrase means you will be paying more. This is what the Apple idiot CEO – Ron Johnson – did at JC Penney. It put them on a rapid path to bankruptcy.

The weekly sale items at Giant have virtually disappeared. This has coincided with the drastic increase in beef, pork and fresh produce prices. Since “Every Day Low Pricing” went into affect our weekly grocery bill has gone up 20%. And I am buying far less beef and more chicken. In the past I would stock up on sale items and put beef, pork and whatever was on sale in our storage area freezer. Now I am stuck buying what we need that week. No bargains, just fully priced food items. Be forewarned, whenever you see a store announce “Everyday Low Pricing” you are getting screwed.

The Boos Begin in August & Bells Start Jingling in October

The desperation of Wal-Mart and most of the other mega-retail chains is no more clearly evident than in their relentlessly ridiculous acceleration of holiday marketing displays. I was flabbergasted when I saw Halloween candy, decorations and costumes in row after row BEFORE Labor Day at my local Wal-Mart. Selling Halloween candy two months before Halloween is idiotic and a sure sign of desperation. Retailers have run out of merchandising ideas. I wouldn’t even consider buying Halloween candy until the week before Halloween. Do Wal-Mart freaks of the week actually buy Halloween merchandise in September?

Holidays used to be special occasions that lent a sense of sales urgency for retailers for a week or two, to pump up sales. Now Wal-Mart and the rest of the dying retailers have Christmas, Easter, Fourth of July, and Halloween displays up for 80% of the year. There is no sense of urgency to buy. From September 1 though October 31 there are rows and rows of bags of corporate produced chemicals disguised as candy. I suppose the obese masses buy this crap in anticipation of Halloween, tell themselves they’ll only take one, and then shovel the entire bag down their gullets.

So last week, still a full two weeks before Halloween, Wal-Mart had already converted their entire garden center into a Christmas wonderland of cheap mass produced Chinese cookie cutter Christmas decorations and lights that will blow out after three hours of use. They had also converted aisles at the front of the store to Christmas displays. Who the hell shops for Christmas crap in October? There is nothing like having cheap Chinese Christmas crap available for over two months to create a sense of urgency to buy. Wal-Mart and the rest of the mega-retailers have got nothin. They have no original merchandising ideas. They don’t even try anymore. They source low quality goods from China and compete solely on price. I can’t wait for the Easter candy to appear on Wal-Mart’s shelves in late December.

Black Thanksgiving

Black Friday is dead. Long live Black Thanksgiving. The riots and stampedes by the ignorant masses for toasters and HDTVs on Black Friday are now being replaced by retailers and malls across America opening at 6:00 pm on Thanksgiving. It actually seems fitting. How better to give thanks for our mass consumption, debt financed, materialistic, iGadget addicted society than to open stores on Thanksgiving. Spending time with family is overrated anyway. If you had to spend six hours with cousin Eddie and aunt Bethany, you’d be looking forward to an early opening at Macy’s.

The bullshit message from the mega-retailers is: “We’re not opening on Thanksgiving out of desperation or greed. We’re doing it simply to satisfy the demands of our customers”. It’s a racist national holiday anyway. We should be going to an Indian run casino on Thanksgiving to make up for our past sins. Opening stores and forcing workers to work on Thanksgiving is pathetic, disgusting and a truly desperate measure in this consumer empire in decline. The law of diminishing returns has been invoked upon the mega-retailers that dominate our suburban sprawl paradise.

These retailers can start holiday merchandising three months before the actual holiday. They can open their doors on Thanksgiving, Easter and Christmas. It’s nothing more than shuffling the deck furniture on the Titanic. We’ve allowed bankers, politicians and corporate titans to financialize our economy, gutting the once thriving middle class, sending manufacturing jobs overseas, and convincing the clueless masses that consumer goods purchased with debt is equal to wealth. But, we’ve reached the point of no return. There are 248 million working age Americans and 102 million of them are not employed. Of the 146 million working Americans, 82 million of them make less than $30,000 per year.

While retailers have added billions of square feet since 1989, real median net worth is 5% lower over 24 years. Retailers are attempting to get blood from a stone. The stone is in debt, approaching retirement with no savings and dead broke.

We have one entity that deserves the most credit for destroying the American Dream. Real median household income is lower than it was in 1989. The 2008 collapse was caused by the easy money bubble machine at the Federal Reserve. We had the opportunity to hit the reset button, implement rational economic and monetary policies, take our lumps, and make the banking culprits pay for their crimes. Instead, the easily manipulated masses believed the Wall Street storyline and allowed the Federal Reserve and feckless politicians to save the banking cabal with extreme money printing and debt creation. This has pushed the middle class closer to the breaking point, while further enriching the oligarchs. The Federal Reserve saved their owners and lured the masses further into debt.

The Fed, Wall Street, and Washington DC have successfully driven consumer debt to an all-time high, blasting through the $3 trillion level. Declining real incomes and rising debt are a sure recipe for success.

Our entire economic paradigm is built upon desperate measures. Zero interest rates, $3 trillion of QE, systematic accounting fraud, fudged economic data, and doling out subprime loans to auto renters and University of Phoenix wannabes have failed to revive our moribund economy. Delusions don’t die easily. But they do die. We are reaching the limit of this delusionary dream built upon debt, denial, and deception. Make sure you wolf down that Thanksgiving feast before 5:00 pm. There are HDTV’s to fight for at 6:00 pm.

50% Of American Workers Make Less Than $28,031 A Year

Submitted by Michael Snyder of The Economic Collapse blog,

The Social Security Administration has just released wage statistics for 2013, and the numbers are startling.  Last year, 50 percent of all American workers made less than $28,031, and 39 percent of all American workers made less than $20,000.  If you worked a full-time job at $10 an hour all year long with two weeks off, you would make $20,000.  So the fact that 39 percent of all workers made less than that amount is rather telling.  This is more evidence of the declining quality of the jobs in this country.  In many homes in America today, both parents are working multiple jobs in a desperate attempt to make ends meet. Our paychecks are stagnant while the cost of living just continues to soar.  And the jobs that are being added to the economy pay a lot less than the jobs lost in the last recession.  In fact, it has been estimated that the jobs that have been created since the last recession pay an average of 23 percent less than the jobs that were lost.  We are witnessing the slow-motion destruction of the middle class, and very few of our leaders seem to care.

The “average” yearly wage in America last year was just $43,041.  But after accounting for inflation, that was actually worse than the year before

American paychecks shrank last year, just-released data show, further eroding the public’s purchasing power, which is so vital to economic growth.


Average pay for 2013 was $43,041 — down $79 from the previous year when measured in 2013 dollars. Worse, average pay fell $508 below the 2007 level, my analysis of the new Social Security Administration data shows.


Flat or declining average pay is a major reason so many Americans feel that the Great Recession never ended for them. A severe job shortage compounds that misery not just for workers but also for businesses trying to profit from selling goods and services.


Average pay declined in 59 of the 60 levels of worker pay the government reports each October.

And please keep in mind that “average pay” is really skewed by the millionaires and billionaires at the top end of the spectrum.

Median pay in 2013 was just $28,031.02.  That means that 50 percent of American workers made less than that number, and 50 percent of American workers made more than that number.

Here are some more numbers from the report that the Social Security Administration just released…

-39 percent of American workers made less than $20,000 last year.


-52 percent of American workers made less than $30,000 last year.


-63 percent of American workers made less than $40,000 last year.


-72 percent of American workers made less than $50,000 last year.

I don’t know about you, but those numbers are deeply troubling to me.

It has been estimated that it takes approximately $50,000 a year to support a middle class lifestyle for a family of four, and so the fact that 72 percent of all workers make less than that amount shows how difficult it is for families that try to get by with just a single breadwinner.

The way that our economy is structured now, both parents usually have to work as hard as they can just to pay the bills.

But there was one group of Americans that did see their incomes actually increase last year.

Those making over 50 million dollars had their pay increase by an average of $12.8 million in 2013.

For everyone else, the news was not good.

And of course this is a trend that has been going on for a long time.

Posted below is a chart that comes from the Federal Reserve.  It shows how real median household income in the United States has declined since the year 2000…


Meanwhile, the cost of living has continued to rise at a steady pace.

Needless to say, this is putting a tremendous squeeze on the middle class.  With each passing day, more Americans are losing their spots in the middle class and this has pushed government dependence to an all-time high.  According to the U.S. Census Bureau, 49 percent of all Americans now live in a home that receives money from the government each month.  This is completely and totally unsustainable, but our long-term economic problems just keep getting worse.

Our politicians have stood by as millions upon millions of good paying jobs have been shipped out of the country.  Millions of other middle class jobs have been lost to technology.  This has resulted in intense competition for the middle class jobs that remain.

And at this point we are even losing lots of lower paying retail jobs.  For example, it is being reported that Sears plans to close 110 more stores and lay off more than 6,000 workers.  Sears says that the report “isn’t accurate”, but it isn’t denying that stores will be closed either…

In an email to USA Today, Sears spokesman Howard Riefs said the store count and closures “isn’t accurate,” but did not provide store closures or layoff numbers.


“As we stated in our (second quarter earnings report), we disclosed that we would be closing unprofitable stores as leases expire and in some cases will accelerate closings when it is economically prudent. And that we would consider closing additional stores during the remainder of the year,” Riefs said. “Make no mistake, we believe the store will continue to play an integral role in our transformation, however, if a store is not generating a profit, it is straightforward that the store should be considered for closure.”

No matter how many stores Sears does end up closing over the next few months, the truth is that our economy is a complete and total mess at this point.

Our politicians and the mainstream media are trying to put a happy face on everything, but the cold, hard numbers prove that we are not anywhere close to where we were prior to the last recession.

Because it is so difficult to find a good job in America today, I often recommend to people that they should consider starting their own businesses.

But thanks to the bureaucratic control freaks in the Obama administration and in our state governments, small business ownership in America today is at an all-time low.  It is almost as if they don’t want the “little guy” to win.  Every avenue of prosperity for the middle class is under assault, and there does not appear to be much hope that this will change any time soon.

And the truly frightening thing is that this is about as good as things are going to get for the middle class.  We are rapidly approaching the next major wave of our long-term economic decline, but that is a topic for a future article.

IT’S GOOD TO BE RICH

After reviewing the following charts I’ve concluded it is better to be rich than poor. There is no question the gap between the richest and poorest is widening. The facts show the rich getting richer, the poor staying poor, and the middle class becoming poorer. You’ll be happy to know pleasure aircraft was the fastest-growing category of all consumer spending in 2013. I guess those food stamp users are living it up. 

The facts don’t lie. The lies happen when you ask people why.

Why is this happening?


The Big Lebowski Housing Market

Guest Post by Anthony Sanders

The Big Lebowski Housing Market: Declining Purchasing Power And Wage Growth … With Rising Home Prices

It has been a rough ride since 2007.

Purchasing power of the US consumer continues to decline and now we have declining average wage earnings (YoY).

purchpoweravaage

These rotten economic indicators are reflected in declining mortgage purchase applications and single family housing starts.

20140904_housing

And to make matters worse for US consumers, house prices have been rising again after the 2008-2009 bust.

ppcs20

With declining purchase power and wage growth, it’s time to find that special rental unit like the one that Jeffrey Lebowski occupied.

Dude House 2

And you can attend a Masters of Real Estate Development (MRED) Program and become a HUD-approved landlord … like Marty!

landlord

And you too can perform a dance cycle for your friends!

dancecycle

TWO CANARIES IN THE CONSUMER COAL MINE

First we have good old Darden Restaurants, purveyor of processed slop to the obese endless bread stick addicted middle class. They pre-announced that they will lose $20 million this quarter. It seems the problem was not just their recently shit canned Red Lobster division. If there really has been excellent job growth as we have been told by Obama and the MSM, why does traffic continue to plunge at the formerly popular Olive Garden and Longhorn Steakhouse? All those great jobs must translate into wage increases and disposable income. Right? The results of this middle class dining chain, along with the continued decline in McDonalds sales are a canary in the coal mine. The middle class has run out of disposable income and is no longer disposing of something it doesn’t have.

Look at the numbers in those charts. Look at how much lower the traffic is than total sales, particularly for Longhorn. Do you know what that means? Longhorn is a steakhouse. Beef prices are at all-time highs. These restaurants are jacking up prices big time. So not only has the middle class run out of disposable income, but real inflation in the real world is raging.

I had never heard of Conn’s until this morning. They are evidently a Texas based retailer with 86 stores selling appliances, furniture and electronics. They have been growing rapidly and opening stores at a healthy clip. They grew their sales by an amazing 29% over last year, with an 11% increase in same store sales. Wow!!! They must be a real sales juggernaut. Well not quite. Their stock dropped 29% this morning.

You see they are another canary in the coal mine of how hard goods retailers and car companies have generated fantastic sales in the last couple years. Subprime and 0% interest debt peddled at prodigious rates to anyone that can breath and scratch an X on a loan document can really juice the top line for awhile. But guess what? The ignorant masses with no jobs actually have to make the payments for it to work out in the end.

It seems Conn’s has generated all of their fabulous sales with 0% deferred plans made to questionable credit worthy customers. Their portfolio of credit receivables grew by 40% while sales grew by 29%. It seems when you make loans to people incapable of paying you back, they eventually default. The delinquency rate is soaring on their $1.2 billion portfolio. Bye Bye profits.

This is the same sale strategy used by the big automakers over the last two years. Those fantastic sales have been a fraud. The bad debt avalanche has just begun. You need income to eat out and you need income to make the debt payments on those 52 inch HDTVs. The middle class is tapped out and more debt will not cure what ails them. The canary is dead.


Darden Announces Expected Fiscal First Quarter Results

ORLANDO, Fla., Sept. 2, 2014 /PRNewswire/ — Darden Restaurants, Inc. DRI, +1.61% today reported that it expects diluted net loss per share from continuing operations for its fiscal first quarter ended August 24, 2014 to be approximately 13 to 15 cents.

Darden also reported that preliminary U.S. same-restaurant sales for the fiscal first quarter by month for Olive Garden and LongHorn Steakhouse were as follows:

Olive Garden June July August
Same-Restaurant Sales -1.0% -4.2% 0.8%
Same-Restaurant Traffic -0.9% -4.3% -2.3%


LongHorn Steakhouse June July August
Same-Restaurant Sales 3.3% 1.5% 3.2%
Same-Restaurant Traffic -1.1% -1.6% 0.2%


Conn’s, Inc. Reports Second-Quarter Fiscal 2015 Financial Results

THE WOODLANDS, Texas, Sep 02, 2014 (BUSINESS WIRE) — Conn’s, Inc. CONN, -28.62% a specialty retailer of furniture, mattresses, home appliances, consumer electronics and provider of consumer credit, today announced its financial results for the second quarter ended July 31, 2014.

Credit segment operating income declined $7.7 million to an operating loss of $0.2 million;
• The percentage of the customer portfolio balance 60+ days delinquent increased 70 basis points sequentially to 8.7% as of July 31, 2014;
• Credit segment provision for bad debts on an annualized basis was 13.9% of the average outstanding portfolio balance in the current quarter and 11.1% on an annualized basis for the first six months of fiscal 2015;
• Diluted earnings was $0.48 per share, compared to $0.52 per share in the prior year;
• Adjusted diluted earnings was $0.50 per share, compared to $0.52 per share a year ago; and
• Full-year fiscal 2015 guidance was updated to a range of $2.80 to $3.00 adjusted earnings per diluted share. The new full-year guidance reflects primarily the impact of higher expected provision for bad debts and the issuance of $250 million in 7.25% senior unsecured notes in July 2014.

“Overall results were not satisfactory. Our credit operations ran into unexpected headwinds, resulting in portfolio performance deterioration. Despite tighter underwriting, lower early-stage delinquency and improved collections staffing and execution, delinquency unexpectedly deteriorated across all credit quality levels, customer groups, product categories, geographic regions and years of origination. Tighter underwriting and better collections execution did not offset deterioration in our customer’s ability to resolve delinquency.

“Delinquency rates improved through May and increased modestly in June, consistent with typical seasonal trends. However, over sixty-day delinquency rates unexpectedly deteriorated a combined 90 basis points in July and August. We now expect future 60-plus day delinquency to increase to levels above our historical highs in the third and fourth quarter of fiscal 2015. Early stage delinquency remains lower than historical averages through August.

“We have made additional minor changes to tighten underwriting in August. Over time, more of the total portfolio will have been originated under the tighter underwriting policies implemented in late fiscal 2014 and early fiscal 2015. Declining sales of electronics as a percentage of total sales, slower expected originations growth and an expected reduction in the percentage of originations to new customers should also benefit future portfolio performance. Longer term, we believe the changes necessary to optimize portfolio performance are in place, although we may not return to credit loss rates of prior years.

“In response to higher delinquency, we are reducing the level of no-interest programs and raising the interest rates in some markets to increase portfolio yield.

THIS IS YOUR RECOVERY AND THIS IS YOUR RECOVERY WITHOUT DRUGS

“If the American people ever allow private banks to control the issue of their currency, first by inflation, then by deflation, the banks…will deprive the people of all property until their children wake-up homeless on the continent their fathers conquered…. The issuing power should be taken from the banks and restored to the people, to whom it properly belongs.”Thomas Jefferson

Does this chart portray an economic recovery in any way? Wages have been stagnant since the START of the supposed recovery in 2010. Real median household income, even using the highly understated CPI, is on a glide path to oblivion. You just need to observe with your own two eyes the number of Space Available signs in front of office buildings, strip centers and malls across America to realize we have further to fall. Low paying, part-time burger flipping jobs aren’t going to revive this debt saturated economic system. But at least the .1% are enjoying their Federal Reserve created high. Fiat is a powerful drug when administered in large doses to addicts on Wall Street.

The S&P 500 has risen from 666 in March of 2009 to 1,972 today. That is a 196% increase in a little over five years. During this same time, real household income has fallen by 7%. There have been a few million jobs added, while 11 million people have left the labor market. According to Robert Shiller’s CAPE ratio, the stock market valuation has only been higher, three times in history – 1929, 1999, and 2007. He seems flabbergasted by why valuations are so high. Sometimes really smart people can act really dumb.

The Federal Reserve balance sheet was $900 billion before the 2008 financial crisis. Today it stands at $4.4 trillion. The Fed has increased their balance sheet by 220% since the March 2009 market lows. Do you think there is any correlation between the Fed puppets printing $2.4 trillion and handing it to their Wall Street puppeteers, who used their high frequency trading supercomputers and ability to rig the markets so they never lose, and the third stock bubble in the last 13 years? It’s so self evident that only an Ivy League economist or CNBC anchor wouldn’t be able to see it.

sp500fedbal


Let’s look at the amazing stock market recovery without Federal Reserve heroine pumped into the veins of Wall Street banker addicts. If you divide the S&P 500 Index by the size of the Federal reserve balance sheet, you see the true purpose of QE1, QE2, and QE3. It wasn’t to save Main Street. It was to save Wall Street. Without the Federal Reserve funneling fiat to the .1% banking cabal and creating inflation in energy, food, and other basic necessities for the 99.9%, there is no stock market recovery. The recovery has occurred in Manhattan and the Hamptons. It’s been non-existent for the vast majority of people in this country. The wealth effect and trickle down theory have been disproved in spades. The only thing trickling down on the former middle class from the Fed is warm and yellow.

sp500fedbalratio

The entire stock market advance has been created on record low trading volumes and record high levels of monetary manipulation. Even though the Federal Reserve has driven senior citizens further into poverty with 0% interest rates, those with common sense have refused to be lured back into the lion’s den. They have parked record levels of fiat in no interest bank and money market accounts. They are tired of being muppets led to slaughter.

Quantitative easing was supposed to force little old ladies into the stock market and consumers to spend their debased dollars before they lost more value. The spending would revive the dormant economy just as the Keynesian text books promised. It didn’t happen. The peasants haven’t cooperated. Quantitative easing and ZIRP sapped the life from the middle class as their wages have stagnated and their living expenses have skyrocketed. Mission Accomplished by the Fed. Of course, the CNBC bimbos and shills would declare this $10.8 trillion to be money on the sidelines ready to boost the stock market ever higher. I love that storyline. It never grows old.

The MSM, government and Wall Street continue to flog the story about a housing recovery. It’s been nothing but a confidence game based upon the Fed’s easy money and the Wall Street scheme to buy up foreclosed properties with the Fed’s money. The scheme was to artificially boost home prices by restricting home supply through foreclosure manipulation, in order to allow the insolvent Wall Street banks to get out from under their billions in toxic mortgage loans.

Shockingly, the Case Shiller home price index has soared by 25% since 2012 despite first time home buyers being virtually non-existent and mortgage applications plunging to 14 year lows. How could that be? Don’t people need mortgages to buy houses? Isn’t real demand necessary to drive prices higher? Not when Uncle Ben and Madam Yellen are in charge of the printing press. Housing bubble 2.0 has arrived. I wonder if the Federal Reserve balance sheet increase of 50% since 2012 has anything to do with the new housing bubble.

It seems a similar result is obtained when dividing the Case Shiller Index by the size of the Fed’s balance sheet. The real housing market for real people is worse than it was in 2009. The national home price increase has been centered in the usual speculative markets, aided and abetted by the Fed’s easy money, managed by the Wall Street hedge funds, and exacerbated by the late arriving flippers who will be left holding the bag again. The Fed/ Wall Street scheme has priced young people out of the market and has failed to ignite the desired Keynesian impact. Investors/flippers account for 34% of all home sales. Foreigners with no knowledge of value metrics account for 30% of all home sales. The lesson of history is that most people don’t learn the lessons of history. The 2nd housing bubble in seven years is seeking a pin.

If ever you needed proof of the confidence game in its full glory, the chart below from Zero Hedge says it all. Mortgage rates have been falling for the past year, home builders have been reporting soaring confidence about the future, and the National Association of Realtors keeps predicting a surge in home buying any minute now. One small problem. Mortgage applications are in free fall, new home sales are at 1991 levels, and existing home sales are falling. Home prices have peaked and are beginning to roll over. The Wall Street hedgies are all looking to exit stage left. Young people are saddled with over a trillion of government issued student loan debt and millions of older subprime borrowers have been lured into more auto loan debt. Home sales will be stagnant for the next decade.


Quantitative easing will cease come October, unless Yellen and Wall Street can create a new “crisis” to cure with more money printing. By every valuation measure used over the last 100 years, stocks are overvalued by at least 50%. By historical measures, home prices are overvalued by at least 30%. Ten year Treasuries are yielding 2.4%, while true inflation is north of 5%. With real interest rates deep in negative territory, the bond market is even more overvalued than stocks or houses. These simultaneous bubbles have been created by the Federal Reserve in a desperate attempt to keep this debt laden ship afloat. Their solution to a ship listing from too much debt was to load it down with trillions more in debt. The ship is taking on water rapidly.

We had a choice. We could have bitten the bullet in 2008 and accepted the consequences of decades of decadence, frivolity, materialism, delusion and debt accumulation. A steep sharp depression which would have purged the system of debt and punishment of those who created the disaster would have ensued. The masses would have suffered, but the rich and powerful bankers would have suffered the most. Today, the economy would be revived, saving and investing would be generating needed capital for expansion, and banks would be doing what they are supposed to do – lending money to businesses and individuals. Instead, the Wall Street bankers won the battle and continue to pillage and loot the national wealth while impoverishing the masses.

The arrogance, hubris and contempt for morality displayed by the ruling class is breathtaking to behold. They think they are untouchable and impervious to norms followed by the rest of society. They may have won the opening battle, but will lose the war. Discontent among the masses grows by the day. The critical thinking citizens are growing restless and angry. They are beginning to grasp the true enemy. The system has been captured by a few malevolent men. When the stock, bond and housing bubbles all implode simultaneously, all hell will break loose in this country. It will make Ferguson, Missouri look like a walk in the park. I wonder if the occupants of the Eccles building in Washington DC will get out alive.

“It is well enough that people of the nation do not understand our banking and money system, for if they did, I believe there would be a revolution before tomorrow morning.”Henry Ford

Charts provided by Confounded Interest

BLS PHANTOM JOBS IN A FAKE RECOVERY

Here we go again. The BLS (Bureau of Lies & Shams) with their monthly propaganda dump that has a confidence interval of about .001%. It’s nothing but bullshit, excel model created, drivel, fed to the masses and designed to provide the Wall Street banks with some excuse for taking the market higher. The fake number came in below expectations, which of course was a positive for the markets. You see, in this warped fucked up country, if too many people get jobs and see their wages increasing, the Federal Reserve would be forced to raise interest rates above 0%. Therefore, the Wall Street shysters would have a harder time borrowing for free and manipulating the stock market higher. Your pain is their gain.

The bankers who run this country love seeing wages growing at 2%, while your everyday living costs rise by 5% to 10%. This forces you to borrow on your credit card at 15% from them in order to survive. Capitalism at its best.

But let’s turn to the latest BLS turd sandwich to see how our awesome economic recovery is progressing:

  • The blaring headline says we added 209,000 jobs in July. Just to let you understand how important excel spreadsheets are to the BLS, the non-seasonally adjusted figure is actually a decrease of 1.1 million.
  • The good old birth death adjustment added 80,000 phantom jobs supposedly created by small businesses. We all know that small businesses are thriving and hiring like mad. Right? What is even more fascinating is that this adjustment should be relatively constant over time for July. In a shocking development, the 80,000 figure was the highest July adjustment in history, 48% higher than last year’s 54,000. It get’s better. Back in 2011 it added 5,000 and in 2010 it subtracted 38,000. The economy is worse this year than last. Why would small businesses, with all the Obamacare mandates, be hiring 48% more people than last year? They aren’t. This 80,000 is complete and utter bullshit.
  • The MSM is downplaying the fact the unemployment rate went up based on the other survey. Let’s examine that data. The working age population went up by 209,000, but the number of employed only went up by 131,000. That is pitiful. And most of these jobs are crappy paying part time service jobs.
  • The number of unemployed went UP by 197,000. Where is that headline? It seems that some of the free shit army was forced back into the labor force as their extended unemployment ran out and their food stamps got cut. It must be getting harder to get on the SSDI rolls as it will run out of money in less than two years.
  • The Obama recovery in the last year has been breathtaking to behold.
    • Working age population – Up 2.3 million
    • Number of people employed – Up 2.1 million
    • Unemployment rate plunges from 7.3% to 6.2%. Hysterical, but this is what your government expects you to believe.
    • 1.9 million Americans have voluntarily left the labor force because their financial situation is SO GOOD, according to your friendly government drones.
    • The labor force participation rate is at 3 decade lows because who needs a job in this economy. It’s a goldilocks economy.

The storyline you will see peddled by CNBC and the Obama loving MSM is that all those Boomers have been retiring, and that is why the participation rate has been plunging. Facts are so inconvenient to the lying fuckers that run this country. It seems those Boomers desperately need jobs because they forgot to save for retirement. Those leased BMWs don’t pay for themselves. The people in their prime earning years lost 142,000 jobs in July. This age group still has 2.5 million less jobs than they had in 2007. If you were wondering why the housing market is tanking and consumer companies are announcing horrible quarterly profits, there is your answer.

Government data – like the American Dream – you’d have to be asleep to believe it.

I SHOULDA BECOME A GAS PASSER

 I’m an excellent gas passer, but sadly they don’t pay me to do it. Why is AWD always in such a bad mood? Look at those wages for doctors.

If you go to the very bottom of the chart you find the Obama jobs. These are the jobs being added in the Obama “Recovery”. When you see the headlines every month about the 180,000 of new jobs, they are mostly low level fry cook, retail clerk, and waitress jobs paying shit wages. That is why the real median household income keeps falling and is lower than it was in 1999.

https://i.imgur.com/NbYbNrs.png

https://i.imgur.com/NbYbNrs.png


ARE YOU SEEING WHAT I’M SEEING?

Is it just me, or are the signs of consumer collapse as clear as a Lowes parking lot on a Saturday afternoon? Sometimes I wonder if I’m just seeing the world through my pessimistic lens, skewing my point of view. My daily commute through West Philadelphia is not very enlightening, as the squalor, filth and lack of legal commerce remain consistent from year to year. This community is sustained by taxpayer subsidized low income housing, taxpayer subsidized food stamps, welfare payments, and illegal drug dealing. The dependency attitude, lifestyles of slothfulness and total lack of commerce has remained constant for decades in West Philly. It is on the weekends, cruising around a once thriving suburbia, where you perceive the persistent deterioration and decay of our debt fixated consumer spending based society.

The last two weekends I’ve needed to travel the highways of Montgomery County, PA going to a family party and purchasing a garbage disposal for my sink at my local Lowes store. Montgomery County is the typical white upper middle class suburb, with tracts of McMansions dotting the landscape. The population of 800,000 is spread over a 500 square mile area. Over 81% of the population is white, with the 9% black population confined to the urban enclaves of Norristown and Pottstown.

The median age is 38 and the median household income is $75,000, 50% above the national average. The employers are well diversified with an even distribution between education, health care, manufacturing, retail, professional services, finance and real estate. The median home price is $300,000, also 50% above the national average. The county leans Democrat, with Obama winning 60% of the vote in 2008. The 300,000 households were occupied by college educated white collar professionals. From a strictly demographic standpoint, Montgomery County appears to be a prosperous flourishing community where the residents are living lives of relative affluence. But, if you look closer and connect the dots, you see fissures in this façade of affluence that spread more expansively by the day. The cheap oil based, automobile dependent, mall centric, suburban sprawl, sanctuary of consumerism lifestyle is showing distinct signs of erosion. The clues are there for all to see and portend a bleak future for those mentally trapped in the delusions of a debt dependent suburban oasis of retail outlets, chain restaurants, office parks and enclaves of cookie cutter McMansions. An unsustainable paradigm can’t be sustained.

The first weekend had me driving along Ridge Pike, from Collegeville to Pottstown. Ridge Pike is a meandering two lane road that extends from Philadelphia, winds through Conshohocken, Plymouth Meeting, Norristown, past Ursinus College in Collegeville, to the farthest reaches of Montgomery County, at least 50 miles in length. It served as a main artery prior to the introduction of the interstates and superhighways that now connect the larger cities in eastern PA. Except for morning and evening rush hours, this road is fairly sedate. Like many primary routes in suburbia, the landscape is engulfed by strip malls, gas stations, automobile dealerships, office buildings, fast food joints, once thriving manufacturing facilities sitting vacant and older homes that preceded the proliferation of cookie cutter communities that now dominate what was once farmland.

Telltale Signs


I should probably be keeping my eyes on the road, but I can’t help but notice the telltale signs of an economic system gone haywire. As you drive along, the number of For Sale signs in front of homes stands out. When you consider how bad the housing market has been, the 40% decline in national home prices since 2007, the 30% of home dwellers underwater on their mortgage, and declining household income, you realize how desperate a home seller must be to try and unload a home in this market. The reality of the number of For Sale signs does not match the rhetoric coming from the NAR, government mouthpieces, CNBC pundits, and other housing recovery shills about record low inventory and home price increases.

The Federal Reserve/Wall Street/U.S. Treasury charade of foreclosure delaying tactics and selling thousands of properties in bulk to their crony capitalist buddies at a discount is designed to misinform the public. My local paper lists foreclosures in the community every Monday morning. In 2009 it would extend for four full pages. Today, it still extends four full pages. The fact that Wall Street bankers have criminally forged mortgage documents, people are living in houses for two years without making mortgage payments, and the Federal Government backing 97% of all mortgages while encouraging 3.5% down financing does not constitute a true housing recovery. Show me the housing recovery in these charts.

Existing home sales are at 1998 levels, with 45 million more people living in the country today.

New single family homes under construction are below levels in 1969, when there were 112 million less people in the country.

Another observation that can be made as you cruise through this suburban mecca of malaise is the overall decay of the infrastructure, appearances and disinterest or inability to maintain properties. The roadways are potholed with fading traffic lines, utility poles leaning and rotting, and signage corroding and antiquated. Houses are missing roof tiles, siding is cracked, gutters astray, porches sagging, windows cracked, a paint brush hasn’t been utilized in decades, and yards are inundated with debris and weeds. Not every house looks this way, but far more than you would think when viewing the overall demographics for Montgomery County. You wonder how many number among the 10 million vacant houses in the country today. The number of dilapidated run down properties paints a picture of the silent, barely perceptible Depression that grips the country today. With such little sense of community in the suburbs, most people don’t even know their neighbors. With the electronic transfer of food stamps, unemployment compensation, and other welfare benefits you would never know that your neighbor is unemployed and hasn’t made the mortgage payment on his house in 30 months. The corporate fascist ruling plutocracy uses their propaganda mouthpieces in the mainstream corporate media and government agency drones to misinform and obscure the truth, but the data and anecdotal observational evidence reveal the true nature of our societal implosion.

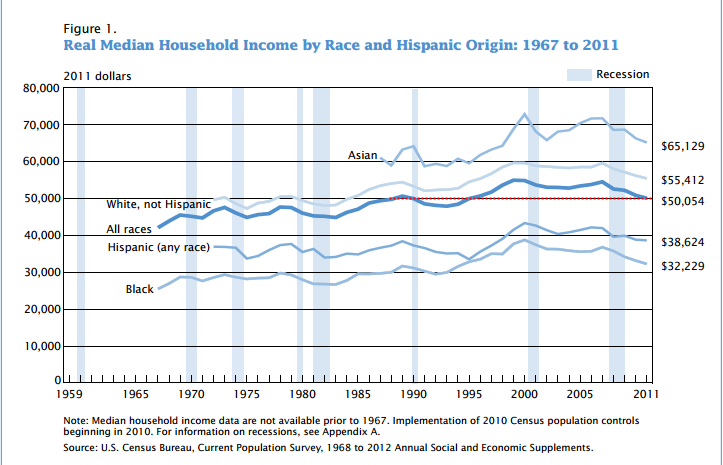
A report by the Census Bureau this past week inadvertently reveals data that confirms my observations on the roadways of my suburban existence. Annual household income fell in 2011 for the fourth straight year, to an inflation-adjusted $50,054. The median income — meaning half earned more, half less — now stands 8.9% lower than the all-time peak of $54,932 in 1999. It is far worse than even that dreadful result. Real median household income is lower than it was in 1989. When you understand that real household income hasn’t risen in 23 years, you can connect the dots with the decay and deterioration of properties in suburbia. A vast swath of Americans cannot afford to maintain their residences. If the choice is feeding your kids and keeping the heat on versus repairing the porch, replacing the windows or getting a new roof, the only option is survival.

US GDP vs. Median Household Income

All races have seen their income fall, with educational achievement reflected in the much higher incomes of Whites and Asians. It is interesting to note that after a 45 year War on Poverty the median household income for black families is only up 19% since 1968.
real household income

Now for the really bad news. Any critical thinking person should realize the Federal Government has been systematically under-reporting inflation since the early 1980’s in an effort to obscure the fact they are debasing the currency and methodically destroying the lives of middle class Americans. If inflation was calculated exactly as it was in 1980, the GDP figures would be substantially lower and inflation would be reported 5% higher than it is today. Faking the numbers does not change reality, only the perception of reality. Calculating real median household income with the true level of inflation exposes the true picture for middle class America. Real median household income is lower than it was in 1970, just prior to Nixon closing the gold window and unleashing the full fury of a Federal Reserve able to print fiat currency and politicians to promise the earth, moon and the sun to voters. With incomes not rising over the last four decades is it any wonder many of our 115 million households slowly rot and decay from within like an old diseased oak tree. The slightest gust of wind can lead to disaster.

Eliminating the last remnants of fiscal discipline on bankers and politicians in 1971 accomplished the desired result of enriching the top 0.1% while leaving the bottom 90% in debt and desolation. The Wall Street debt peddlers, Military Industrial arms dealers, and job destroying corporate goliaths have reaped the benefits of financialization (money printing) while shoveling the costs, their gambling losses, trillions of consumer debt, and relentless inflation upon the working tax paying middle class. The creation of the Federal Reserve and implementation of the individual income tax in 1913, along with leaving the gold standard has rewarded the cabal of private banking interests who have captured our economic and political systems with obscene levels of wealth, while senior citizens are left with no interest earnings ($400 billion per year has been absconded from savers and doled out to bankers since 2008 by Ben Bernanke) and the middle class has gone decades seeing their earnings stagnate and their purchasing power fall precipitously.


The facts exposed in the chart above didn’t happen by accident. The system has been rigged by those in power to enrich them, while impoverishing the masses. When you gain control over the issuance of currency, issuance of debt, tax system, political system and legal apparatus, you’ve essentially hijacked the country and can funnel all the benefits to yourself and costs to the math challenged, government educated, brainwashed dupes, known as the masses. But there is a problem for the 0.1%. Their sociopathic personalities never allow them to stop plundering and preying upon the sheep. They have left nothing but carcasses of the once proud hard working middle class across the country side. There are only so many Lear jets, estates in the Hamptons, Jaguars, and Rolexes the 0.1% can buy. There are only 152,000 of them. Their sociopathic looting and pillaging of the national wealth has destroyed the host. When 90% of the population can barely subsist, collapse and revolution beckon.

Extend, Pretend & Depend

As I drove further along Ridge Pike we passed the endless monuments to our spiral into the depths of materialism, consumerism, and the illusion that goods purchased on credit represented true wealth. Mile after mile of strip malls, restaurants, gas stations, and office buildings rolled by my window. Anyone who lives in the suburbs knows what I’m talking about. You can’t travel three miles in any direction without passing a Dunkin Donuts, KFC, McDonalds, Subway, 7-11, Dairy Queen, Supercuts, Jiffy Lube or Exxon Station. The proliferation of office parks to accommodate the millions of paper pushers that make our service economy hum has been unprecedented in human history. Never have so many done so little in so many places. Everyone knows what a standard American strip mall consists of – a pizza place, a Chinese takeout, beer store, a tanning, salon, a weight loss center, a nail salon, a Curves, karate studio, Gamestop, Radioshack, Dollar Store, H&R Block, and a debt counseling service. They are a reflection of who we’ve become – an obese drunken species with excessive narcissistic tendencies that prefers to play video games while texting on our iGadgets as our debt financed lifestyles ultimately require professional financial assistance.

What you can’t ignore today is the number of vacant storefronts in these strip malls and the overwhelming number of SPACE AVAILABLE, FOR LEASE, and FOR RENT signs that proliferate in front of these dying testaments to an unsustainable economic system based upon debt fueled consumer spending and infinite growth assumptions. The booming sign manufacturer is surely based in China. The officially reported national vacancy rates of 11% are already at record highs, but anyone with two eyes knows these self-reported numbers are a fraud. Vacancy rates based on my observations are closer to 30%. This is part of the extend and pretend strategy that has been implemented by Ben Bernanke, Tim Geithner, the FASB, and the Wall Street banking cabal. The fraud and false storyline of a commercial real estate recovery is evident to anyone willing to think critically. The incriminating data is provided by the Federal Reserve in their Quarterly Delinquency Report.

The last commercial real estate crisis occurred in 1991. Mall vacancy rates were at levels consistent with today.

The current reported office vacancy rates of 17.5% are only slightly below the 19% levels of 1991.

As reported by the Federal Reserve, delinquency rates on commercial real estate loans in 1991 were 12%, leading to major losses among the banks that made those imprudent loans. Amazingly, after the greatest financial collapse in history, delinquency rates on commercial loans supposedly peaked at 8.8% in the 2nd quarter of 2010 and have now miraculously plummeted to pre-collapse levels of 4.9%. This is while residential loan delinquencies have resumed their upward trajectory, the number of employed Americans has fallen by 414,000 in the last two months, 9 million Americans have left the labor force since 2008, and vacancy rates are at or near all-time highs. This doesn’t pass the smell test. The Federal Reserve, owned and controlled by the Wall Street, instructed these banks to extend all commercial real estate loans, pretend they will be paid, and value them on their books at 100% of the original loan amount. Real estate developers pretend they are collecting rent from non-existent tenants, Wall Street banks pretend they are being paid by the developers, and their highly compensated public accounting firm pretends the loans aren’t really delinquent. Again, the purpose of this scam is to shield the Wall Street bankers from accepting the losses from their reckless behavior. Ben rewards them with risk free income on their deposits, propped up by mark to fantasy accounting, while they reward themselves with billions in bonuses for a job well done. The master plan requires an eventual real recovery that isn’t going to happen. Press releases and fake data do not change the reality on the ground.

I have two strip malls within three miles of my house that opened in 1990. When I moved to the area in 1995, they were 100% occupied and a vital part of the community. The closest center has since lost its Genuardi grocery store, Sears Hardware, Blockbuster, Donatos, Sears Optical, Hollywood Tans, hair salon, pizza pub and a local book store. It is essentially a ghost mall, with two banks, a couple chain restaurants and empty parking spaces. The other strip mall lost its grocery store anchor and sporting goods store. This has happened in an outwardly prosperous community. The reality is the apparent prosperity is a sham. The entire tottering edifice of housing, autos, and retail has been sustained by ever increasing levels of debt for the last thirty years and the American consumer has hit the wall. From 1950 through the early 1980s, when the working middle class saw their standard of living rise, personal consumption expenditures accounted for between 60% and 65% of GDP. Over the last thirty years consumption has relentlessly grown as a percentage of GDP to its current level of 71%, higher than before the 2008 collapse.

If the consumption had been driven by wage increases, then this trend would not have been a problem. But, we already know real median household income is lower than it was in 1970. The thirty years of delusion were financed with debt – peddled, hawked, marketed, and pushed by the drug dealers on Wall Street. The American people got hooked on debt and still have not kicked the habit. The decline in household debt since 2008 is solely due to the Wall Street banks writing off $800 billion of mortgage, credit card, and auto loan debt and transferring the cost to the already drowning American taxpayer.
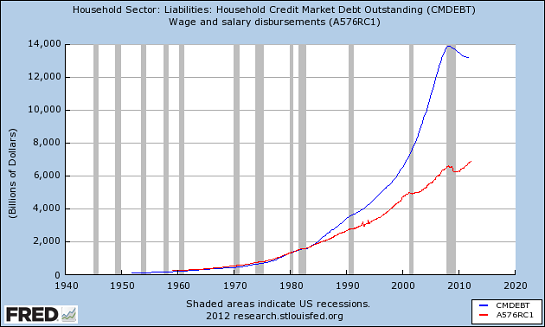
The powers that be are desperately attempting to keep this unsustainable, dysfunctional debt choked scheme from disintegrating by doling out more subprime auto debt, subprime student loan debt, low down payment mortgages, and good old credit card debt. It won’t work. The consumer is tapped out. Last week’s horrific retail sales report for August confirmed this fact. Declining household income and rising costs for energy, food, clothing, tuition, taxes, health insurance, and the other things needed to survive in the real world, have broken the spirit of Middle America. The protracted implosion of our consumer society has only just begun. There are thousands of retail outlets to be closed, hundreds of thousands of jobs to be eliminated, thousands of malls to be demolished, and billions of loan losses to be incurred by the criminal Wall Street banks.

The Faces of Failure & Futility

My fourteen years working in key positions for big box retailer IKEA has made me particularly observant of the hubris and foolishness of the big chain stores that dominate the retail landscape.  There are 1.1 million retail establishments in the United States, but the top 25 mega-store national chains account for 25% of all the retail sales in the country. The top 100 retailers operate 243,000 stores and account for approximately $1.6 trillion in sales, or 36% of all the retail sales in the country. Their misconceived strategic plans assumed 5% same store growth for eternity, economic growth of 3% per year for eternity, a rising market share, and ignorance of the possible plans of their competitors. They believed they could saturate a market without over cannibalizing their existing stores. Wal-Mart, Target, Best Buy, Home Depot and Lowes have all hit the limits of profitable expansion. Each incremental store in a market results in lower profits.

My trip to my local Lowes last weekend gave me a glimpse into a future of failure and futility. Until 2009, I had four choices of Lowes within 15 miles of my house. There was a store 8 miles east, 12 miles west, 15 miles north, and 15 miles south of my house. In an act of supreme hubris, Lowes opened a store smack in the middle of these four stores, four miles from my house. The Hatfield store opened in early 2009 and I wrote an article detailing how Lowes was about to ruin their profitability in Montgomery County. It just so happens that I meet a couple of my old real estate buddies from IKEA at a local pub every few months. In 2009 one of them had a real estate position with Lowes and we had a spirited discussion about the prospects for the Lowes Hatfield store. He assured me it would be a huge success. I insisted it would be a dud and would crush the profitability of the market by cannibalizing the other four stores. We met at that same pub a few months ago. Lowes had laid him off and he admitted to me the Hatfield store was a disaster.

I pulled into the Lowes parking lot at 11:30 am on a Saturday. Big Box retailers do 50% of their business on the weekend. The busiest time frame is from 11:00 am to 2:00 pm on Saturday. Big box retailers build enough parking spots to handle this peak period. The 120,000 square feet Hatfield Lowes has approximately 1,000 parking spaces. I pulled into the spot closest to the entrance during their supposed peak period. There were about 70 cars in the parking lot, with most probably owned by Lowes workers. It is a pleasure to shop in this store, with wide open aisles, and an employee to customer ratio of four to one. The store has 14 checkout lanes and at peak period on a Saturday, there was ONE checkout lane open, with no lines. This is a corporate profit disaster in the making, but the human tragedy far overrides the declining profits of this mega-retailer.

As you walk around this museum of tools and toilets you notice the looks on the faces of the workers. These aren’t the tattooed, face pierced freaks you find in many retail establishments these days. They are my neighbors. They are the beaten down middle class. They are the middle aged professionals who got cast aside by the mega-corporations in the name of efficiency, outsourcing, right sizing, stock buybacks, and executive stock options. The irony of this situation is lost on those who have gutted the American middle class. When you look into the eyes of these people, you see sadness, confusion and embarrassment. They know they can do more. They want to do more. They know they’ve been screwed, but they aren’t sure who to blame. They were once the very customers propelling Lowes’ growth, buying new kitchens, appliances, and power tools. Now they can’t afford a can of paint on their $10 per hour, no benefit retail careers. As depressing as this portrait appears, it is about to get worse.

This Lowes will be shut down and boarded up within the next two years. The parking lot will become a weed infested eyesore occupied by 14 year old skateboarders. One hundred and fifty already down on their luck neighbors will lose their jobs, the township will have a gaping hole in their tax revenue, and the CEO of Lowes will receive a $50 million bonus for his foresight in announcing the closing of 100 stores that he had opened five years before. This exact scenario will play out across suburbia, as our unsustainable system comes undone. Our future path will parallel the course of the labor participation rate. Just as the 9 million Americans who have “left” the labor force since 2008 did not willfully make that choice, the debt burdened American consumer will be dragged kicking and screaming into the new reality of a dramatically reduced standard of living.

Connecting the dots between my anecdotal observations of suburbia and a critical review of the true non-manipulated data bestows me with a not optimistic outlook for the coming decade. Is what I’m seeing just the view of a pessimist, or are you seeing the same thing?

A few powerful men have hijacked our economic, financial and political structure. They aren’t socialists or capitalists. They’re criminals. They created the culture of materialism, greed and debt, sustained by prodigious levels of media propaganda. Our culture has been led to believe that debt financed consumption over morality and justice is the path to success. In reality, we’ve condemned ourselves to a slow painful death spiral of debasement and despair.

“A culture that does not grasp the vital interplay between morality and power, which mistakes management techniques for wisdom, and fails to understand that the measure of a civilization is its compassion, not its speed or ability to consume, condemns itself to death.” – Chris Hedges

order non hybrid seeds

TAKE THIS JOB AND SHOVE IT

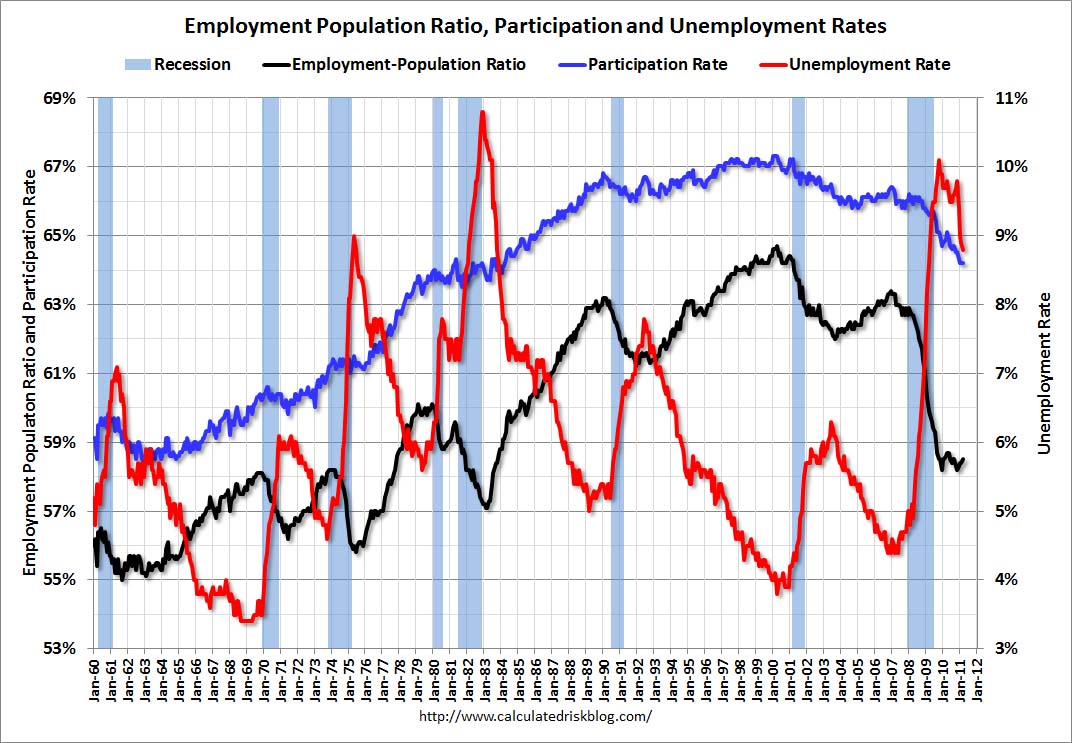
Barack Obama and his minions were out in force on Friday declaring that the 216,000 jobs added in February are proof of a recovering economy. The unemployment rate fell to 8.8%, down from 9.8% in April 2010. All it took was 2.8 million Americans to leave the labor force to achieve this fabulous reduction in the unemployment rate. The percentage of Americans in the labor force of 64.2% is the lowest since 1983. The employment to population ratio of 58.5% is also the lowest since 1983. These atrocious figures are after a supposed economic recovery that has been underway for the last 18 months.

There are now 1.8 million more people employed than at the depths of this Greater Depression. The working age population has grown by 3.2 million people since 2009. Inexplicably, the civilian workforce has actually declined by 736,000 over this same time frame. The government drones at the BLS want us to believe these people voluntarily left the workforce. Obama apologists declare this is because Baby Boomers are leaving the workforce as they retire into the sunset. That is laughable, as all studies show Boomers have not saved enough to retire and will be forced to work into their 70’s.

The manipulation of data in order to spin the economic situation in this country in the best light possible has become so blatant that only the most ignorant could possibly believe it. The corporate mainstream media dutifully reports the propaganda, without ever critically assessing what is being distributed by the government. The percentage of the American working population in the workforce consistently ranged between 66% and 67% from 1998 through 2008. Then, suddenly in 2008, after the economy went in the tank, a couple million Americans found better things to do with their spare time and left the workforce. Anyone with an ounce of brains knows these people gave up and are really unemployed. The percentage of people in the labor force should be 66.5%. Using this 20 year average would add 5.5 million people to the civilian labor force and the unemployment rolls. This exercise in reality gives a real unemployment rate of 12%.

It is interesting that Obama and his top economic propagandist Austin Goolsbee were out in full force on Friday, taking credit for the “tremendous” job gains, but had nothing to say earlier in the week with a much more revealing government report. There is now an all-time high of 44.2 million Americans and 20.7 million households in the food stamp program. This is 14.3% of the American population and 18% of all the households.

I’d like to hear the Administration spin for the SNAP program. Since the supposed end of this economic recession in late 2009, the number of people added to the food stamp rolls has increased by 8 million. The annual cost for this program will reach $70 billion this year, up from $33 billion in 2007. If the economy is recovering and people are voluntarily leaving the workforce, why have the number of people on food stamps increased by 22% since the official start of the recovery? Why does the number of people going on food stamps go up every month? The answer is that there has been no economic recovery for the average American. Wall Street bankers and the ultra-wealthy elite are the only people who have experienced a recovery.

SUPPLEMENTAL NUTRITION ASSISTANCE PROGRAM
( Data as of March 31, 2011)
Fiscal PARTICIPATION BENEFIT AVERAGE MONTHLY BENEFIT
Year Persons Households COSTS Per Person Per Household
FY 2011 43,766,713 20,501,213 23,348,337,586 133.37 284.73
FY 2010 40,301,666 18,618,363 64,704,748,421 133.79 289.61
FY 2009 33,489,975 15,232,115 50,359,917,015 125.31 275.51

The true picture of the American economy is that in 2007 there were 146 million Americans employed, or 63% of the working age population. Today, there are 139.9 million Americans employed, or 58.5% of the working age population. Over this time frame, an additional 7.1 million Americans entered the working age population. In 2007 there were 26.3 million Americans on food stamps, or 8.6% of the US population. Today there are 44.2 million Americans on food stamps, or 14.3% of the US population. To call the current economic disaster a recovery is to practice the art of the Big Lie.

Real Median Household Income, which is calculated using the dodgy government CPI, has not grown in 14 years. Using a true, non-manipulated inflation figure and real median household income is no higher than it was in 1987. The mainstream media reports the headline figures like the good lapdogs they are. The BLS Establishment data going back to 1965 is a treasure trove of interesting data. The average hourly wages have declined for the last three months and are essentially flat in the last year.

real median household income

Decades of Decay

The current state of disarray in the job market did not occur overnight. It took decades of bad choices, willful ignorance and delusion. By charting BLS data over the last five decades, a picture of an empire in decay appears before your very eyes. We aren’t the first empire to experience this decay and won’t be the last. It is only in retrospect that it becomes clear that all empires gravitate from producing and creating to finance, debt and lending. The hubris of great empires leads them to believe they have been chosen by God as a special nation destined for eternal wealth and success. The seventeenth century Spanish empire thought so. The Dutch and their glorious maritime empire thought so. The all-powerful British Empire thought so. Do you hear much about these empires anymore? They all sacrificed productive activities and embraced the glories of a debt based society. Kevin Phillips details these declines in his brilliant book American Theocracy :

“Understandable as this cockiness might be, history teaches a crucial distinction: nations could marshal the necessary debt-defying high wire walks and comebacks during their youth and early middle age, when their industries, exports, capitalizations, and animal spirits were vital and expansive, but they became less resilient in later years. During these periods, as their societies polarized and their arteries clogged with rentier and debt buildups, wars and financial crises stopped being manageable. Of course, clarity about this develops only in retrospect. However, even though war related debt seems to have been part of each fatal endgame, the past leading world economic powers seem to have made another error en route. They did not pay enough attention to establishing or maintaining a vital manufacturing sector, thereby keeping a better international balance and a broader internal income distribution than financialization allowed.”

The chart below paints a clear picture of decay, debt and delusion. In 1961 the population of the United States was 184 million. There were 54 million employed Americans, with 15 million of them manufacturing goods for America and the rest of the world. Today the population of the United States is 310 million. There are 11.7 million people manufacturing goods, mostly weapons for export to our favorite despots. The population has grown by 68%, while manufacturing jobs have declined by 22%. Consumer spending accounted for 62.8% of GDP in 1961. Investments totaled 14.3% of GDP and we ran a trade surplus of $4.9 billion. Today, consumer spending accounts for 71.1% of GDP. Investments total 12.5% of GDP and we are running a $500 billion trade deficit. Over the course of 50 years, we’ve devolved from a production and exporting society into a consuming and borrowing society.


1961 1970 1980 1990 2000 2007 2010 Mar-11
Total Employment 54,106 71,005 90,530 109,487 131,786 137,599 129,819 130,738
Mining 728 677 1,077 765 599 724 705 758
Construction 2,908 3,654 4,454 5,263 6,787 7,630 5,526 5,514
Manufacturing 15,011 17,848 18,733 17,695 17,263 13,879 11,524 11,667
 Total Goods Producing 18,647 22,179 24,264 23,723 24,649 22,233 17,755 17,939
Trade, Transport, Utilities 11,040 14,144 18,413 22,666 26,225 26,630 24,605 24,797
Information 1,693 2,041 2,361 2,688 3,630 3,032 2,711 2,681
Finance 2,590 3,532 5,025 6,614 7,687 8,301 7,630 7,610
Professional & Business Services 3,744 5,267 7,544 10,848 16,666 17,942 16,688 17,075
Education & Health Serv. 3,030 4,577 7,072 10,984 15,109 18,322 19,564 19,875
Leisure & Hospitality 3,468 4,789 6,721 9,288 11,862 13,427 13,020 13,156
Other Services 1,188 1,789 2,755 4,261 5,168 5,494 5,364 5,439
Government 8,706 12,687 16,375 18,415 20,790 22,218 22,482 22,166
   Total Service Producing 35,459 48,826 66,266 85,764 107,137 115,366 112,064 112,799

A perusal of the chart shows the dramatic downturn has really occurred since 1980. Goods producing jobs have declined by 6.3 million in the last 30 years, while service jobs have grown by 46.5 million. Who would want to get their hands dirty on an assembly line when they could shuffle papers, invent CDOs, MBOs, and CDSs, create financial models to destroy the world, bribe rating agencies, file frivolous lawsuits, teach Keynesianism, or use the 60,000 page IRS code to help GE pay no taxes on their $14 billion of income. Alan Greenspan and many other “thought leaders” declared that America could succeed through its ingenuity and creative thought process. The rest of the world could handle the messy business of building things. So goes the hubris of an empire that has peaked. To get a clearer view of the conversion from a productive society to a consumption society, converting the above chart to a percentage basis is useful.

1961 1970 1980 1990 2000 2007 2010 Mar-11
Total Employment 100.0% 100.0% 100.0% 100.0% 100.0% 100.0% 100.0% 100.0%
Mining 1.3% 1.0% 1.2% 0.7% 0.5% 0.5% 0.5% 0.6%
Construction 5.4% 5.1% 4.9% 4.8% 5.2% 5.5% 4.3% 4.2%
Manufacturing 27.7% 25.1% 20.7% 16.2% 13.1% 10.1% 8.9% 8.9%
   Total Goods Producing 34.5% 31.2% 26.8% 21.7% 18.7% 16.2% 13.7% 13.7%
Trade, Transport, Utilities 20.4% 19.9% 20.3% 20.7% 19.9% 19.4% 19.0% 19.0%
Information 3.1% 2.9% 2.6% 2.5% 2.8% 2.2% 2.1% 2.1%
Finance 4.8% 5.0% 5.6% 6.0% 5.8% 6.0% 5.9% 5.8%
Professional & Business Services 6.9% 7.4% 8.3% 9.9% 12.6% 13.0% 12.9% 13.1%
Education & Health Serv. 5.6% 6.4% 7.8% 10.0% 11.5% 13.3% 15.1% 15.2%
Leisure & Hospitality 6.4% 6.7% 7.4% 8.5% 9.0% 9.8% 10.0% 10.1%
Other Services 2.2% 2.5% 3.0% 3.9% 3.9% 4.0% 4.1% 4.2%
Government 16.1% 17.9% 18.1% 16.8% 15.8% 16.1% 17.3% 17.0%
   Total Service Producing 65.5% 68.8% 73.2% 78.3% 81.3% 83.8% 86.3% 86.3%

In 1961 America was a well balanced economic powerhouse. Goods production accounted for 34.5% of all jobs, with manufacturing making up 27.7% of all jobs. Goods production now accounts for a pitiful 13.7% of all jobs in the country. The slack was picked up by financial analysts, accountants, lawyers, tax specialists, and bankers. They surged from supporting roles in a production society with 11.7% of the jobs in 1961 to the dominant big dogs today, with 18.9% of the jobs. The rest of the slack was taken up by teachers, school administrators, nurses, cabana boys and waitresses as they surged from 12% in 1961 to 25.3% of all jobs today. There is one problem with this shift. We have millions more educators, but our school systems churn out millions of functionally illiterate non-critical thinking drones. We have millions more healthcare professionals and are the most obese, unhealthy nation on earth even though we spend more per person than any other country. A country that employs one quarter of their workers in jobs that do not increase the wealth of the country is a country in decline. This shift has also pushed people into lower paying jobs.

1965 1970 1980 1990 2000 2007 2010 Mar-11
Total Private Industry $2.63 $3.40 $6.85 $10.20 $14.02 $17.43 $19.07 $19.30
Mining $2.87 $3.77 $8.97 $13.40 $16.55 $20.97 $23.83 $24.68
Construction $3.23 $4.74 $9.37 $13.42 $17.48 $20.95 $23.22 $23.36
Manufacturing $2.49 $3.23 $7.15 $10.78 $13.55 $17.26 $18.61 $18.90
   Total Goods Producing $2.63 $3.52 $7.66 $11.46 $15.27 $18.67 $20.28 $20.48
Trade, Transport, Utilities $2.94 $3.65 $7.04 $9.83 $13.31 $15.78 $16.83 $16.99
Information $4.47 $5.25 $9.47 $13.40 $19.07 $23.96 $25.86 $25.99
Finance $2.38 $3.07 $5.82 $9.99 $14.98 $19.64 $21.49 $21.63
Professional & Business Serv. $3.28 $4.04 $7.22 $11.14 $15.52 $20.15 $22.78 $23.10
Education & Health Services $2.12 $2.88 $5.93 $10.00 $13.95 $18.11 $20.12 $20.45
Leisure & Hospitality $1.17 $1.82 $3.98 $6.02 $8.32 $10.41 $11.31 $11.38
Other Services $1.25 $2.01 $5.05 $9.08 $12.73 $15.42 $17.08 $17.23
   Total Service Producing $2.63 $3.34 $6.43 $9.72 $13.62 $17.11 $18.81 $19.05
Consumer Price Index 31.50 38.80 82.40 130.70 172.20 207.34 218.06 221.31

The insidious effects of Federal Reserve generated inflation can be seen in the above chart. The BLS Establishment data going back to 1965 reveals much about the hidden impact of inflation over time. In 1965 the average hourly wage was $2.65. Back then, Americans put in a full work week, averaging 38.6 hours per week. The average American was making $101.52 per week. This was enough for a family to live comfortably on with only one spouse working. Fast forward to today and we have an average wage of $19.30 per hour and work week of 33.4 hours. This yields an average weekly pay of $644.62. It is also necessary for most households to have two working spouses to make ends meet. I added the government reported CPI at the bottom of the chart to provide some perspective on our 50 years of middle class wage compression. Applying the change in CPI since 1965 to the change in average weekly earnings provides the clearest view of what has been done to our country by the Federal Reserve and the government/corporate oligarchy. It would have taken weekly wages of $713.25 to have kept up with inflation since 1965. The average worker today is making 10% less than they did in 1965, on an inflation adjusted basis.

Wages in the service industries fell behind by even more, with the exception of bankers, doctors and teachers. The finance sector wages and the healthcare/education sector wages are 25% higher than their inflation adjusted wages in 1965. You reap what you sow. The country has decided that bankers, doctors, and teachers are relatively more important to our economy than people who make products, create wealth, and increase the productive capacity of the country. Any impartial outcome based assessment of these choices would conclude these choices have been an unmitigated failure.

The financial/ banking sector has peddled debt to the masses that didn’t realize their standard of living has been declining for 50 years, and blew up the worldwide financial system through their greed and fraudulent business practices. We spend more per child on education than any country in the world and test scores are lower than they were 40 years ago. Our children graduate high school with no critical thinking skills and the inability to decipher propaganda from truth. We spend more per person on healthcare than any other country, but obesity, diabetes, and heart disease are rampant. Administrative bureaucracy and vast amounts of rules and regulations consume billions in these sectors of our economy. The simple art of creating and producing things that other people need or want has been cast aside by a country who thought they could borrow and spend their way to long-term prosperity.

So, here we find ourselves 18 months into a “recovery” and the country has added 1.3 million jobs in the last year. We’ve added 529,000 lawyers, accountants, consultants and tax specialists. We’ve added 420,000 teachers, nurses and administrators. We’ve added 193,000 waitresses and hotel busboys. And we’ve added 238,000 Wal-Mart clerks. Our well balanced economy is back in gear. What could go wrong?

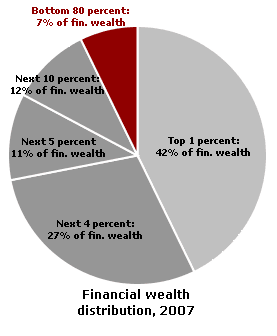
The truth is that the country remains in a 50 year death spiral of bad choices, delusion and fraud, created to benefit the few at the expense of the many. The average American wallows in a reality of low wages and high debt. Some of this reality has been self inflicted. Willful ignorance is a choice. Educating yourself to the truth is available to every American. Spending less than you make is something everyone can do. But, at the end of the day, the 1% at the top of the food chain controls the levers in this country. While the average American has fallen behind over the last 50 years, the ultra-wealthy elite have prospered.   The top 1% takes home 25% of the national income and control 40% of the financial wealth in the country. Their lives have improved considerably. Twenty-five years ago, the ruling elite “earned” 12% of the national income and controlled 33% of the financial wealth. These are the people who control the message. They own the mainstream media. They run the Wall Street banks. They control the Federal Reserve. They write the laws and the tax code. They control the politicians like puppets on a string. An economic system based upon debt and Federal Reserve generated inflation benefits these chosen few, while destroying the middle class of America. We’ve chosen this path and are destined to experience the same fate as Spain, the Dutch, and Britain.