

Guest Post by John P. Hussman
Whether or not it is fully appreciated, we are observing extremes in nearly every pendulum of the global financial markets. The situation is likely to be seen in hindsight as one of the broadest points of financial distortion in history. Broadest, because unlike the 2000 peak when technology and large capitalization stocks were more overvalued on reliable measures than they are today, the median stock is now more overvalued than in 2000. It’s true that on historically reliable valuation measures that are best correlated with actual subsequent total returns on stocks, the 2000 peak remains the most overvalued point for the S&P 500 in U.S. history, though only about 20% above present valuation levels on those measures (there are certainly many popular but unreliable measures that suggest only moderate overvaluation here). Aside from that 2000 peak, the S&P 500 itself is now more overvalued than at the 1929 peak, not to mention the lesser 1972, 1987 and 2007 extremes. We estimate that the S&P 500 Index is likely to be below its present level a decade from now, though adding dividends is likely to raise the nominal total return to about 1.6% annually on a 10-year horizon.
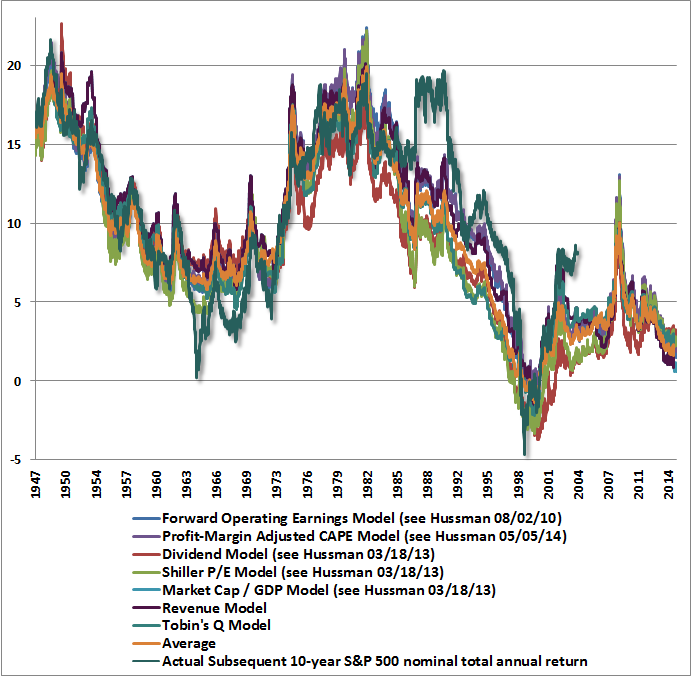
The chart below presents our estimates of prospective 10-year S&P 500 total returns based on a variety of historically reliable measures. See Ockham’s Razor and the Market Cycle to review the arithmetic underlying these estimates. You’ll notice that there are a few points where actual 10-year market returns were different from those that were projected by these methods a decade earlier. The most extreme among those points are 1964 (when actual market returns over the following decade were lower than expected), 1988-1990, and 2005 (when actual market returns over the following decade were higher than expected). Those differences are informative, because they highlight points where market valuations – instead of normalizing – reached historic extremes at the end of the 10-year projection horizon (1974, 1998-2000 and 2015, respectively). The 1974 low and the 1998-2000 peak are memorable for being two of the most extreme points in U.S. market history. We expect nothing less for 2015. See last week’s comment What Does that Difference Mean? for more discussion.
Next, consider the bond market. Unlike 2000, when 10-year Treasury yields of 6.5% still offered somewhere to hide, the present environment offers bond yields to investors that are scarcely higher than 2% in the U.S., with German yields at negative levels even beyond a 5-year maturity. In recent years, yield-seeking speculation has encouraged record issuance of junk debt and “covenant lite” leveraged loans (loans to already highly-indebted borrowers). This is simply a different iteration of what we observed prior to the mortgage crisis, when the yield-seeking security of choice was mortgage debt, and Wall Street’s rush to create more “product” fueled a speculative housing boom as credit was extended to borrowers lacking durable creditworthiness. The current episode is likely to end just as badly, though even more concentrated on the equity market, as a primary object of speculation in recent years has been debt issuance for the purpose of leveraged buyouts and equity buybacks, all of which looks fine only while historically volatile corporate profit margins remain extended at cyclical extremes.
Read the Rest of the Weekly Letter

