

By John Hussman
Since its 2014 high on December 29, the S&P 500 Index has gained 1.5% (not including a fraction of a percent in dividends), the Dow Industrial Average has gained 1.3%, the Dow Transportation Average is down -5.8%, the Dow Utilities Average is down -8.9%, market breadth has churned sideways, and investment grade corporate spreads are flat (though junk spreads have come in about two-tenths of a percent). The Nasdaq has been the star performer, with a 5% gain driven by glamour tech and internet stocks. The last week of December, the NYSE registered 478 new highs and 72 new lows.
Last week, with the S&P 500 registering a marginal record high, the NYSE registered only 198 new highs, with 118 new lows. Since December, in weeks when the S&P 500 has declined, NYSE trading volume has increased from the prior week by an average of 351 million shares. In weeks that the S&P 500 has advanced, NYSE trading volume has contracted by an average of 565 million shares. On broad indices, the general pattern resembles a narrowing wedge with a relatively flat overhead resistance area and increasingly shallow dips. What we observe here is a market that continues to struggle internally and shows persistent signs of distribution, but is still keeping its best foot forward, for now.
While we don’t follow Dow Theory directly, we do find that its central principle of divergence and uniformity has enormous importance historically. In our view, the divergence and uniformity of observable market internals and credit spreads provides essential information about the risk-preferences of investors. Risk-seeking investor preferences allow markets to be tolerant of rich valuations and even bubbles, while a subtle shift to risk-averse investor preferences often signals an impending and catastrophic end to those valuation extremes. Indeed, if you ask what was the single most important factor in our own difficult narrative in recent years, it was that the methods that resulted from our 2009 stress-testing against Depression-era data, while including these measures, didn’t capture them strongly enough to tolerate QE-induced speculation. We ultimately had to impose those bubble-tolerant features as an overlay (see A Better Lesson than “This Time is Different”).
Currently, we observe just the sort of internal divergences that our present methods demand as prerequisite to a hard-negative outlook. One example, from a Dow Theory perspective, is to note the classic divergence or “non-confirmation” here – a high in the Industrials with the Transports lagging, coupled with rich valuations and lopsided bullish sentiment. Beyond the signal for the financial markets, my impression is that this divergence suggests a continuing inventory buildup in the real economy (output being produced but not moving to distribution). Though the near term outcomes can be variable, we know quite a bit about how these instances have been resolved historically. The chart below offers a reminder.
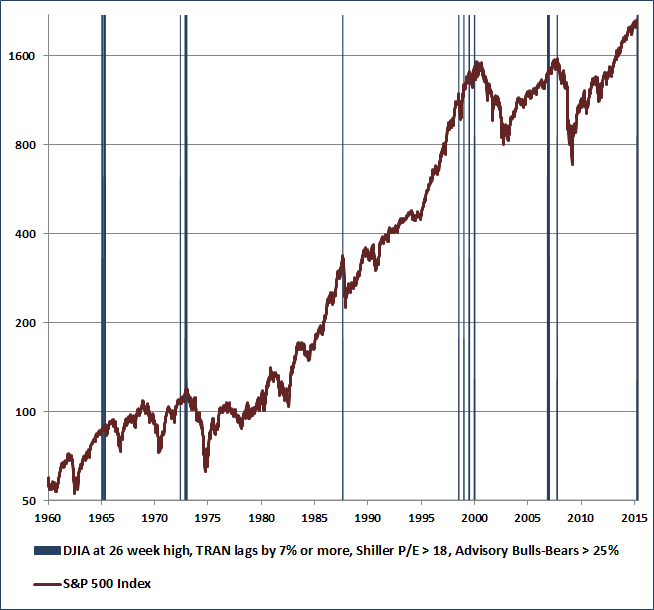
My present impression remains as I observed last week:
“If we look historically at periods when conditions fell into the most negative return/risk profile we identify (as they are at present), we find that top formations often involve extended runs of severely negative conditions. Though market momentum is typically slowing or flat, the occasional marginal new high can give the appearance of unrelenting strength even at the top (examine the S&P 500 in September 2000 and October 2007, for example). The most severe return/risk profiles we identify have sometimes persisted for several months without a material market correction… The perception of a Goldilocks economy may drag that out for a bit longer here, so again, we can’t be impatient, and we’ll take our evidence as it arrives. If market internals and credit spreads improve, the immediacy of our downside concerns will ease. Regardless, we believe that the S&P 500 is likely to experience flat returns or losses over the coming decade, and we remain concerned about growing financial distortions driven by yield-seeking malinvestment, as we were in the runup to the global financial crisis.”

