

Guest Post by John Hussman
Valuations are informative about long-term returns and full-cycle risks. Market internals are informative about investor psychology over shorter segments of the cycle. Presently, neither valuations nor internals are favorable, and that is what opens up a trap door under the market. There will certainly be periods where short-term oversold conditions will enable scorching market rebounds (what we typically describe as “fast, furious, and prone to failure”), but the strongest market return/risk profiles we identify will be associated with points where a material retreat in valuations is joined by an early improvement in our measures of market action. – John P. Hussman, Ph.D., The Heart of the Matter, Nov 2018
Given the steep market decline in recent days, short-term market conditions clearly qualify as “oversold” and highly compressed, in my view. Beyond the short-term, the main considerations here are that 1) market internals continue to be ragged and divergent; 2) the most reliable valuation measures (those most strongly correlated with actual subsequent 10-12 year market returns) remain extremely elevated from the perspective of history and even of recent market cycles, and; 3) credit spreads continue to widen, with European banks still being a central concern.
All of this indicates that investors remain inclined toward risk-aversion in a steeply overvalued market. That in a nutshell, is the “reason” behind this decline, and those conditions – particularly the ragged internals – have been in place for months. Most of the “explanations” you hear for this decline are simply events that prompt investors to simultaneously take actions that were ultimately baked-in-the-cake anyway.
While we don’t presently observe conditions to indicate a “buying opportunity” or a “bottom” from a full-cycle standpoint, we do observe conditions that are permissive of a scorching market rebound, even if it only turns out to be the “fast, furious, prone to failure” variety. I say “permissive” because there is no certainty about a rebound, and we wouldn’t dream of removing our safety nets against a market decline that I continue to expect to draw the S&P 500 toward the 1000 level by the completion of this cycle. Still, we’ve prepared for the possibility of unusual volatility here, most likely including one or more daily moves in the range of 4-6%, potentially to the upside. Yes, that means one or more daily moves on the order of 100-150 points on the S&P 500 and 900-1300 points on the Dow. You think I’m kidding.
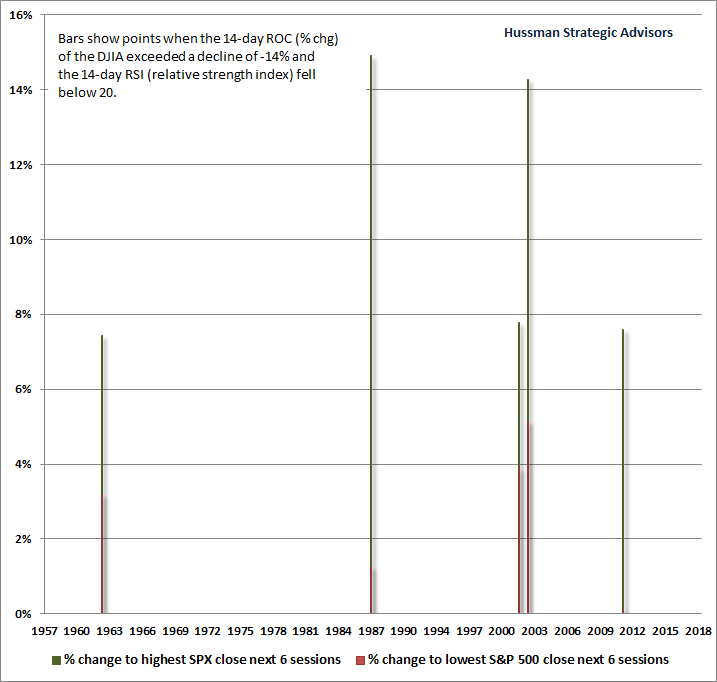
The following two charts provide some context to the “compression” we observe here. The first shows points where the S&P 500 Index had a 14-day percentage change (ROC for “rate of change”) amounting to -14% or more, along with a “relative strength index” or RSI below 20. The RSI is a standard technical measure originated by Welles Wilder, and measures the tendency for market advances or declines to dominate short-term market action. The bars show the subsequent percentage change of the S&P 500 to the highest close and the lowest close over the following 6-day period. All of these bars are positive, however, it bears repeating that there is no assurance that current oversold conditions will be resolved the same way.
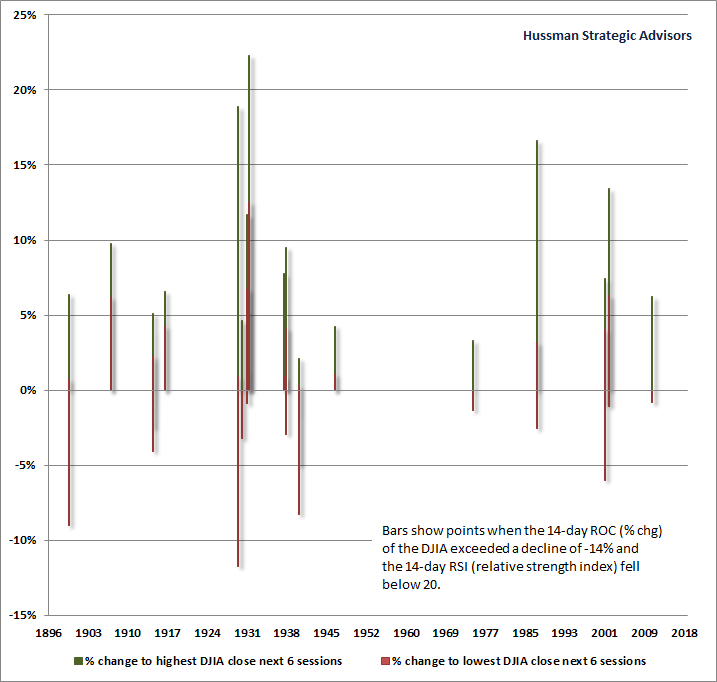
The next chart shows outcomes for the Dow Jones Industrial Average in data since 1900. Presently, the RSI for the INDU is about 21, so the current instance is just short of those shown here, but the level of compression is close enough to make this chart instructive. You’ll notice that the outcomes in the Depression-era involved a few points of even deeper compression (that is, the market experienced further short-term losses), but in a few cases, the “fast, furious” rebounds within the next 6 trading sessions were also extraordinarily steep.
While we don’t presently observe conditions to look for a ‘buying opportunity’ or a ‘bottom’ from a full-cycle standpoint, we do observe conditions that are permissive of a scorching market rebound, even if it only turns out to be the ‘fast, furious, prone to failure’ variety.
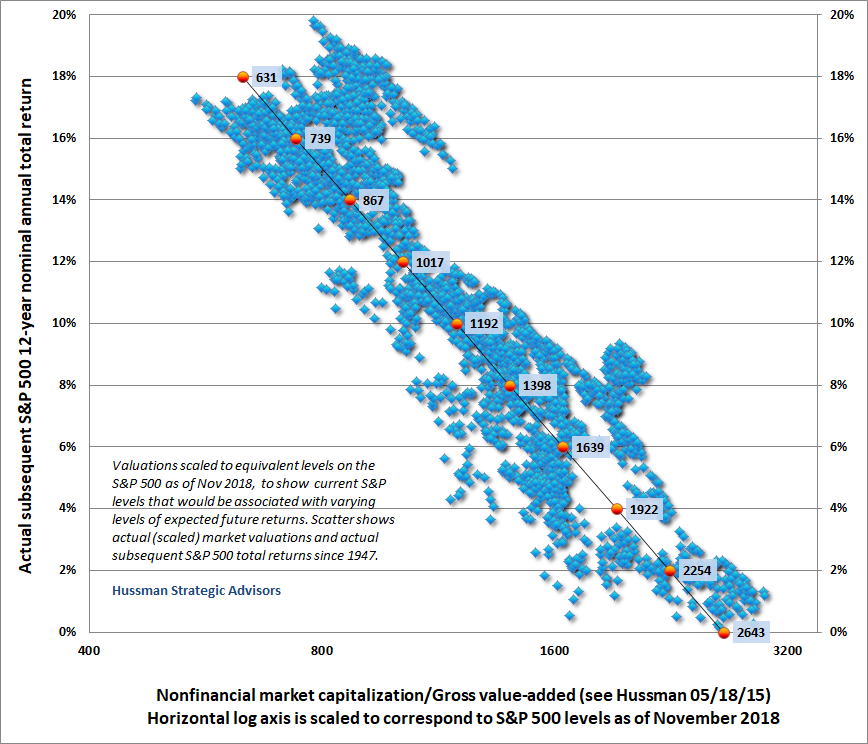
Finally, to place the current short-term conditions into a cyclical perspective, below is a chart that appeared in my December comment, which shows a scatter of market valuations, as measured by nonfinancial market capitalization / corporate gross value-added (including estimated foreign revenues) versus actual subsequent 12-year total returns for the S&P 500. Valuations are scaled to correspond to current levels on the S&P 500, so looking at the lower-right corner of the chart, you can infer that once the S&P 500 Index broke below about 2643, our estimates for 12-year S&P 500 total returns finally moved back above zero.
Unfortunately, every market cycle in history – including the two most recent cycles that ended in 2002 and 2009 – has drawn these total return estimates back up to the 8-10% area or higher by the completion of the cycle. Given the obscene valuations that the market reached at its highs, we would view a market decline to 1192 on the S&P 500 (about 60% below the recent September peak) to be a fairly run-of-the-mill cycle completion, while a decline to 1398 would take valuations back to the level seen in 2002 (which was the highest level of valuation previously observed at any cyclical market low).
In short, being fully aware of where the market is in the context of the complete cycle, safety nets remain essential here, but we also expect the next few sessions to include a potentially steep “clearing rally” to relieve the compressed condition of the market. As always, our approach is to align ourselves with the market conditions we observe at each point in time. For now, we remain cyclically defensive, prepared for extreme short-term volatility in both directions, and open to that direction being higher, perhaps into year-end. We’ll take fresh evidence as it comes.


Steve Suggarud(spelling?) over at Stansberry Digest is still telling his patrons to hold on for continuation of the “Melt up”. That is the final blow off top before the huge crash. For years he’s been right.
Bottom line-expect some huge rally’s up before the big drop down. Good Luck
Let me summarize, The market could go UP before it goes Down…Thanks, that clears it all up.
The key point was the “melt up”. This is much different than typical gyrations.
For the weekly pattern on the Dow Jones to complete, it has to get back down to 20000-20500 level. That said, the weekly and daily were at extreme oversold, so a short term bounce isn’t a surprise.
You can read comments on Breitbart about how today’s rally is proof about how Trump has taken back control of his “amazing” economy. I read the comments and couldn’t help thinking, no wonder the middle class is nearly destroyed. They’re all fucking morons.
Nice dead cat bounce unless the Fed lowers rates and they do it to houses, cars and durable goods.
This man is brilliant and 10 x smarter than I will ever be….HOWTHEFUCEVER, he has been wrong on the markets and made his followers almost FZERO for the last 10 years..Brains are over-rated in understanding the human beast…Sentiment and herd behavior are the 2 best predictors if u have the cajones to follow the crazy…Just saying…
What do “investors/traders/financial ‘wizards'” contribute to REAL PRODUCTIVITY/PROSPERITY? Answer: NUTH’IN . . . more than extensions of/to/for the ROTschild’s PRIVATELY-owned [NOT]Federal[NO]Reserve PARASITES. And, by the way, been noting increasing “commentary” about said “ROTschilds” quietly divesting “itself” of that “paper stuff” and “marginally-essential/discretionary assets”. What do “investors/traders/financial ‘wizards'” contribute to REAL PRODUCTIVITY/PROSPERITY? Answer: NUTH’IN . . . more than extensions of/to/for the ROTschild’s PRIVATELY-owned [NOT]Federal[NO]Reserve PARASITES. Also been noting increasing “commentary” about said “ROTschilds” quietly divesting “itself” of that “paper stuff” and “marginally-essential/discretionary assets”. And would know more about future “trends” than the “MAKER” of said?
yo “pensioners” – current AND future, brace for the [butch] haircuts, be they direct reductions OR super-duper deflation of “discretionaries” followed up by inflation of even “essentials”.
Hmmmm….,every time I see the Fast and Furious title in a article thinking of something else,there is still time for indictments9if any one in the just us dept. gave a shit).
What do “investors/traders/financial ‘wizards'” contribute to REAL PRODUCTIVITY/PROSPERITY? Answer: NUTH’IN . . . more than extensions of/to/for the ROTschild’s PRIVATELY-owned [NOT]Federal[NO]Reserve PARASITES. And, by the way, been noting increasing “commentary” about said “ROTschilds” quietly divesting “itself” of that “paper stuff” and “marginally-essential/discretionary assets”. Who would know more about future “trends” than the “MAKER” of said [current] “trends” via the “Fed”, ESF, PPPT and other such “quasi-gov” covert financial intervention “options”?