


Urban Violent Crime Statistics Fast Facts
- National Average Violent crime rate – 366.7 violent crimes per 100K people in the US nationwide in 2019. (Source)
- Washington, D.C., had the highest violent crime rate in 2022, with 999.8 crimes per 100,000 people. (Source)
- 89% of firearms used in crimes were obtained illegally, per a 2016 BJS report.
- Of the 26,000 US homicides in the US in 2021, 60% (15,702) occurred in Metro and Fringe Metro areas.
- Violent crime nationwide decreased by 1% from 1,326,600 in 2020 to 1,313,200 in 2021, with robbery decreasing by 8.6%, lowering the national average.
- Violent crime rates in urban areas were 24.5 per 1,000 citizens in 2021. (Source)
- There were 461,540 arrests for violent crimes in 2020 nationwide. (Source)
- Suburban areas with a population of less than 50,000 had the most violent crimes in 2017.
- Between 1994 and 2002, an increase in street gangs correlated with an increase in violent crime (61.1 homicides per 1.5 square miles).
- Urban areas with a population size of 500,000-999,999 have the highest crude rate of violent crime. (Source)
Many factors play into violent crime victimizations in the U.S. Population size is only one factor. Poverty, criminality, education, and public policies all affect crime rates, particularly violent crime.
Violent crime costs American taxpayers more than $800 billion U.S.D. Annually according to this report. However, this isn’t the most sinister aspect of violence-related victimization in the United States. Recent reports indicate that there are 366.7 victims of violent crimes for every 100,000 people in the U.S. The highest violent crime rate in the U.S. occurs in communities with more than 500,000 and less than 1,000,000 residents.
The second highest violent crime rate occurs in communities with a population size between 250,000-499,999 thousand (21.7 per 100,000). The third highest violent crime rate occurs in communities with more than 1,000,000 people (20.0 per 100,000).
There is little correlation between a state’s firearm laws and violent crime rates. While New Hampshire has relaxed firearms laws, the state’s violent crime rate in 2022 was only 146.38. Washington, D.C., has extensive firearm regulations but a much higher violent crime rate per capita.
Key Methodology & Findings
Crime data is gathered from a variety of federal agencies to compile a broad perspective of actual and empirical data. Homicide reports come from the CDC, violent crime rates come from the FBI and the DOJ, the United States Census Bureau provides population data, and the National Institute for Health provides studies and information regarding economic and geographical crime-related data. Data provided by the FBI and DOJ largely relies on self-reporting from police agencies.
However, crime data takes years to collect; therefore, much of the data available today reflects crimes committed and victimizations from years prior. Moreover, some studies, particularly regarding gang violence in urban and rural settings, are over a decade old. Readers can also note that violent crime victimization rates are measured in 1/1,000 and 1/100,000. So, it’s essential to account for the raw data while also accounting for the percentage of a community’s population concerning crime.
Violent crimes, per the most common definition, include homicide, non-negligent murder, forcible rape (the definition recently changed to remove “forcible”), robbery, and aggravated assault. The United States Census Bureau also redefined urban. Urban populations now comprise 2,500 people with a jump distance (miles traveled between populous) to 1.5 miles.
NY and NJ have the highest concentration of population, with 19,426,449 people. L.A. has the second highest concentration of people, with 12,237,376 people. Texas, North Carolina, Pennsylvania, and Ohio comparatively have the largest rural population. Anchorage, AK, had the highest number of reported rapes in 2021 (186.7 per 100,000), with 64% of the population being gun owners.
Homicide in Urban Areas
The United States saw 26,031 homicides nationwide in 2021. Of those homicides, 42% occurred in only 50 counties (25% of the nation’s entire population). 28 of the 50 counties had more than 1,000,000 residents, and all 50 counties had more than 100,000 residents.
The highest number of total homicides by county is as follows:
- Cook County, IL – 1,061 homicides of 5,173,146 residents
- LA County, CA – 812 homicides of 9,829,544 residents
- Harris County, TX – 606 homicides of 4,728,030 residents
- Philadelphia County, PA – 551 homicides of 1,576,251 residents
- Wayne County, MI – 367 homicides of 1,774,816 residents
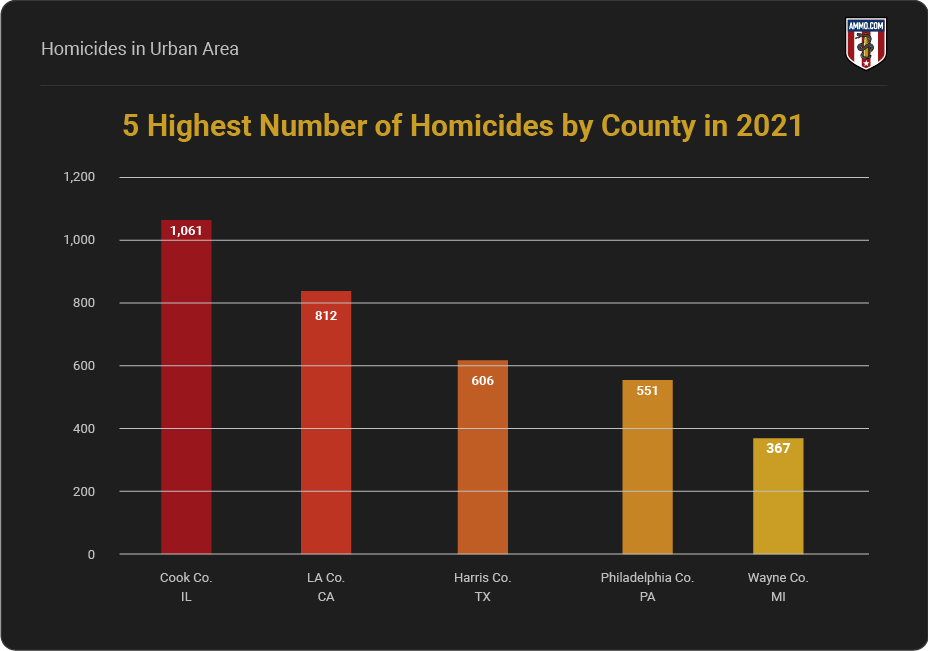
Note: 92% of homicides in Cook County, IL, and 89% of homicides in Philadelphia, PA, were firearm-related despite excessive state gun laws. LA County had the lowest percentage, with 78% of homicides being firearm-related. (Source)
Notably, 11,208 homicides nationwide occurred in Metropolitan areas (total population 101,133,819), and 4,494 homicides occurred in Fringe Metropolitan areas (total population 84,491,905). (Source)
Violent Crimes in Urban Areas
According to a 2017 report from the FBI, Suburban areas accounted for 281,639 violent crimes (excluding homicides), whereas metropolitan counties accounted for 186,137 violent crime reports (excluding homicides). Per this report, suburban areas are locations with fewer than 50,000 citizens.
However, the top five cities with the highest rates of violent crime, including homicides, are as follows (2023):
- St. Louis, MO – 2,082 per 100,000 citizens (279,390 overall population)
- Detroit, MI – 2,057 per 100,000 citizens (621,193 overall population)
- Baltimore, MD – 2,027 per 100,000 citizens (563,455 overall population)
- Memphis, TN – 2,003 per 100,000 citizens (621,777 overall population)
- Little Rock, AR – 1,634 per 100,000 citizens (201,029 overall population)
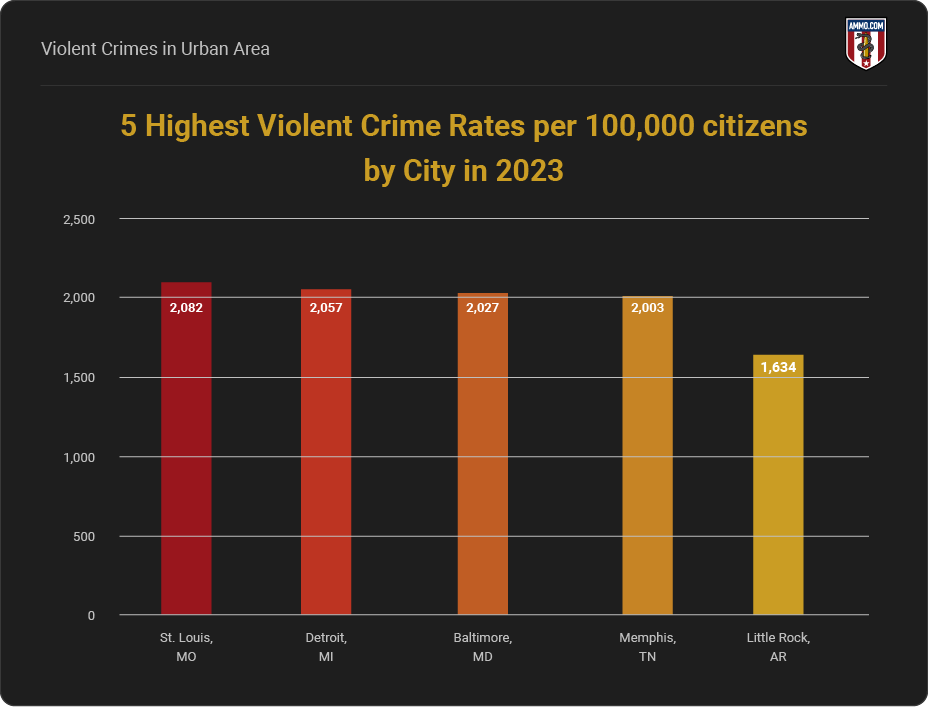
These five cities exceed the national average of 366.7 per 100,000 individuals by 171%. (Source)
Another interesting facet of violent crime is that the top 5 most violent crime cities in 2023 have an average population density of 1,513.2 people per square mile, while the following 15 cities with high violent crime rates have a population density of 1,511 people per square mile.
For perspective, the average population density of the U.S. is 34 people per square mile. Moreover, we measure crimes as incidents per 100,000 people to account for varying population sizes (Chattanooga, TN, has fewer violent crimes than Chicago, IL, but a higher crime rate due to the population size, for example).
We can compare older reports to newer violent crime statistics and conclude that while violent crime has declined, it is still a problem secluded to areas with higher populations. (Source)
Urban Crime and Firearm Statistics
Another important aspect regarding urban violent crime statistics is the impact of state laws and programs.
While firearms were used in more homicides in 2019, other violent crimes such as robbery and aggravated assault used no weapons or other weapons such as knives (313,939 firearm-related compared to 719,953 alternatives). 309,322 strongarm offenses compared to 309,322 strongarm offenses (where no weapon was used at all) compared to 269,159 firearm-related assaults and robberies. (Source)
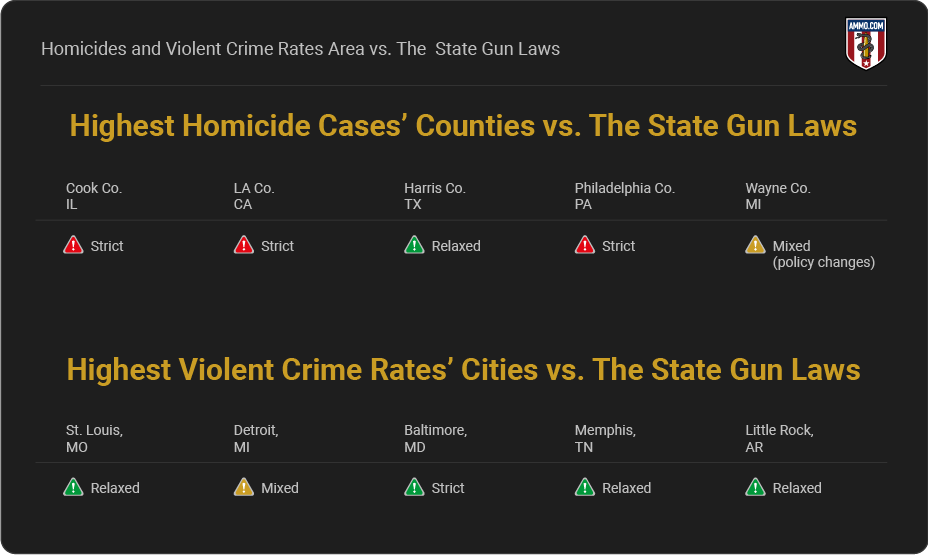
Counties with the highest rates of violent crime versus states and gun control legislation:
- Cook County, IL – Strict
- LA County, CA – Strict
- Harris County, TX – Relaxed
- Philadelphia County, PA – Strict
- Wayne County, MI – Mixed (policy changes)
Gangs & Violent Crimes
Communities with 50,000+ people have a higher risk for gang-related violent crimes. (Source)
In 1990, more than 450 street gangs with more than 36,000 members (LA). Violent crime rose, and the LAPD estimated half of the violent crimes were gang-related. (Source)
The last available Gang report from the FBI occurred in 2015. Page 14, High gang-related violent criminal activity. (Source)
Per the FBI, in 2008, gangs did increase the number of violent crimes. (Source)
The number of street gangs in the NIH report from 1994-2002 increased from 3.4 homicides per square mile to 61.1 homicides per square mile with the increase of known street gangs. (Source) However, poverty and dropout rates also showed a strong correlation between gangs and violent crime.
Sources
- Neighborhood Racial and Economic Segregation and Disparities in Violence During the COVID-19 Pandemic
- Criminal Neglect
Urban Violent Crime & Legal Gun Ownership: A Story of Geographical Assault in the U.S. originally appeared in The Resistance Library at Ammo.com.


So density of blacks is not a factor?
Of the five cities, only #5 Little Rock doesn’t have a majority Black population. Little Rock however does have a majority minority population, between African-American and Nuevo Americano Democrats.
So, no nothing to do with the Black community….apparently
If i remember the FBI stats pre covid with the census numbers 13% of population is Black; Blacks killing Blacks murder rate is 5X the rate of Whites killing Whites.
Also, mass casualty (3+killed) events have increased according to the FBI, overwhelmingly in urban settings.
Most likely gangs of Amish and Mennonite “Youths”
Remove a certain population and the crime rate goes down 98% and that includes “gun related crimes”.
All these words and the most important part is left out.
Call a spade a spade.
I’m changing my name to Wyatt Earp or Wild Bill to prepare for, get this, the Illinois Safety Act. No cash bail, cannot arrest juveniles, can’t force people off your property or supposedly out of your house or business. The hog JB the Hutt Pritzker has also signed shitloads of gun restrictions while no gun crime is prosecuted in Shitcago. In the 1840’s and 50’s this place was the Wild West and it looks like it is returning. Stay tuned and wait for the reports of anti criminal death squads.
They were called “committees of vigilance” — and they always were associated with a severe break down of society.
Do you have a good backhoe or a bunch of hungry pigs?
Both. Remember S S S. Shoot Shovel Shut-up.
Just to summarize: Violent crime is most prevalent in Democrat run cities…saved 1000 words.
NAILED IT !!! Wherever they gain influence, social and economic deterioration grows. Violence is one of the earmark bi-products of leftist policies, attacking Christianity is another.
Majority minority democrat run cities. FIFY
All of this is just yet one more sign on the road to an anarcho-terrorism: decent people are terrorized and the criminals are protected.
And the missing contributing factor is…blacks!