

Direct from BOOM Finance and Economics at the links below

Hat Tip to my colleague at: BOOM Fin4ance and Economics Substack (Subscribe for Free) – also on LinkedIn and WordPress. Covid Medical News Network CMN News BOOM Blog and All Editorials (over 5 years) at: BOOM Finance and Economics | Designed for Critical Thinkers — UPDATED WEEKLY (WordPress.com)
BOOM Finance and Economics seeks out the very best information from authoritative sources and strives for consistency in its quality and trustworthiness. Over 5 years, BOOM has developed a loyal readership which includes many of the world’s most senior economists, central bankers, their senior advisers, fund managers and academics. If you want a real edge in understanding the complex world of finance and economics, subscribe to BOOM on Substack or as a Follower on LinkedIn.
BOOM EDITORIAL THIS WEEK

INDIA AND RUSSIA SIGN ENERGY DEAL – RUSSIA NAMED AS A “SPECIAL PARTNER” IN DEFENCE, POWER AND SPACE. In last week’s editorial, BOOM stated, “If India were to increase trade with China and Russia and settle those trades using Chinese yuan, Russian rubles and Indian rupess, then over 3 Billion people could benefit from the trend to multi-polarity. China, India, Russia, Brazil and South Africa (the original BRICS) make up 40% of the global population.”
Right on cue (admittedly by coincidence), in Moscow last Tuesday, the Indian External Affairs Minister S. Jaishankar announced a new agreement between India and Russia for the construction of additional units at the Kudankulam Nuclear Power Plant (KNPP) in Tamil Nadu.
The existing joint project with Russia includes operational units 1 and 2 with a capacity of 1000 MW each, while four remaining units of the same capacity are currently under construction. They are set to be completed by 2027, resulting in a total capacity of 6000 MW.
“Today, we signed some important agreements pertaining to future units of the Kudankulam Nuclear Project,” the minister said. In his speech, he called Russia a “special partner” in several domains, such as defence, nuclear power, and space. “Collaborations are done… with countries with which you have a high degree of trust” he added.
Trade between India and Russia is not great in volume at present. However, those statements from the Indian Minister for External Affairs demonstrate the intentions of the Indian government. With 1.4 billion people, India has a need for reliable power. They are clearly happy with the Russian nuclear power stations already established and have decided to expand the facility significantly.
Some analysts have put the question: “What can Russia do with Indian rupees if they are used to effect settlement?”. The answer is quite simple. Russia can buy goods, assets and commodities from India or China with rupees. China will be happy to accept them. China can then purchase goods or services from India with the rupees. Trade complexity cannot grow from just two nations in cooperation. However, three large nations in close cooperation such as Russia, China and India with over 3 billion people can expand their settlement capacity in innovative ways.
YUAN OVERTAKES YEN IN GLOBAL SWIFT SETTLEMENTS. The ‘Society for Worldwide Interbank Financial Telecommunications’ (SWIFT), based in Belgium, is dominated by the United States and, of course, the US Dollar.
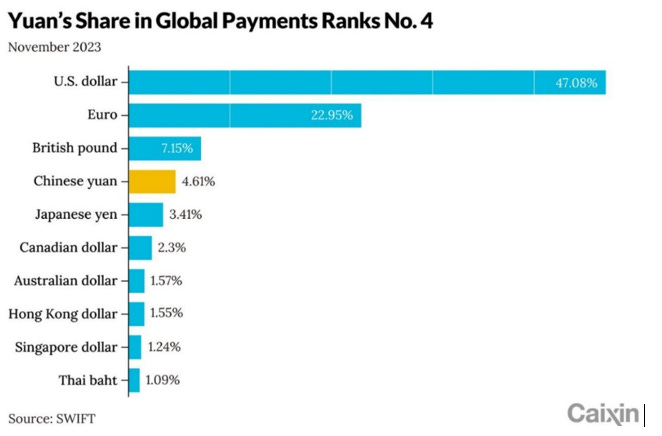
However, over the last 12 months, China’s yuan has advanced over the yen to become the fourth most used currency by value in global payments that are effected using SWIFT. The Chinese currency is now being used in 4.6% of global settlements on SWIFT. Twelve months ago, the yuan was used in only 1.9 % of SWIFT mediated global trade settlements. So it has more than doubled in usage. The US Dollar is being used to settle 47.08% of transactions on SWIFT.
The US Dollar and the Euro dominate it with over 70%. It is important to understand that China’s trade is also being settled using the Russian and Chinese alternatives to SWIFT. The Russian system is called SPFS: “System for Transfer of Financial Messages” and has been in operation since 2017.
China’s SWIFT alternative, launched in 2015, is called the ‘Cross-Border Interbank Payment System’ (CIPS). It offers clearing and settlement services for its clients in cross-border yuan payments.
CIPS participants are located in 111 countries and regions around the world. The actual business covers more than 4,400 banking institutions in 182 countries and regions around the world. Currency multi-polarity of trade and capital settlements is well advanced by this system.
China can and does use both systems: SWIFT and CIPS. And it is now working closely with Russia’s SPFS system. NB: The following chart is for SWIFT settlements only.
THERE’S LITTLE CHANGE IN FOREIGN EXCHANGE RESERVES IN CENTRAL BANKS – Here’s a recent headline from Bloomberg: “The dollar’s share in global central-bank reserves dropped in the three months to the end of September, while holdings of the Japanese yen rose, International Monetary Fund data showed Friday.”
“The greenback accounted for 59.2% of globally allocated foreign-exchange reserves in the third quarter, down from a revised 59.4% in the previous three months, according to IMF’s Currency Composition of Official Foreign Exchange Reserves (COFER) data. That’s the lowest since the fourth quarter of last year.”
Most importantly, however, the article goes on to explain that the shares of the Chinese yuan, the British pound, the Australian and Canadian dollars and the Swiss franc were little changed.
Anyone looking for a surge in the holdings of Chinese yuan or Russian rubles by global central banks would have been disappointed. The proposed BRICS transition to a world of true multi-polarity in currency settlements is a long way off as BOOM has often said. Such a transition will take many decades as the volumes of yuan and rubles offshore are simply too small to make any significant difference in the short term.
Currency availability and convenience is critical in settlements of trade and capital movements. Both nations are also very aware of the risk of capital flight if they were to open their currency borders too quickly. Here is the COFER Data released by the IMF on 22nd December 2023
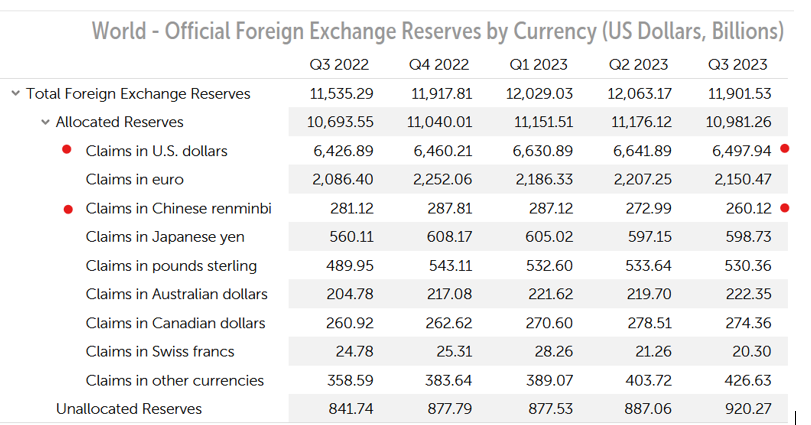
Data Source. The US dollar has been gradually losing its dominance since the start of this century, when its share in foreign currency holdings was above 70%. The key word in that sentence is “gradually”. The euro has slowly but surely been the currency growing in acceptance since it was launched in January 1999. It is now 19.57% of the total. Some sceptics say that the euro is actually a US dollar Proxy which, if true, means that there has been little change in reality to the central theme of US dollar dominance. If you add US dollar volume of 59.2% to euro volume of 19.57%, the answer is 78.77% (!).
The US dollar’s supremacy has assisted the United States to fund its budget deficits by selling Federal Government Treasury securities; (aka T Bills and Bonds) to foreign purchasers. Nations such as China and Japan have accumulated huge US dollar amounts in trade settlements and some of these dollars inevitably find their way back to America as investments to help fund the US domestic deficit.
US Dollar dominance also helps multinational companies to borrow offshore at lower interest rates via US dollar denominated tax-haven bank loans. This is an extremely hard “virtuous circle” to break. It will take much longer than most people realise. Dreams of “US dollar collapse” are just that – dreams — or perhaps they are covert US counter intelligence narratives?
The US dollar Empire is not about to lose its global dominance in a hurry. Aside from investments in US Treasuries, foreign nations also invest their excess US dollars into America’s deep stock markets, corporate bond markets, municipal bond markets and junk bond markets.
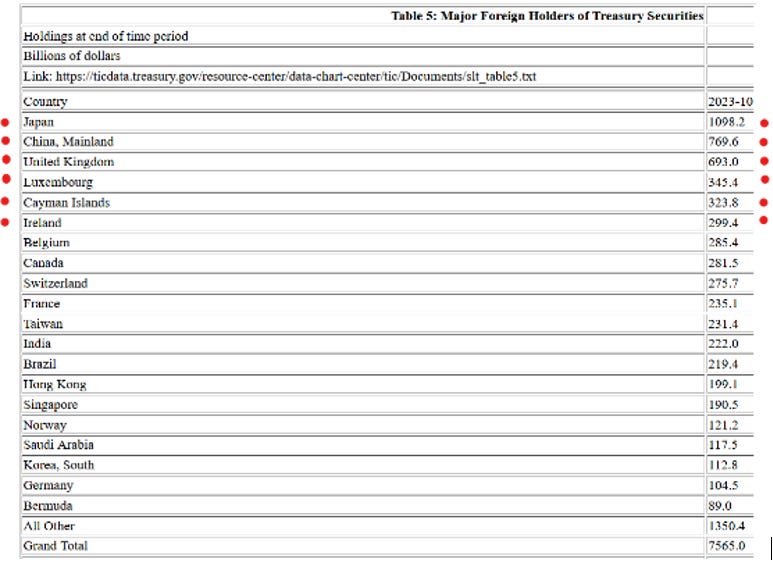
FOREIGN OWNERSHIP OF US TREASURY BILLS AND BONDS IS HELPING TO FUND THE US DOMESTIC DEFICIT – Here is the latest “tic data” showing Foreign holdings of US Government Bills and Bonds. Note the Top Six Nations, Japan, China, UK, Luxembourg, Cayman Islands, Ireland, Japan, and China are investing the proceeds of trade that have been settled with US dollars.
The UK/City of London, Luxembourg and the Cayman Islands (where most of the tax-haven banking system is located) are investing some of their Eurodollar volumes from profits, capital settlements, and new bank loans denominated in US dollars.
Ireland is where many transnational companies are registered for tax evasion purposes. Those companies are re-investing their excess US dollar profits from their global operations (most of which have been settled using US dollars). The 7th nation on the list is Belgium, where SWIFT operates, and the US dollar, of course, dominates.
ASSET CONFISCATIONS MUST STOP – IT DESTROYS TRUST – THEY DESTROY FREE DEMOCRACIES – THEY DESTROY CAPITALISM. The US has reportedly confiscated US$58bn of Russian citizen’s assets over the last year in retaliation for the Ukraine conflict. The so-called ‘Russian Elites, Proxies and Oligarchs Task Force’ is coordinating this. The task force is a joint effort between the US, Australia, Canada, Germany, Italy, France, Japan, the UK and the European Commission.
This is unwise in the extreme in BOOM’s opinion. Private property and the ownership of such is a central pillar of free, democratic nations that adhere to capitalism. If nations confiscate (or destroy) the assets of citizens of any foreign nation, then they are stabbing democracy and capitalism in the back. Nothing good can come of this.
And destruction of offshore assets can be perceived as tantamount to a declaration of war. The destruction of the Nordstream pipeline is arguably the dumbest foreign policy action ever taken and will mark a major turning point in world history, in BOOM’s opinion.
The “Deputies of the multilateral Russian Elites, Proxies, and Oligarchs (REPO) Task Force” made this statement in March 2023, “As Russia’s war of aggression continues, REPO members remain determined in their commitment to impose steep costs on Russia. REPO will continue to identify, locate, and freeze the assets of sanctioned Russians, with the [They’re] aim of depriving the Kremlin of the funds it needs to fight its illegal war.”
So stealing assets is OK? BOOM is not sure what a legal war is. Perhaps readers may know? If those Western nations choose to confiscate more Russian assets, this trend will worsen and inter-national trust will be further damaged, possibly beyond repair.
This is the case especially if the assets are sold and the proceeds transferred to Ukraine as is being proposed. The United States in particular and Western Europe will be adversely affected if this happens. Many nations will become naturally wary of holding assets in Western nations dominated by United States aggressive policies.
ECONOMIC RATIOS CAN BE VERY MISLEADING – BOOM is not a fan of famous ratios commonly used by many economists. Such ratios include the one used for “Velocity of Money” and also the one used for “Debt-to-GDP” assessments.
In the formula for Sovereign Debt to GDP ratios, Gross Domestic Product (GDP) figure is an annual one while the “Debt” figure is comprised of the total of Sovereign Treasuries issued over 0-30 years. Comparing a total of 30 year’s debt to just one year of GDP is intellectually dishonest. For the sake of example, (and not accuracy), assuming that 20 years is the average maturity, it would make a lot more sense to compare 20 years of debt to 20 years of total GDP (not just one).
Current US Treasuries Outstanding are US$26.3tn (the terms vary from one month to 30 years). Current annual US GDP is estimated at $25.5tn. So the traditional estimation of sovereign “Debt to GDP” ratio is 26.3/25.5 = 103%. But if we use an estimate of the next 20 years of GDP, the ratio becomes 26.3/510 = 5% – this is much better than 103%!
BTW you may have heard that the US Federal Government Debt total is $33tn, not $26.3tn. The $33tn figure includes $7tn of Inter-Governmental Debt (debt owed by the government to the government). The $26.3tn figure is Net Debt issuance.
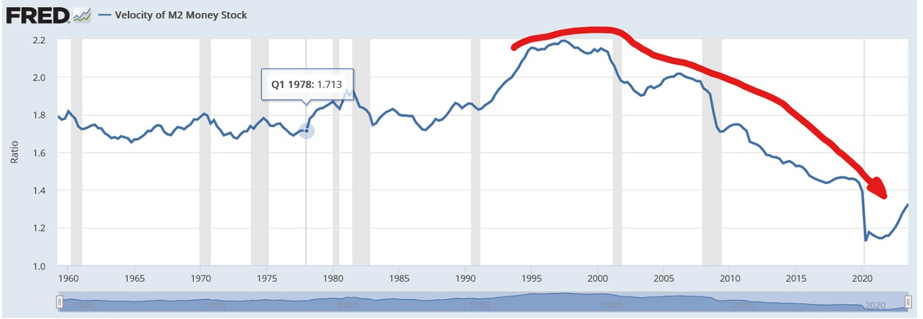
In the formula for Velocity of Money, there is a big problem with how to define the two components: GDP and Money Supply. Much fresh new money upon creation is not used to finance the purchase of goods and services (GDP). So the formula falls at the first hurdle and any conclusions based upon it are effectively meaningless.
BOOM is not a fan of this concept, known as the velocity of money, as it is currently defined by the economic “profession”. Many analysts look at the chart for velocity of money (VoM) in the US and scream, “The velocity of money continues to fall. The economy is DOOMED (!).”
However, it is not easy to interpret VoM accurately in the economy and can be quite misleading if the complexity of the economy and the formula itself are ignored. In other words, don’t jump to conclusions that may be based upon false assumptions.
The housing component of GDP has two parts. The first is residential fixed investment (RFI), this includes dollars expended for residential construction (single and multifamily), home remodelling, production of manufactured housing and broker fees. Remember, sales of pre-existing homes are not included in the GDP formula.
The second component is housing services. This includes gross rents including utility payments from renters and imputed rents from homeowners. The latter is an estimate for what it would cost if homeowners rent their homes. While imputed rents may not seem logical, without this calculation any increase in homeownership would drive the GDP lower and that would distort the VoM considerably over time.
So looking at the formula as it is – Velocity of Money = GDP/Money Supply (GDP divided by Money Supply). In the denominator, economists typically define money supply as either M1 or M2. And they define the numerator GDP thus; ‘Total GDP = Sum of all Transactions for Goods and Services (excluding pre-existent asset transactions).” GDP represents the total amount of goods and services in the economy that are available for purchase.
GDP = Consumption + Private Investment + Government spending + Exports minus Imports. GDP excludes non-production transactions: public transfer payments, such as Social Security, private transfer payments, such as gifts, and financial market transactions, since securities represent either ownership, such as with stocks, or they represent loans, such as bonds.
Financial assets (securities) do not represent real production, but simply represent the means to finance production. Likewise, second-hand sales (including homes) are excluded because no production is involved except for the sales service.

Another way to think of this is to understand that “savings”, or perhaps more correctly “net wealth”, are not included in the formula.
VoM (as calculated using the current formula) is effectively the frequency of money circulation as consumers pay for the goods/services they buy. If people decide to retain more of their disposable money (deciding not to spend it on goods/services) then money circulation (velocity) decreases. And if people accumulate more “net savings/potential purchasing power” or “net wealth” in the value of their home, then VoM will decrease.
Thus, as a nation becomes “wealthier” or “more prosperous” in financial terms as measured by increased “savings/potential purchasing power” or “net wealth” from real estate, it will cause VoM (as calculated by the formula) to decrease.
Aging demographics will also negatively impact VoM because elderly people tend to spend less whilst their “net wealth” increases.
VoM is the frequency at which one unit of currency is used to purchase domestically produced goods and services within a given time period. It’s the number of times one dollar is spent to buy goods and services per unit of time. Sounds meaningful. But if the formula is distorted by what is used as the Numerator and the Denominator, it will just produce a distorted result and not give any meaningful representation of what is happening in the economy.
Two distortions or two disconnected concepts compared to each other result in just another amplified distortion, especially over time. If the formula were adjusted to include the trading of old real estate assets, or the savings of the nation as represented by the increase in home prices, the shape of the graph for “Velocity of Money” would look very different. It’s possible to compare the cost of sailboats in Alabama to the cost of goat’s milk in outer Mongolia and to produce a graph of this relationship over time. But such a ratio would be clearly ridiculous.
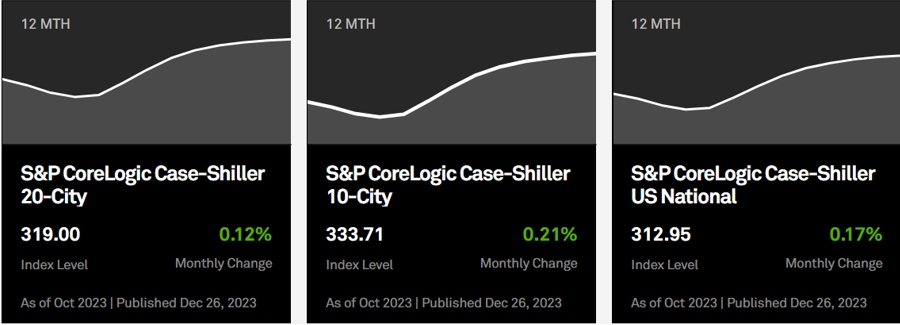
US HOME PRICES CONTINUE RISING – The BOOM forecast for higher US home prices remains intact. October showed higher prices in many cities. Overall, the S&P CoreLogic Case-Shiller U.S. National Home Price NSA Index, which covers all nine US census divisions, reported a 4.8% annual change in October, up from a 4% change in the previous month.
BOOM made the forecast on 16th April 2023. BOOM wrote, “This suggests that US house prices may soon begin to rise in price”. At the time, nobody was making such statements. Doom & Gloom analysts were forecasting Doom & Gloom resulting in lower home prices. Not BOOM.
The S&P CoreLogic Case-Shiller Indices series is regarded as the leading measure of US home prices. Data released December 26th for October 2023 show that 11 of the 20 major metro markets reported month-over-month price increases. The 10-City Composite showed an increase of 5.7%, up from a 4.8% increase in the previous month.
Believe it or not, Detroit reported the highest year-over-year gain among the 20 cities with an 8.1% increase in October. All of this data is available at the S & P Dow Jones Indices website. Look for CoreLogic Case-Shiller Home Price Indices. If you dig a little, you can find detailed information on each city.
A spokesman, Brian Luke, Head of Commodities, Real & Digital assets at S&P DJI, said, “US home prices accelerated at their fastest annual rate of the year in October”. And …. “Our National Composite rose by 0.2% in October, marking nine consecutive monthly gains and the strongest national growth rate since 2022.” … “Each of our 10-city, 20-city and National Index, remain at all-time highs”
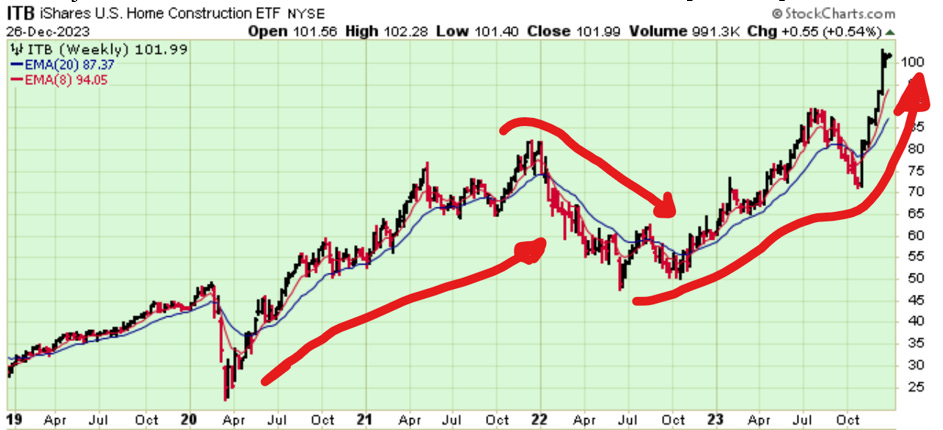
Some analysts are bemoaning the real estate market in the US. BOOM can only guess that they have not looked at the share prices of the major homebuilding companies. Let’s look at a major ETF that summarises that sector – its stock code is ITB.
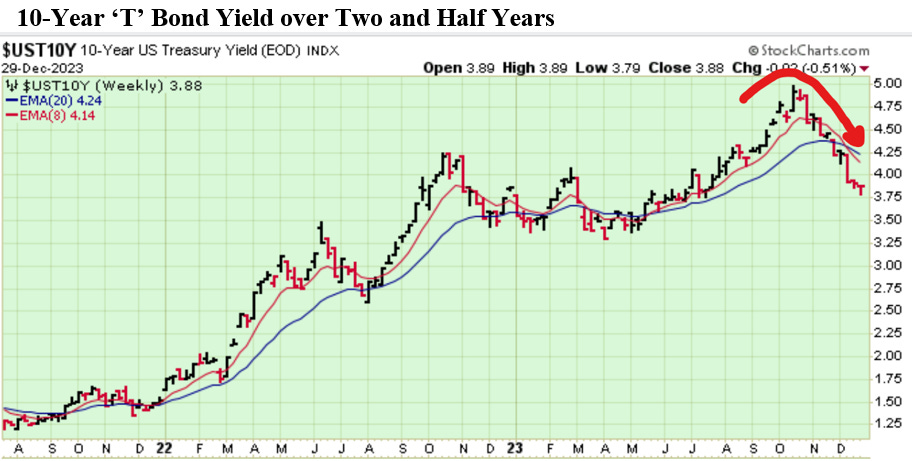
The Yield on US 10-Year T Bonds is starting to fall. Prospective buyers need to understand this. It suggests (strongly) that lower Mortgage interest rates are coming if the yields continue to fall.
BOOM’s QUANTITATIVE BOOSTING FOR THE PEOPLES’ MONEY EXPLAINED: https://boomfinanceandeconomics.wordpress.com/2019/12/15/boom-as-at-15th-december-2019/ AND BOOM’s Perfect Economy: https://boomfinanceandeconomics.wordpress.com/2020/01/18/boom-as-at-19th-january-2020/
In economics, things work until they don’t. Make your own conclusions, do your own research. BOOM does not offer investment advice.
CLICK HERE FOR PODCASTS: OUR BRAVE NEW ECONOMIC WORLD
BANKS DON’T TAKE DEPOSITS, THEY BORROW YOUR MONEY: LOANS CREATE DEPOSITS — that is how almost all new money is created in the economy (by commercial banks making loans). https://www.bankofengland.co.uk/quarterly-bulletin/2014/q1/money-creation-in-the-modern-economy. Watch this short 15-minute video and see how Professor Richard Werner brilliantly explains how global banking systems really work.
In 2014, Richard Werner provided the first empirical evidence that banks create credit out of thin air. They do this whenever they issue a loan or, more specifically, purchase a promissory note. This is a walk-through of exactly how they do it.
Most economists are unaware of this and even ignore the banking & finance sectors in their econometric models.
DISCLAIMER: All content is presented for educational and/or entertainment purposes only. Under no circumstances should it be mistaken for professional investment advice, nor is it at all intended to be taken as such. The commentary and other contents simply reflect the opinion of the authors alone on the current and future status of the markets and various economies. It is subject to error and change without notice. The presence of a link to a website does not indicate approval or endorsement of that web site or any services, products, or opinions that may be offered by them.
Neither the information nor any opinion expressed constitutes a solicitation to buy or sell any neither securities nor investments. Do NOT ever purchase any security or investment without doing your own and sufficient research. Neither BOOM Finance and Economics.com nor any of its principals or contributors are under any obligation to update or keep current the information contained herein. The principals and related parties may at times have positions in the securities or investments referred to and may make purchases or sales of these securities and investments while this site is live. The analysis contained is based on both technical and fundamental research.
Although the information contained is derived from sources which are believed to be reliable, they cannot be guaranteed.
Disclosure: We accept no advertising or compensation, and have no material connection to any products, brands, topics or companies mentioned anywhere on the site.
Fair Use Notice: This site contains copyrighted material the use of which has not always been specifically authorized by the copyright owner. We are making such material available in our efforts to advance understanding of issues of economic and social significance. We believe this constitutes a ‘fair use’ of any such copyrighted material as provided for in section 107 of the US Copyright Law. In accordance with Title 17 U.S.C. Section 107, the material on this site is distributed without profit. If you wish to use copyrighted material from this site for purposes of your own that go beyond ‘fair use’, you must obtain permission from the copyright owner.
COMING NEXT – Revised Schedule
- The Financial Jigsaw Part 2 – January 6, 2024 – Chapter 3 begins
- Letter from Great Britain – Saturday January 13, 2024 – ongoing biweekly Letter


Many thanks and blessings to you this New Year. Peter.
The World is dividing between the Criminally Insane, warmongering , greedy, barbarous Western Oligarchs and the BRICS+. The ZOG is riding a bloody Bully Beast blasting hundreds of Globalist Pits designed to enslave and destroy the Goy, but like Israel in Gaza, it’s creating a backlash in the hearts and minds of every rational civilized human, now dedicated to utterly destroying the Western Oligarchs: More Power To Them & The Sooner The Better.