

Here is a chart from the good old days of late 2013. Bakken oil production was soaring past 1 million barrels per day on their way to a peak of 1.33 million barrels per day in March of 2015. It’s amazing what junk bond debt and $100 a barrel oil prices can accomplish.
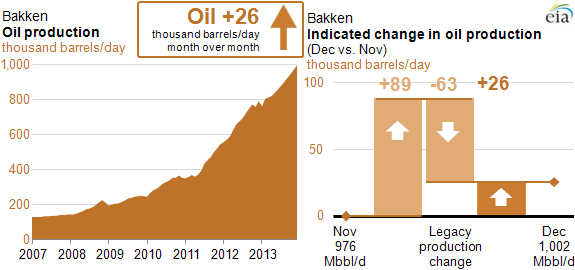
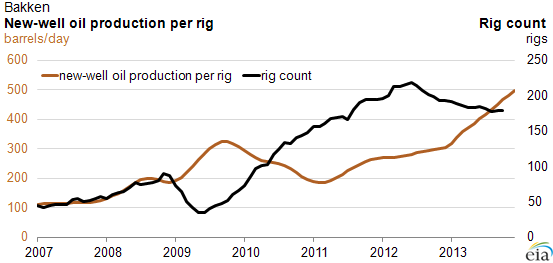
The number of rigs operating grew from 101 in April 2010 to 218 in June of 2012. What a spectacular display of American ingenuity. We were on our way to energy independence according the Wall Street shysters, moronic politicians, and oil industry lackeys.
But a funny thing happened on the way to energy independence. Oil prices collapsed to $50 per barrel. The honest analysts know that oil prices need to be in the range of $80 for shale oil rigs to breakeven. The shysters said not to worry. They could make a profit well below $80.
I wonder how they can explain the absolute collapse in rigs working in the Bakken fields from 194 in September of last year to 101 today. Do companies reduce the number of rigs by 48% in the space of a few months if they can make money at $50 per barrel (their oil actually sells at a $13 discount of $37 per barrel)?
Oil production has already fallen to 1.29 million barrels per day and is headed back down to 600,000 barrels per day at the current rig count. OPEC is pumping a record 31.5 million barrels per day and prices are headed even lower. The Bakken miracle is over. Stick a fork in it. You can check the data yourself at this link:
http://www.eia.gov/petroleum/drilling/#tabs-summary-2

