


“The recurrence of periods of boom which are followed by periods of depression is the unavoidable outcome of the attempts, repeated again and again, to lower the gross market rate of interest by means of credit expansion. True, governments can reduce the rate of interest in the short run. They can issue additional paper money. They can thus create an artificial boom and the appearance of prosperity. But such a boom is bound to collapse soon or late and to bring about a depression.”
Ludwig von Mises
“To combat depression by a forced credit expansion is to attempt to cure the evil by the very means which brought it about; because we are suffering from a misdirection or production, we want to create further misdirection – a procedure which can only lead to a much more severe crisis as soon as the credit expansion comes to an end.”
Friedrich Hayak
John Hussman with another thought provoking piece this morning. Therefore, no on will read it or heed the warning. So it goes.
Valuing the stock market using historical relationships is easy to do. It is never different this time. Only the storylines of shysters change. The ratio of total stock market capitalization to GDP (value of all stocks divided by GDP) has been .63 over the last century. Knowing this number and the current ratio, along with the current dividend yield will allow you to make a ten year return prediction with a high level of confidence. This method was right in 1982 and in 2000. It will be right today. You can expect less than a 2% annual return in the stock market before inflation over the next ten years. You will achieve a negative real return. Here are the unequivocal facts from the article:
Quick Valuation Study: 1982
Let’s try that again. In 1982, the ratio of market capitalization to GDP had fallen to 0.35, while the dividend yield on the S&P 500 had again soared to 6.7%. Nominal GDP growth over the following decade would remain close to its historical average peak-to-peak growth rate across economic cycles, roughly 6.3% annually.
Assuming long-term mean-reversion in the ratio of market cap to GDP, what might you have expected the annual total return of the S&P 500 to be, in the decade following the 1982 low? Do the math:
(1.063)*(0.63/0.35)^(1/10) – 1.0 + 0.067 dividend yield = 19.4% annually.
That estimate would have been almost precisely correct. While small variations in GDP growth and dividend yield can change that basic math in a small, fairly linear way, the main factor behind the outstanding total returns in the decade following the 1982 low was the remarkably depressed initial valuation of the market, reflected by the market capitalization to GDP ratio. For a review of why such ratios outperform variants of price/earnings ratios (unless the analysis also includes explicit adjustment for the level of profit margins).
Quick Valuation Study: 2000
In early 2000, the ratio of market capitalization to GDP reached the highest level in history, at 1.54, while the dividend yield of the S&P 500 was just 1.1%. At that point, a reasonable estimate of subsequent 10-year total returns for the S&P 500 would have been:
(1.063)(0.63/1.54)^(1/10) – 1.0 + .011 = -1.7% annually.
That is just what we were saying in 2000: negative total returns for a decade. Those concerns were predictably shrugged off, as they are today. But in fact, the S&P 500 lost value exactly as expected. Importantly, this outcome was not simply an artifact of the 2008-2009 market decline. By early 2010, when that 10-year period ended, the S&P 500 was already 80% above its March 2009 low (in hindsight thanks to the March 2009 change to accounting rule FAS 157), yet had still posted a negative 10-year total return. The actual total return of the S&P 500 from 2000 to the 2009 low was considerably worse than -1.7% annually.
Quick Valuation Study: 2014
Let’s assume that despite the weak economic growth at present, nominal GDP picks back up to a nominal growth rate of 6.3% annually from here. This may be overly optimistic, but near market peaks, optimistic assumptions often still result in troubling conclusions (recall our 2007 piece An Optimistic Route to a Poor Market Outlook). Given the present market cap / GDP ratio of 1.25 and an S&P 500 dividend yield of just 2%, what might we estimate for total returns over the coming decade?
(1.063)(0.63/1.25)^(1/10) – 1.0 + .02 = 1.3% annually.
Since we use a whole range of additional measures, including earnings-based methods, to estimate prospective returns, our actual estimates are somewhat higher here, at about 2.4% annually over the coming decade. Tomato. Tom-ah-to. Keep in mind that these estimates assume a significant acceleration in economic growth. One can certainly quibble that the long-term ratio of market capitalization to GDP will have a somewhat higher norm in the future. But the present ratio is still 100% above its pre-bubble norm. It’s unlikely that this situation will end well.
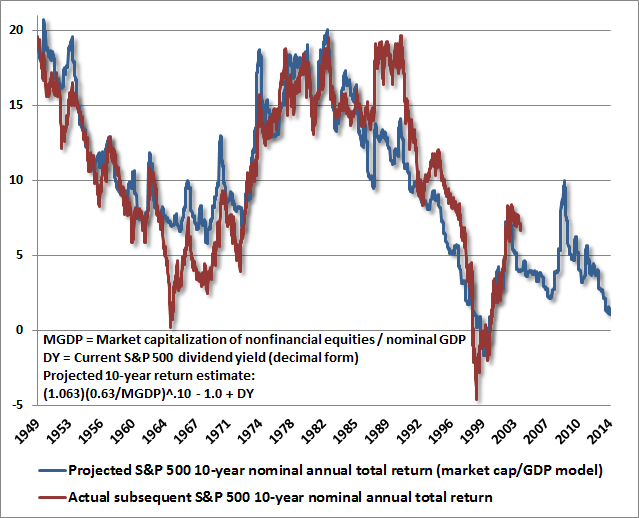
The chart below shows the record of these estimates since 1949, along with the actual 10-year S&P 500 total returns that have followed.
Read the rest of John Hussman’s article.


Part of the problem is that the metrics being used to figure all of this out are nothing but government fabrications.
GDP, for example, is this pie-in-the-sky mongo aggregate of a nation’s supposed output. The fact that government spending is a component should tell you all you need to know. All that money spent in Afghanistan and Iraq? Yep, that counts. So does the billions used to feed the FSA via SNAP cards. Pay people to dig ditches and fill them back up? Yes, it’s a GDP adder!
Like every government statistic, they can’t leave well enough alone. GDP was recently “improved” to include research and development costs. Often R&D doesn’t result in anything constructive. Doesn’t matter. Anything to make the number bigger than reality.
They even went so far as to include books and research papers in the total, even if these things aren’t read by anybody! This is supposed to tell us how productive we are?
Ultimately, GDP, much like unemployment and price levels, is doctored to arrive at a pre-determined outcome. When the data used to generate the statistics fail to achieve what they want, they change the data.
Keep this in mind when they tell you that we’re in an economic recovery; that our economy is growing; that the unemployment rate is falling; that prices are only rising by 1% per year. You’d have to be an idiot to believe any of the baloney coming out of Washington.
I suspect if you plug in zero nominal GDP growth that the number becomes very ugly indeed. I bet GDP growth will be closer to zero than it it will be to 6.3%.
I believe most people, on this site and others like it anyway, are heeding the warning.
No one knows the eventual outcome or a time frame as there are far too many variables, all we can do is sit back, attempt to survive the unwinding and try to stay one step ahead by not falling for the lies and the rosy pictures painted by false government numbers.
The only way we can do that is to hear the truth, the only way we can hear the truth is through sites like this one.
Thanks, again.