

Guest Post by John Hussman
Let’s be clear. October’s market decline was a rather mild warning shot. At its lowest close, the S&P 500 lost -9.9% from its September peak, before rebounding in recent sessions. As I noted during the 2000-2002 and 2007-2009 collapses, intermittent “fast, furious, prone-to-failure” rebounds are among the factors that encourage investors to hold on through the entirety of major declines. After particularly severe down-legs in the market (which we have not yet observed), these rebounds can extend for weeks, and sometimes approach gains of as much as 19% before the market plunges again.
Get used to that kind of volatility. Though it will be essential to monitor market internals for periodic shifts in investor psychology, by the completion of the current market cycle, I continue to expect the S&P 500 to lose nearly two-thirds of its value.
It’s been nearly a year now since we finally identified and fully addressed the core of our difficulty in the half-cycle advance since 2009. In my view, this is such a critical moment in the markets that a careful understanding of that core issue is essential. Though portions will (hopefully) be familiar, I can presently think of no other topic in finance for which the time spent reviewing and understanding will be as valuable.
The heart of the matter, and the key to navigating this brave new world of extraordinary monetary and fiscal interventions, is to recognize that while 1) valuations still inform us about long-term and full-cycle market prospects, and; 2) market internals still inform us about the inclination of investors toward speculation or risk-aversion, the fact is that; 3) we can no longer rely on well-defined limits to speculation, as we could in previous market cycles across history.
Accordingly, nearly a year ago, I resolved that when our measures of market internals are favorable, we will rule out adopting a pre-emptive bearish outlook in response to speculative extremes. Until internals deteriorate explicitly, a neutral stance is as defensive as our outlook now becomes in those conditions. I remain convinced that this change was the critical adaptation, because we know precisely how the other elements of our investment discipline – valuations and market internals – would have navigated this cycle, had we simply not relied on historical ‘limits’ to speculation.
Valuations are informative about long-term returns and full-cycle risks. Market internals are informative about investor psychology over shorter segments of the cycle. Presently, neither valuations nor internals are favorable, and that is what opens up a trap door under the market.
We’ve always recognized that valuations are enormously informative about long-term investment returns, and about potential market losses over the completion of any market cycle. Likewise, we’ve always recognized that valuations can have very little effect over shorter segments of the market cycle. Instead, the behavior of the market over shorter horizons is driven by the psychological inclination of investors toward speculation or risk-aversion.
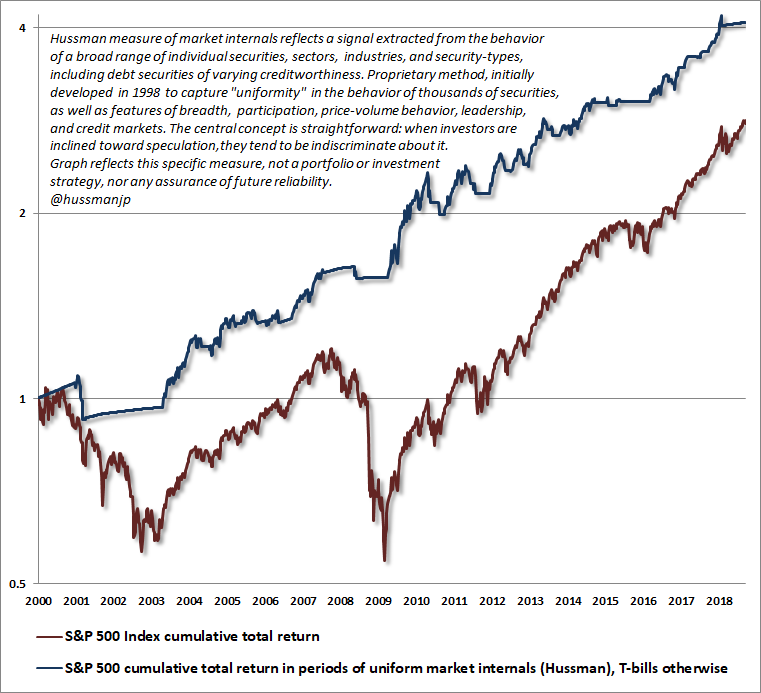
Since speculation tends to be indiscriminate, we find that the most reliable way to measure those psychological preferences is by extracting a signal from the uniformity of market action across thousands of individual stocks, industries, sectors, and security-types (what we collectively call “internals”).
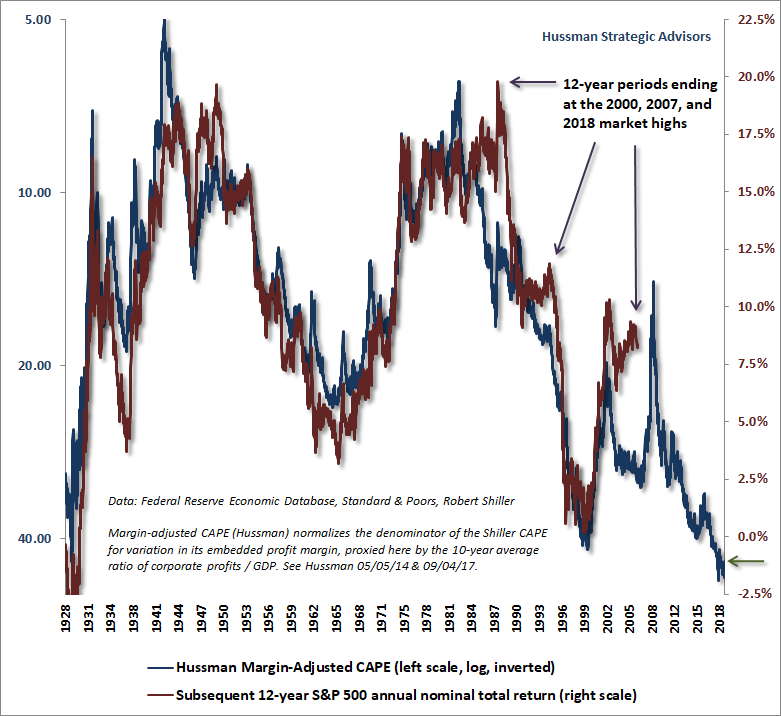
While we don’t disclose our own methods, which I developed in 1998, the central principle is that risk-aversion reveals itself through divergence, dispersion, ragged leadership, and lack of participation in financial market behavior. The chart below is reprinted from last month, and presents the cumulative total return of the S&P 500 in periods where our measures of market internals were favorable, assuming Treasury bill interest is accrued otherwise.
The chart is historical, does not represent any investment portfolio, does not reflect valuations or other features of our investment approach, and is not an assurance of future outcomes. You’ll notice the rather flat-line since February. This reflects the fact that our measures of market internals shifted to a negative condition on February 2, and have remained unfavorable since then.
Speculative psychology has always allowed valuations to run well beyond historical norms over portions of the market cycle. If that wasn’t the case, valuations could never have reached the extremes we observed in 1929, 2000 or at the recent market highs. So the fact that stocks often advance despite extreme valuations is not a valid criticism of valuations. Valuations don’t work that way. They “work” only over the long-term and the full cycle. Investor psychology – whether speculative or risk-averse – drives market outcomes over shorter segments of the market cycle. We read that psychology from the behavior of market internals.
Not surprisingly, the combination of valuations and market internals has admirably navigated complete market cycles across history, and was clearly reflected in our own real-time experience in complete market cycles prior to the recent advancing half-cycle. I discussed this combination as the reason for my bearish outlook at the 2000 and 2007 market peaks, as well as positive shifts in early-2003 and late-2008.
What went wrong for us in the recent advancing half-cycle? Our late-2008 shift to the constructive side was truncated by my insistence on stress-testing our methods against Depression-era data, which is when “overvalued, overbought, overbullish” syndromes became embedded in our approach, as a result of their historical effectiveness. In every other market cycle across history, there was always a limit. Once extreme “overvalued, overbought, overbullish” syndromes emerged, it was advisable to adopt a pre-emptive bearish outlook, even before market internals deteriorated.
Unfortunately, the moment interest rates hit zero, those limits vanished, and preemptively responding to speculative extremes became terrifically detrimental. In hindsight, the fix was simple: abandon the belief in any limit to the stupidity of Wall Street. In the face of a century of evidence to the contrary, we got there incrementally. It was admittedly a tall order for a guy whose doctoral research dealt with “rational expectations” (albeit with asymmetric information and noise), and whose advisor received the Nobel Prize in economics for the concept.
Understand the distinctions here: 1) valuations measure likely long-term returns and the position of the market within the cycle, 2) market internals measure the current inclination of investors toward speculation or risk-aversion, and 3) “overvalued, overbought, overbullish” features historically identified points where speculation had gone too far. In the face of QE and zero interest rate policy, that third feature failed. Neither of the others did.
We know precisely how the other elements of our investment discipline – valuations and market internals – would have navigated this cycle, had we simply not relied on historical ‘limits’ to speculation.
In short, while we can still draw reliable information from valuations about long-term returns and full-cycle risks; while we can still reasonably identify when speculative or risk-averse investor psychology dominates (and position ourselves accordingly); and while we can adopt a neutral outlook in sufficiently extreme conditions; we resolved last year to postpone a bearish outlook, regardless of “overextended” speculation, until market internals deteriorate explicitly.
I have little question that Federal Reserve policy has again produced a bubble that will have extraordinarily disruptive consequences. The advance of recent years has produced a toxic combination of extreme valuations in every conventional asset class, coupled with a breathtaking mountain of low-grade debt issued by Wall Street (“product” as it was called in the mortgage bubble) to satisfy the yield-seeking speculative demand of investors. As Stanley Druckenmiller, one of the most successful investors in history, recently said of the 2007-2009 global financial collapse:
“Bernanke and I have a big disagreement over what caused the crisis, but to me, the seeds of it were born in ’03 when we had 9% nominal growth in the 4th quarter and we had 1% rates – which wasn’t enough, he had that stupid ‘considerable period’ thing attached… and you had serious, serious malinvestment for 3 or 4 years. We seem to learn something from every crisis. In this one, we didn’t learn anything… We tripled down on what caused the crisis, and we tripled down on it globally. With Wall Street just cheering them on.”
Our measures of market internals shifted to a negative condition the week of February 2, 2018. In the recovery that followed the February market plunge, the dispersion and deterioration of market internals became materially worse. Presently, our outlook remains defensive. Yet the central thing to recognize is this: if those same measures of market internals improve, our near-term outlook will immediately shift neutral or constructive (with a safety net if valuations remain extreme at that point).
In short, while we can still draw reliable information from valuations about long-term returns and full-cycle risks; while we can still reasonably identify when speculative or risk-averse investor psychology dominates (and position ourselves accordingly); and while we can adopt a neutral outlook in sufficiently extreme conditions; we resolved last year to postpone a bearish outlook, regardless of ‘overextended’ speculation, until market internals deteriorate explicitly.
I can’t emphasize this point enough, because this “permabear” label of mine is wholly an artifact of our pre-emptive response to “overvalued, overbought, overbullish” conditions in the recent half-cycle. Absent that response, the fact is that the combination of valuations and market internals was sufficient to navigate the recent cycle beautifully, and can fully tolerate extraordinary monetary policies and other interventions. Indeed, the entire total return of the S&P 500 since 2007 has occurred in periods where our measures of market internals were favorable, while nearly the entire 2007-2009 collapse occurred in periods when they were not. Likewise, as I observed after the market collapse in October 2008, our valuation measures identified the market as undervalued then, as clearly as they identify the market as breathtakingly overvalued today.
Valuations are informative about long-term returns and full-cycle risks. Market internals are informative about investor psychology over shorter segments of the cycle. Presently, neither valuations nor internals are favorable, and that is what opens up a trap door under the market. There will certainly be periods where short-term oversold conditions will enable scorching market rebounds (what we typically describe as “fast, furious, and prone to failure”), but the strongest market return/risk profiles we identify will be associated with points where a material retreat in valuations is joined by an early improvement in our measures of market action.
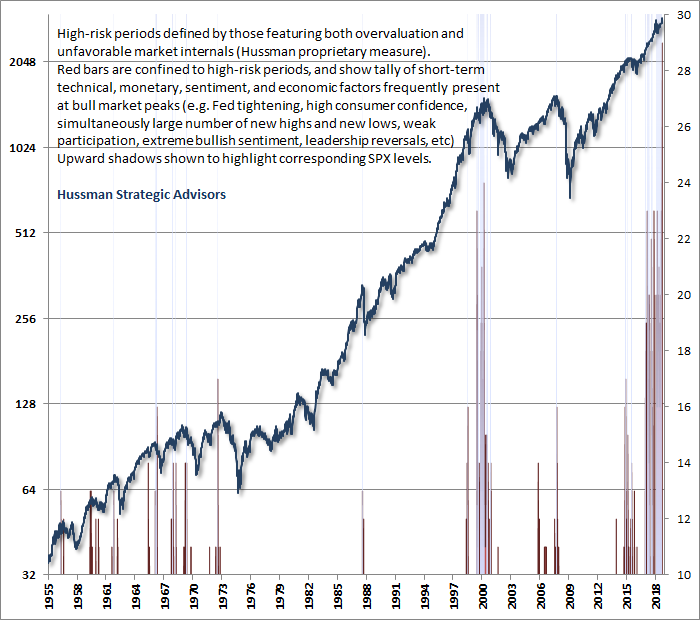
In the context of obscene valuations and unfavorable market internals (which we have to watch flexibly), the only time we’ve seen anywhere near the number of classic top features as Sep 20, 2018 was the week of March 24, 2000. We should periodically expect scorching advances from short-term oversold conditions, but the key features that will more durably change the market outlook are valuations and market internals.
Valuation review
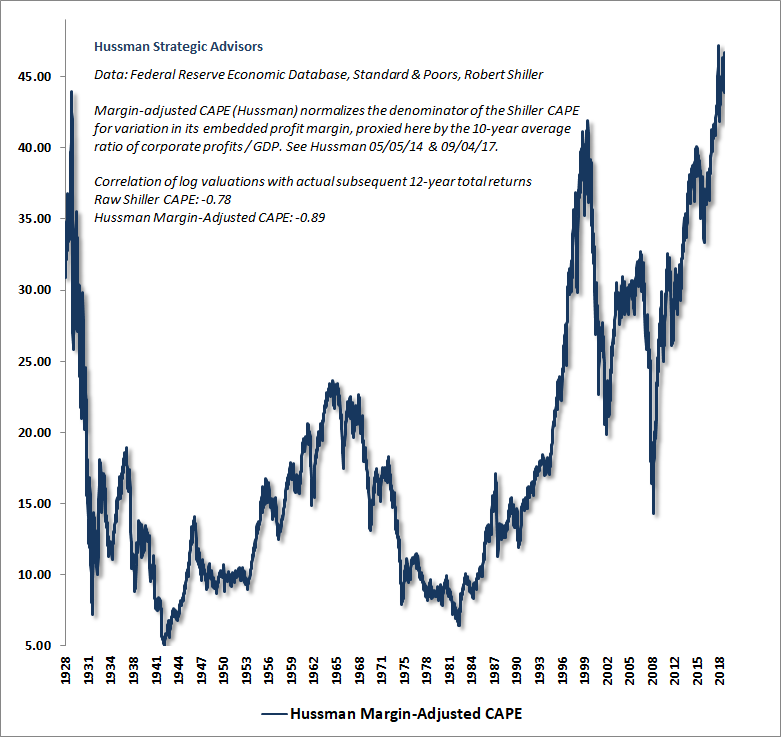
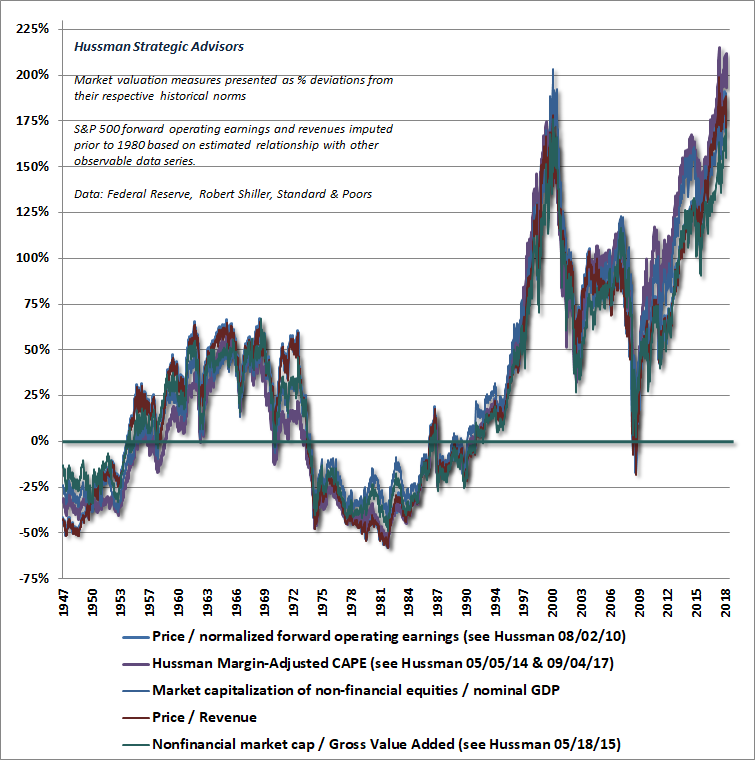
The chart below updates our Margin-Adjusted CAPE, which is substantially better correlated with actual subsequent market returns than Robert Shiller’s raw cyclically-adjusted P/E. Notice that despite the recent weakness, valuations have retreated only to the level they reached in November 2017, matched in history only by the 3 weeks surrounding the 1929 market peak. While market action might be considered “oversold” from a short-term perspective, present valuations by no means represent “cheap” or “discounted” levels from an investment standpoint.
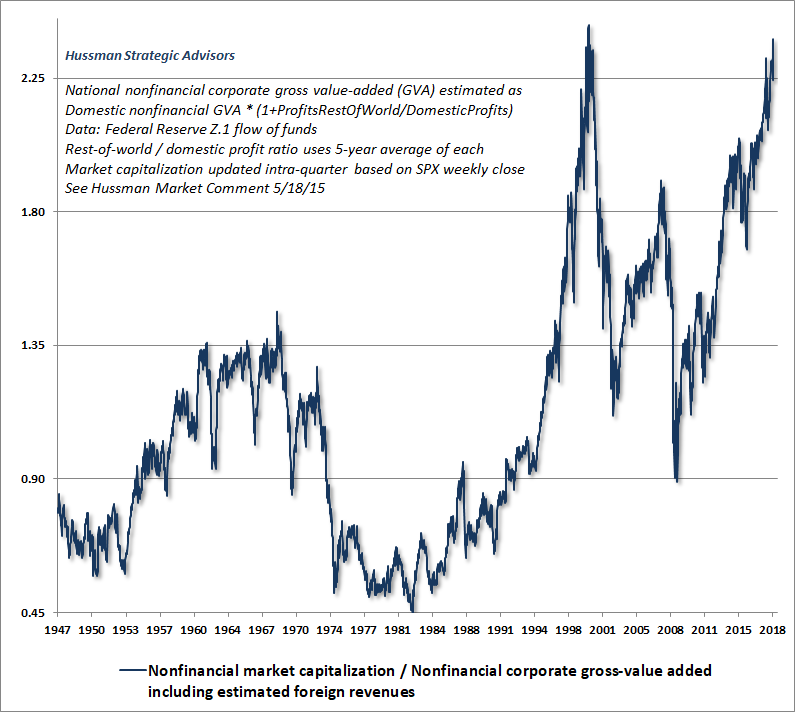
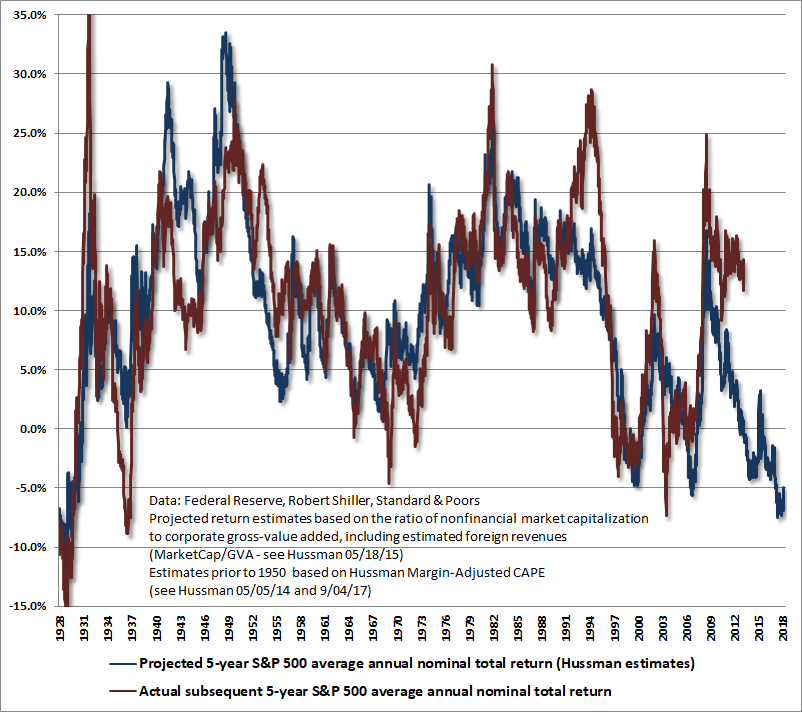
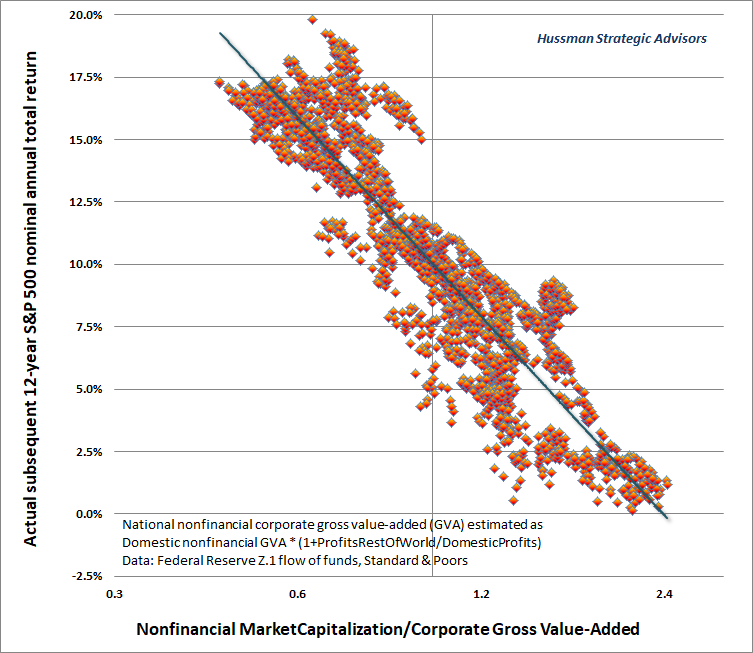
The next chart shows the ratio of nonfinancial market capitalization to corporate gross value-added, including foreign revenues. I introduced MarketCap/GVA in 2015, to provide a broad, apples-to-apples measure of market valuation. With a 93% correlation to actual subsequent S&P 500 total returns, no other measure of valuation we’ve tested is more reliable, including price/operating-earnings, market cap/GDP, market cap/NIPA profits, or the Fed Model. It bears repeating that despite the recent market losses, current levels are not “discounts” in any meaningful sense of the word.
The next chart shows the relationship of our Margin-Adjusted CAPE and actual subsequent 12-year S&P 500 average annual nominal total returns. Notice that we often observe a transient “error” at bubble peaks, as actual market returns exceed the returns that one would have projected on the basis of valuations 12-years earlier. What’s notable, as I’ve shown in prior comments, is that these “errors” are highly correlated with the level of consumer confidence at the end of those 12-year horizons, which is another way of saying that while valuations drive long-term returns, short-term deviations from valuations are driven by temporary cyclical fluctuations in investor psychology.
“Errors” contain information
What may not be obvious is how informative those “errors” are about subsequent market returns. Specifically, when market returns exceed or fall short of the trajectory implied by prior valuations, there is a very strong tendency for returns to sharply correct that “error” over a small number of years. This should be clear from the vertical drops in the red 12-year total return lines during 1988-1990 and 1995-1997 (corresponding to the 2000-2002 and 2007-2009 collapses at the end of those 12-year horizons), but the tendency is actually very systematic.
If the decay in overvaluation or undervaluation was always very smooth, current valuations would be reliable measures of expected returns even over periods of a few years. Instead, disproportionately glorious or violent market returns tend to emerge when valuations have “overshot” their course. When the projection horizon is only a few years, it’s actually more accurate to base shorter-term projections off the tail-end of previous long-term projections than it is to estimate those returns directly from prevailing valuations.
To illustrate, the following analysis examines the 12-year return implied by valuations 7 years earlier, and computes the return that would be required over the following 5 years in order to satisfy the original 12-year projection. The approach is a modification of one suggested by Duane Van Vuuren, where my calculation here is: {(1+Er12)^12/(1+r7)^7}^(1/5)-1, where Er12 is the expected 12-year S&P 500 annual total return 7-years ago, and r7 is the actual S&P 500 annual total return since then.
At the recent market high, this calculation implied a prospective 5-year total return of about -7.5% annually for S&P 500 (even allowing for dividend income and historically normal earnings growth), implying that even with 5 years of intervening earnings growth, investors should not be surprised if the level of the S&P 500 Index, in 2023, remains about 40% below its recent high.
When market returns exceed or fall short of the trajectory implied by prior valuations, there is a very strong tendency for returns to sharply correct that ‘error’ over a small number of years.
The key proposition here is that valuations have a very strong tendency to normalize over time, and even when the trajectory deviates from that, market returns in subsequent years are often highly concentrated, in a way that corrects the deviation. Put simply, deviations in market returns from the trajectory implied by valuations aren’t just random “errors.” Instead, they are highly informative about likely future market returns.
Ergodicity
One of the excruciating features of, well, of being me, is what I call the “recycled zombie trollbait attack.” This usually involves someone with no apparent knowledge of statistics forwarding some article claiming to deconstruct our “entire thesis” based on some argument that I’ve already addressed, often years earlier, with boatloads of evidence. These are usually posted to social media with a flourish, as if Chief Inspector Poirot had just emptied a box on the table demanding “How do you respond to this?!?”
It would be nice if these people would actually read my stuff.
Among the more recent criticisms is the claim that, because we typically associate valuations with subsequent 12-year market returns (the point where autocorrelation drops to zero and mean-reversion is most reliable), even a century of market history “really offers only 8 independent data points.” The implication is that any conclusions are obviously so fragile that our entire valuation thesis can be dismissed.
This argument reflects a wildly naïve understanding of how statistics work. Let’s examine why.
Watch a bunch of experienced trick-or-treaters running through a neighborhood to fill their bags with candy, and you’ll see a process called “ergodicity.” It’s a concept originally described over a century ago by the Austrian physicist Ludwig Boltzmann. Ergodicity describes the tendency of a given system to visit all representative states over time.
Here’s an example of a non-ergodic system. Suppose we choose the first data observation “y1” at random, but all subsequent observations are set equal to y1. In that kind of a system, no matter how many observations you obtain, your “effective” sample size is still just one observation. Intuitively, if a system “moves” very slowly from one observation to the next, it has low ergodicity and you’ll therefore need a lot of data points in order to describe its dynamics. In contrast, when a system visits a broad range of possible states over time, far fewer data points are needed in order to fully describe the system.
The fact is that U.S. stock market valuations are highly ergodic, meaning that within a reasonable number of years, you’ll typically see valuations cycle across a wide range of possible states. Think of the difference between the 2000 market peak and the 2002 trough, or the 2007 peak and the 2009 trough. Within a 9-year period, the S&P 500 made multiple trips covering the full distance between breathtaking overvaluation, fair-valuation, and even moderate undervaluation. That’s important, because that ergodicity dramatically increases the “effective sample size” of any analysis.
Watch a bunch of experienced trick-or-treaters running through a neighborhood to fill their bags with candy, and you’ll see a process called ‘ergodicity.’ Ergodicity describes the tendency of a given system to visit all representative states over time.

Statistically naïve critics of our long-term valuation work would suggest that if one looks at the relationship between valuations and subsequent 12-year market returns over a given 20-year period, you’ve really only got 20/12 = 1.7 “independent” observations. In fact, however, a 20-year period is generally enough to traverse a full range of possible market conditions. So while we can certainly concede that, say, 20 years of weekly data on valuations and subsequent 12-year returns provides far fewer than 1040 informative data points, the effective sample size is also dramatically higher than 1.7.
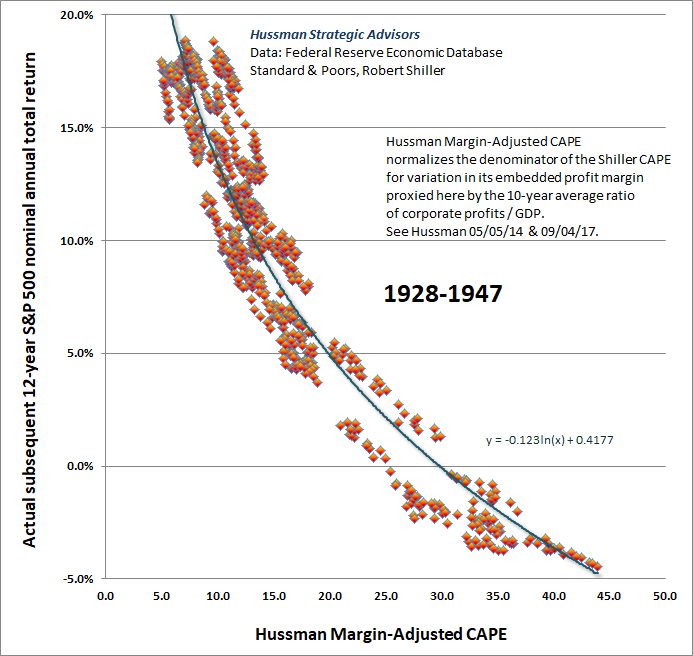
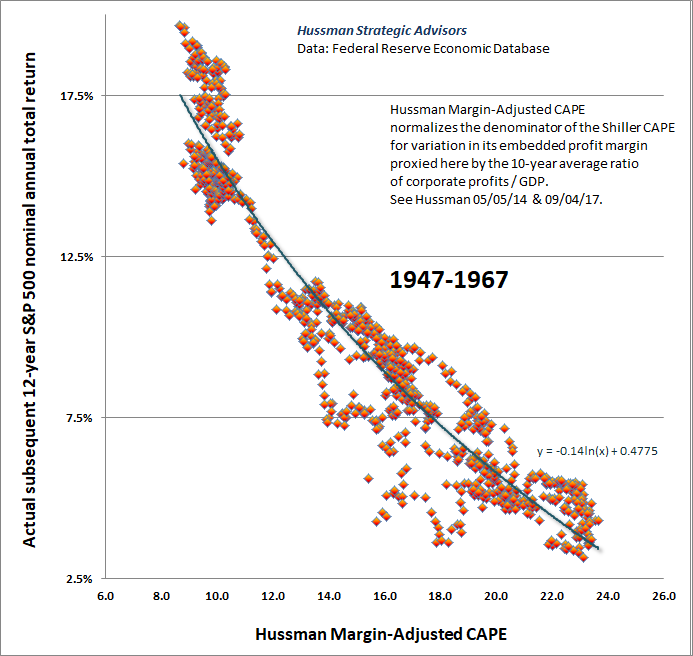
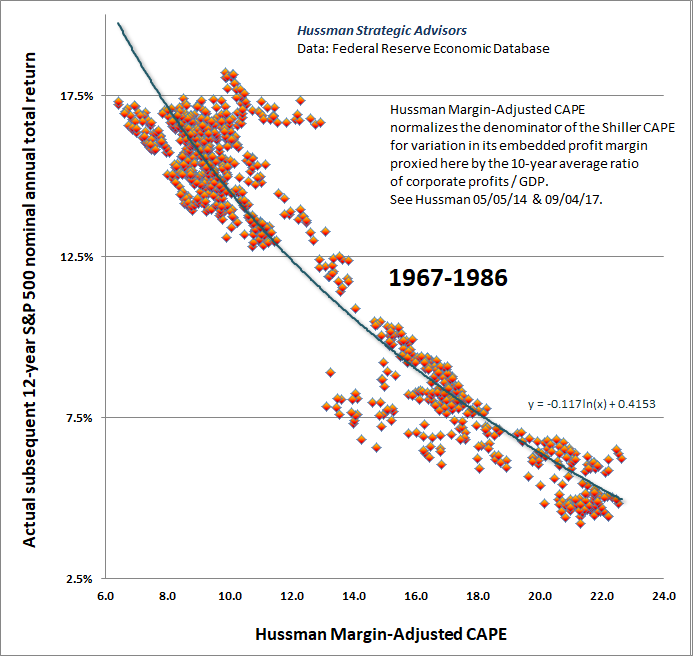
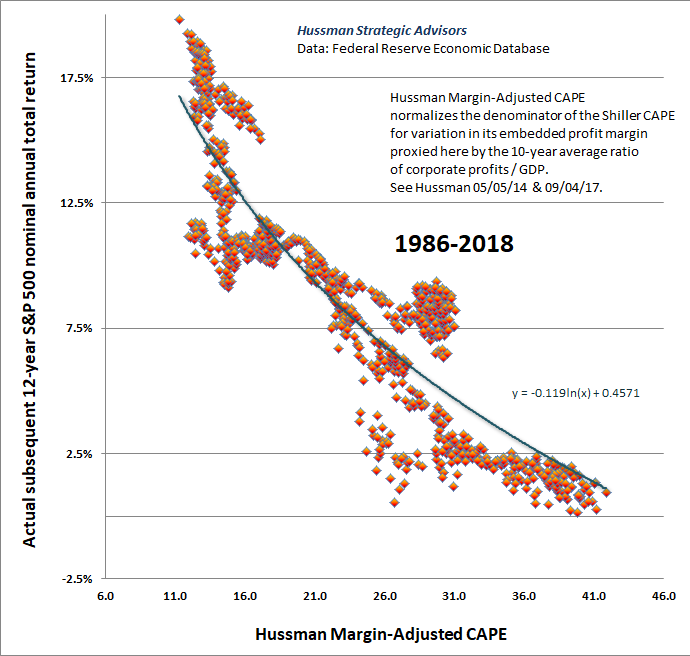
To see this, the charts below break the period from 1928 to the present into four segments: 1928-1947, 1947-1967, 1967-1986, and 1986-present (though since we’re looking at subsequent 12-year market returns, we only have full data on that last period through October 2006). Each scatter plot shows our Margin-Adjusted CAPE on the horizontal axis, along with the actual subsequent 12-year average annual nominal total return of the S&P 500 on the vertical axis. Though it’s not necessary, there’s also a regression line and equation on each, just for fun. As usual, for reasons I’ve detailed elsewhere, the proper way to relate valuations to subsequent market returns is to use log valuations.
Each chart should make it clear that there are dramatically more than 1.7 “effective” data points in each sample. During each period, market valuations traversed an extensive range of possible states. The robust ergodicity of the system, and the broad range of resulting market outcomes, allows the system to be fully characterized in each sample. Now look at the regression equations in the four graphs below. Within a small range of variation, they’re remarkably similar, in each case demonstrating a consistently strong negative relationship between (log) market valuations and subsequent S&P 500 total returns.
Geek’s Note: Much of our valuation work reflects the rather direct one-to-one correspondence between (log) valuations and subsequent market returns. We rarely run multivariate regressions except when we’re estimating missing data. In the few cases where we do estimate relationships using regressions, the fact is that overlapping observations don’t result in biased parameter estimates anyway, only biased t-statistics because the correlated residuals produce standard errors that are too low using OLS formulas. If you’re going to publish an academic paper, there are useful methods to obtain valid t-statistics, like filtering the data using the Cholesky inverse and bootstrapping the distribution with Monte Carlo methods (see, for example, my scientific papers in Molecular Autism and Nature – Genes & Immunity). There’s no debate about t-statistics – it’s just that the need to adjust the standard errors does nothing to bias the parameter estimates, not that we rely on estimated parameters anyway. As for the correspondence between valuations and market returns, the one-to-one mapping is evident even without the use of least-squares regression.
Valuations and full-cycle risks remain extreme
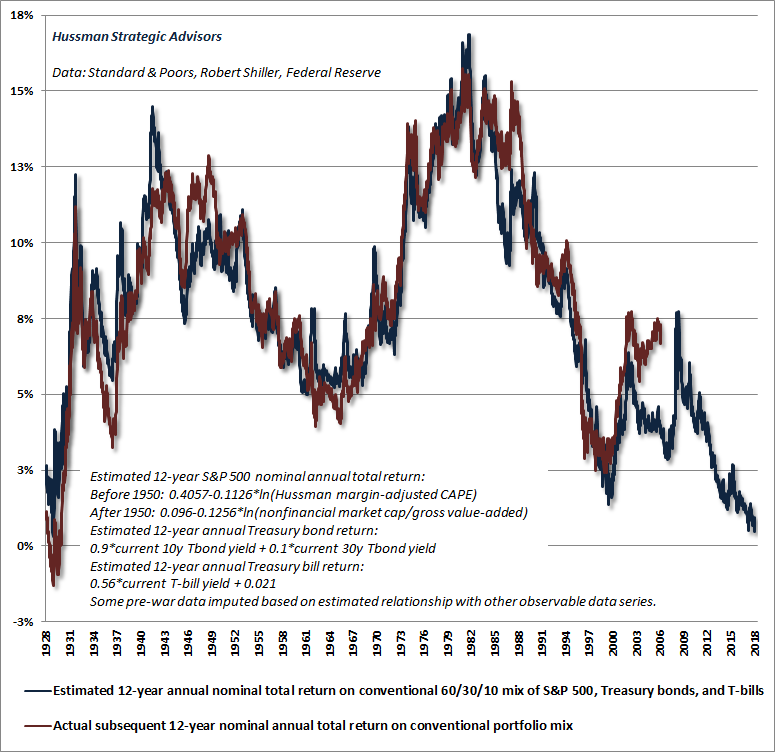
Critics often describe my valuation work as if it’s some nefarious curve-fitting, data-mining exercise. In fact, however, we generally compare log valuations and subsequent returns directly, with no parameter fitting at all. Moreover, the measures we find most strongly correlated with actual subsequent market returns all share a common feature, which is that they represent market-wide apples-to-apples ratios of market capitalization to corporate revenues. The chart below presents 12-year S&P 500 nominal total returns in relation to the best-performing measure I’ve developed on that front, the ratio of non-financial market capitalization to corporate gross value-added, including estimated foreign revenues (MarketCap/GVA is shown on log scale, which is why the line doesn’t bend as in the previous charts).
It’s important to recognize that despite its discomfort, the market decline we observed in October is only a drop in the bucket toward normalizing valuations. I’ll say this again, because it is important. Over the completion of the current market cycle, I fully expect the S&P 500 to lose close to two-thirds of its value from the recent peak. We don’t require this outcome as a precondition for adopting a bullish market stance, as an improvement in market internals alone would encourage a neutral or even constructive market outlook (though with a safety-net given present market extremes). The problem is that there is no market cycle in history, even at the 2002 low, that ended at market valuations greater than half the level they established at the recent peak.
This is clearly not a favorable outlook for passive investors. While investors have embraced passive strategies as a result of strong backward-looking returns, this popularity represents little but performance-chasing at the most extreme valuations in history. At the recent market peak on September 20, we estimate that the prospective 12-year total return from a conventional passive asset mix invested 60% in the S&P 500, 30% in Treasury bonds, and 10% in Treasury bills reached a low of just 0.48%. There is only one instance in history when these estimates were lower, which was in the 3 weeks immediately surrounding the 1929 market peak. Given that most pension funds assume future returns in the range of 7% annually, it implies that the coming years are likely to include a rather widespread pension crisis.
Shorter-term, remember that bear markets regularly include scorching advances from oversold conditions, each time prompting dip-buyers to exclaim “New highs, here we come. Am I a genius or what?” and encouraging long-term investors to breathe “Phew, I’m glad that’s over.” A typical bear market includes several waterfall declines, along with multiple interim recoveries approaching even 10-20%.
A note on discipline
As I observed a month ago, the week of September 20 featured the broadest collection of classic top features in history, approached only by the number observed the week of March 24, 2000, which was the peak of the tech bubble. It’s essential to maintain a flexible view, particularly if we observe a favorable shift in market internals (no sign of that presently), but for now, it is important to allow for the likelihood that the U.S. stock market entered a bear market on September 20.
Every share that has been issued by corporations has to be held by someone until it is retired, so there’s no sense in encouraging investors to “sell.” There’s no getting out in aggregate. Rather, investors would be well advised to review their own risk tolerances and investment positions, so that a half, or two-thirds market loss would be tolerable without causing them to abandon their investments after the decline.
It’s worth remembering now that discipline is one of the central challenges in responding to market behavior, whether one uses internals, trend-following measures, momentum, or other factors. One reason we pay close attention to market internals is that we find them far more reliable than standard trend-following approaches. “Whipsaws” can also be challenging. In daily data, for example, the S&P 500 has crossed its 200-day moving average 62 times since the 2009 low. Yet even for strategies that are more reliable in historical and out-of-sample data, actually acting on their guidance can be difficult.
Trend-followers, for example, may plan to exit the market when prices break down, but once prices break down, they often decide that swing-trading and buying dips is the appropriate strategy, and after the market declines further, they suddenly fancy themselves as value investors. That’s how investors end up holding stocks all the way down to the bottom of a bear market. Severe market declines have a funny way of turning short-term speculations into long-term investments.
Our approach is to consider all of these components in view of their reliability and the context in which they are appropriate. For example, when internals are uniformly favorable, dip-buying tends to be reliable, and overvaluation is often unimportant. Conversely, when internals are uniformly negative, dip-buying is often disastrous and overvaluation can suddenly matter with a vengeance.
So be careful about strategy-creep. I don’t encourage anyone to change their discipline, whether they are passive investors, trend-followers, value-investors, or swing-traders. What I do encourage, however, is that you have a full understanding of where we are in the market cycle; that you consider the potential downside risk of the market; and that you honestly assess the amount of market weakness you would be able to tolerate without abandoning your discipline. Do that now. If you’re heavily invested in stocks and you decide to do nothing, that’s fine, but it will still help enormously to write down exactly why you are making that decision, so the decision is explicit, and so that you can review, in the future, the data, reasoning, and considerations that went into it.
Caution: If your reason for holding a full plate of equity market risk here is that valuations have been elevated for years and stocks have continued to advance, you haven’t actually taken anything from the preceding commentary. It may help to go back to the top, and start over with careful attention to the beginning section. An unbiased re-reading may help to avoid a distressing experience over the completion of this cycle.
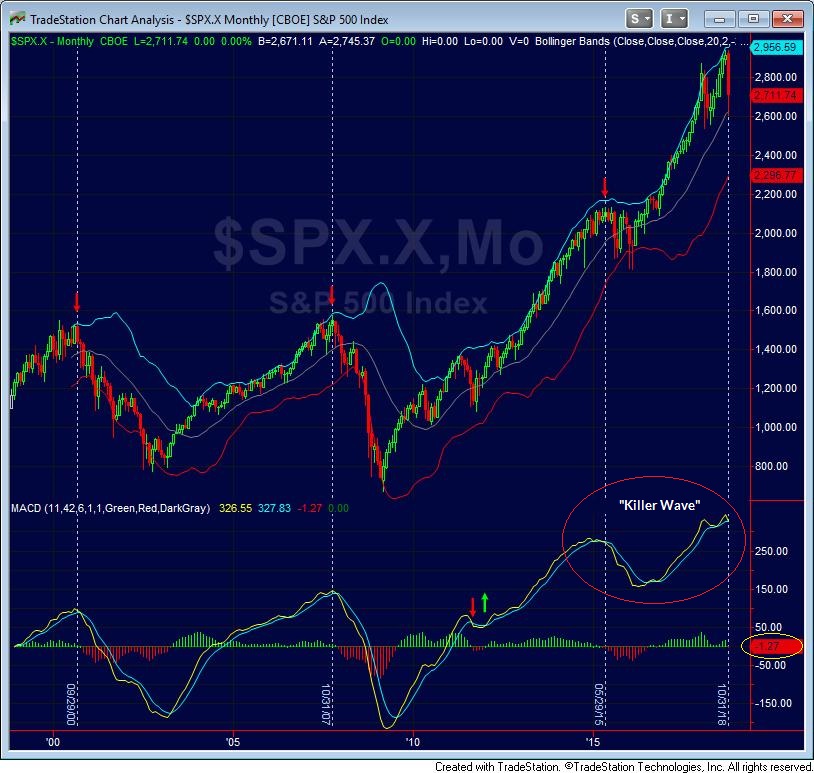
A final side-note. Though it’s not actually a part of our investment discipline, below is a chart that I keep among a pile of studies on my screen – a “moving average convergence-divergence” or MACD study of the S&P 500. It’s based on monthly data, so it largely reflects considerations similar to the old Coppock Guide, which captures deterioration in cyclical market momentum. As with that measure, double-tops or “killer waves” have historically preceded the most violent bear markets, for the simple reason that the only way to get a killer wave is for a bull market advance to persist for an unusually extended period of time.
At the end of October, this measure turned down, as it did in 2000, 2007, and at the 2015 peak that preceded a 14% swoon into early 2016. Again, our inclination is to focus on valuations and internals, but from our standpoint, conventional trend-following measures aren’t terribly favorable here either.
Market conditions will change, and the outlook will change along with them. In particular, the strongest market return/risk profiles we identify are associated with a material retreat in valuations that is joined by an early improvement in market action. During the recent advance, increasingly extreme “overvalued, overbought, overbullish” conditions encouraged us to adopt a pre-emptive negative market outlook, which was a useful response in market cycles across history, but detrimental in the face of persistent speculation prompted by zero interest rates. We’ve adapted so that market internals always take priority.
My hope and expectation is that our long-term followers, particularly those who were with me in complete cycles before 2009, will feel very much like an old, familiar friend is back at the wheel. In any event, we’ve made our adaptations, and we’ll continue to adhere to a value-conscious, historically-informed, full-cycle investment discipline.

I scrolled through this–what the fuck did he say?
Me, too. I tried. Really.
Admin? Anybody? Good Lord.
Small wonder I’m not a market analyst. Yo No comprendo.
My thoughts exactly, Robert.
He said the market is going to drop by 67% by the time this bear market is over.
And that it’s going to be a bumpy ride all the way down.
So many word so little time
More like 89% at the real bottom.
Exactly why I’m not in the casino called the stock market
Don Henley sang that forgiveness was the heart of the matter. I think not.
Since the government broke all the rules of macro-economics under Obama, and Wall Street broke all the rules before 2008, experts have been writing mole hills of words to describe the shadows of tea leaves; the money will all disappear in TPTB accounts like magic.
I’ve read Hussman’s analyses over the years and I have a great deal of respect for him, but he is an economist and so uses conventional, quantitative statistics (normalised) to analyze the markets. They tend to understate tail risk quite frequently, (discount the outliers, or black swans) although I’m not sure there is another way, statistically, that can measure and predict that. Qualitative analysis is useful but not predictive in the short term.
My opinion is this time is unique and I don’t think it will end in a fashion like all the others. This enormous, everywhere, everything, bubble has built enormous systemic risk that can’t be measured or timed. Like a bridge, over-stressed with use, it only takes that one extra vehicle to bring it down, catastrophically.
The punditry expect it to end much like all the others – as a process. I’m not so sure about that but we’ll see.
What?
More Hussman doom porn. Someday he, like every analyst, will eventually be right. Ignoring him for the last ten years has been profitable. The next ten? Nobody really knows.
I recently sent this to a few family members and friends about Precious Metals. Considering the times we are living in and the Federal Debt/Credit/Derivative/Student Loan/Car Loan/Fiat looming EVERYTHING BUBBLE. I am really worried about some of them as they have everything tied up in paper assets that could easily go poof!
I was just trying to motivate some of them to buy some PMs, hedge, and stash it away.
ONLY 28%OF AMERICANS ARE “FINANCIALLY HEALTHY” DESPERATE THE LARGEST WEALTH BUBBLE EVER
https://www.zerohedge.com/news/2018-11-01/only-28-americans-are-financially-healthy-despite-largest-wealth-bubble-ever
FACTS:
• Gold has performed better than the markets ever since the late 90s when the Dot Com Bubble was building for
its burst in 2001.
• Since then Gold has quadrupled as of today.
• Stock markets haven’t even tripled since then. And that’s with stocks near all-time highs while Gold is today
more than 30% below its high in 2011 when it was artificially forced down by the international Banksters.
• One could have been long on Gold this entire time (2000 to 2018) and the results would have outperformed the
USA’s entire economic performance.
• It’s estimated only about 3% of Americans own Precious Metals and they are mostly the wealthy elite and the
Banks. The vast majority of Americans have been dumbed down and have no idea of the 3,000 year history of
Precious Metals wealth preservation and ability to retain value (actually skyrocket) when stocks, bonds, real
estate and especially made from thin air “fiat currency” (like the dollar) crash…as they all do in inevitable
cycles.
• Since the turn of the 21st century, 18 years ago – Gold is up 428% …the S&P up 213%
SILVER IS NOW EVEN MORE PRECIOUS THEN GOLD DO YOU OWN ANY??
This is an interesting article and the comments are as well. My point about only 3% of Americans holding any physical Gold and Silver to hedge and protect themselves from our boom – bust Bankster/Wall Street roller coaster controlled economy is this 3% are mostly wealthy elites. THAT WOULD NOT BE ME OR YOU.
My point is…if you read all this…if it is of interest to you…a 5% to 10% or whatever you are comfortable with hedge in physical Precious Metals could save your net worth from the looming EVERYTHING BUBBLE…just saying. Who knows the timing of the pop…but the pop is inevitable…it’s called ECONOMIC HISTORY “the past is prologue.”
MY THEORY ABOUT GOLD AND SILVER FOR LONG TERM INVESTORS
by Wolf Richter • Sep 4, 2018
A Christian PM Company below you can make small purchase from – with low costs and a trusted delivery record:
https://sdbullion.com/?msclkid=35ba922d5a4a119a8247c9f69286bdbd&utm_source=bing&utm_medium=cpc&utm_campaign=SD%20Bullion%20Brand&utm_term=sd%20bullion&utm_content=SD%20Bullion%20exact
Interesting linked articles and sources you provided in your comment, Mark. So, Thx.
Augee,
Your welcome.
I started buying Silver just after the Hunt Brothers got their clock’s cleaned by the Central Banksters in the early 80’s, went in big (for me at the time) when it was under $5 an ounce. Read every book on PM I could find – educated myself. Then I went back in – in the late 90’s I knew both PMs were at unbelievable historical lows against the dollar. Then started cost averaging buying in 2015-16- 17 after they were both forced back down a bit by the Banksters and I’m still stacking in 18. II never thought the Everything Bubble would hold together this long).
There are just so many people I care about that are completely blind when it comes to the economic risk they have put themselves into by having nuch to all they own and have saved in paper assets under the control of parasitical monsters.
I have sent them many articles like the above over the years and some of them have woken up. I have two Nephews who I gave each an ounce of Golds as wedding presents. One sold his pretty quick for $1,400 and change. The other gets it, kept his and know he has stacked his own long stash. I paid $280 an ounce for each American Eagle in 99.
I showered and shaved prior to reading this article. When I finished I showered and shaved again.
This author is a baffon. He used the word valuations 39 times and acts like the tail wags the dog. Charts show the market. The market is not dictated by charts moran. I feel people that spout this BS are communist. My reasoning is they put incredible fear into average investors by being perma bears and those investors miss the bull market. If all americans dont grow their money our country is broke. Seems like their is a hidden agenda to these perma bears. He offers zero reasoning why he feels the s&p 500 will lose 66%. Did not even provide any “if’s” (if this or that happens). He just trys placing fears of the market with a fear by selected (old) charts to support BS. The market is forward looking. “Valuations” are forward looking and include expectations of the sales and management capabilities that run a company. I really wish these websites would put credible info instead of BS authors such as John Hussman’s drivel into the public domain. They are permacynics offering no means of making money. They sound like democrats; oppose, obstruct, deny while offering zero solutions to grow or protect money. They just constantly bitch how bad things are even when things overwhelmingly positive. Crawl back into your stupid whole Mr. Hussman.
Make is very simple for ya, Jonnyboy
History Repeats….
This man is incredibly smart and educated…But, the field is essentially trying to predict human behavior which is only 50% rational, on a good day..Throw in a completely corrupted monetary system and a venal political system owned and directed by the Wallstreet mafia and I will give you the secret to investing: THEY WIN and YOU LOSE…Any questions???