

Guest Post by David Stockman

The recent news that US home prices in December were up by 6.1% on a Y/Y basis is just one more reminder of why the Fed’s pro-inflation policies are so insidious. In essence, they set up a running battle between asset prices and wages, and the former wins hands down.
For avoidance of doubt, here is the long view on the matter:
Index of Median Home Price Versus Average Hourly Wage, 1970 to 2023
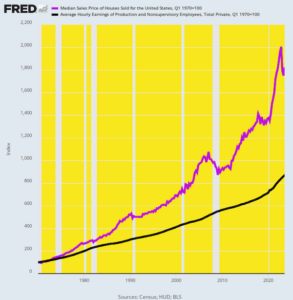
We have indexed the median sales price of homes in America and the average hourly wage to their values as of Q1 1970. That was the eve of Nixon’s plunge into pure fiat money at Camp David in August 1971 and all the resulting monetary excesses and metastases since then.
The data leaves no room for doubt. Home prices today stand at 18.2X their Q1 1970 value while average hourly wages are at only 8.7X their value of 54 years ago.
Expressed in more practical terms, the median home sales price of $23,900 in Q1 1970 represented 7,113 hours of work at the average hourly wage. Assuming a standard 2,000 hour work year, wage workers had to toil 3.6 years to pay for a median-priced home.
With the passage of time, of course, the Fed’s pro-inflation policies have done far more to goose asset prices than wages. Thus, at the time of Greenspan’s arrival at the Fed after Q2 1987 it required 11,350 hours to purchase a median home, which figure had risen to 12,138 hours by Q1 2012 when the Fed made its 2.00% inflation target official. And after still another decade of inflationary monetary policy, it now stands at just under 15,000 hours.
In a word, today’s median home price of $435,400 requires 7.5 standard work years at the average hourly wage to purchase, meaning that workers now toil well more than twice as long as they did in 1970 to afford the dream of home ownership.
So the question recurs. Why in the world would our esteemed central bankers wish to impoverish America’s workers by doubling the working hours needed to buy a median priced home? And, yes, the above assault on the middle class is a monetary phenomenon. It was not caused by home builders monopolizing the price of new houses nor by shortages of land, lumber, paint or construction labor over that half-century period.
To the contrary, when the Fed inflates the monetary system, the resulting ill-effects work through the financial markets and real economy unevenly. Prices, including those for labor and assets, do not move in lockstep, because foreign competition holds down some prices and wages while falling real interest rates and higher valuation multiples inherently cause asset prices to rise disproportionately.
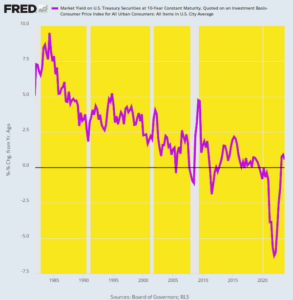
Thus, the reference rate for all asset prices — the 10-year US Treasury note (UST) — fell drastically in real terms during the last four decades of that period. Real rates above 5% during the 1980s fell to the 2–5% range during the Greenspan era, and then plunged further, to zero or below, owing to the even more egregious money-printing policies of his successors.
Inflation-Adjusted Yield on 10-Year UST, 1981 to 2023
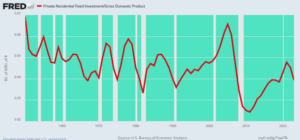
The stated purpose of the easy-money trend depicted above, of course, was to spur more investment in housing, among other sectors. But that didn’t happen. The residential-housing-investment-to-GDP ratio dropped from the historical 5–6% zone prior in 1965 to an average of 4.5% during the period of the Greenspan housing bubble peak in 2005. After the housing crash during the Great Financial Crisis it barely posted at 3% of GDP before rebounding irregularly to 3.9% in 2023.
Any way you slice it, however, the aggressive monetary expansion after 1987 did not spur incremental housing investment on any sustainable basis. Instead, it led to debt-fueled speculation in the existing housing stock, sending prices rising far faster and higher than the growth of household income and wages.
Residential Housing Investment % of GDP, 1950 to 2023
An alternative measure of the impact of easy money on housing investment can be seen in the index of housing completions relative to the US population. Since the early 1970s that ratio has been trending steadily downward and now stands at only 45% of its 50-years-ago value.
Index of Private Housing Unit Completions to the US Population, 1972 to 2023
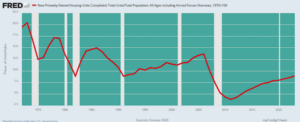
Needless to say, if cheap mortgage credit were the elixir it is claimed to be, the line in the chart would have trended skyward. As it happened, however, it is a stinging repudiation of the very essence of the liberal political case for low interest rates.
At the end of the day, the dirty secret of Keynesian central banking is pretty hard to hide. What it does is cause excessive borrowing and speculation in existing housing units and other financial assets, thereby generating windfalls to existing asset holders and leveraged speculators.
Nor is the inequity of it the only flaw. Keynesian central banking has essentially turned the American middle class into debt serfs. In order to sustain their living standards in the face of relentless and persistent depreciation of the purchasing power of their money and savings, the middle class has borrowed aggressively in response to the Fed falsification of interest rates.
Index of Household Mortgage Debt Versus Wage and Salary Income, 1970 to 2023
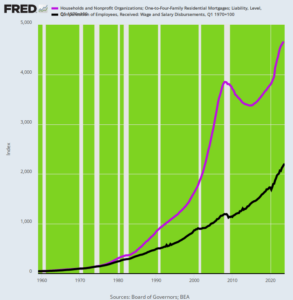
Thus, in 1970 total household mortgage debt outstanding (purple line) amounted to $278 billion, which represented just 51% of wage and salary income.
But during the next 53 years, residential mortgage debt shot the moon, reaching a staggering total of $13.0 trillion by Q3 2023. Though wage and salary income also rose considerably during that interval, the gain in income did not remotely keep up with the rise of debt.
In fact, though mortgage debt rose by 47X during that period — from $550 billion in 1970 to $11.95 trillion at present — wages rose by only 22X. Accordingly, the ratio of household mortgage debt to wage-and-salary income now stands at 108%, well more than double the 51% of early 1970.
The problem with borrowing your way to prosperity, of course, is that it eventually becomes a dead end road. First, the law of diminishing returns from borrowing sets in, and eventually debt service burdens become downright debilitating.
That’s increasingly the story with regard to household balance sheets in America, where the above depicted explosion of mortgage debt has been compounded with soaring auto, credit card, student and other consumer debt. In all, the household debt total now stands at just under $20 trillion.
Household Debt Versus Wage and Salary Income, 1970 to 2022
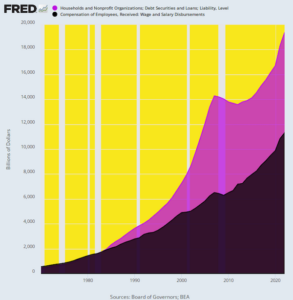
Needless to say, that represents a staggering 42X multiple of the $467 billion of total household debt (purple area) outstanding in 1970. Back then household wage and salary income (black area) stood at $560 billion, meaning that debt of all types amounted to only 83% of earnings.
By the time Greenspan took over the Fed in 1987, however, the number had already increased to 120% and has not looked back ever since. Currently (2022) household debt of $19.4 trillion represents 171% of the $11.3 trillion of wage and salary income posted.
The problem with this radical increase in the household leverage ratio (debt versus income) is that it was dishonestly foisted upon Main Street households by a faithless Fed. The Fed heads encouraged the public to believe that the completely falsified, sub-market interest rates of the past few decades were indefinitely sustainable and that the relentless rise of the household leverage ratio was nothing to sweat.
But alas, it surely is. At the present time the 300 basis points (3.00%) increase in average interest rates that has already occurred since March 2022 amounts to $600 billion of higher household interest expense, which in turn is equal to approximately 60% of current annual wage and salary growth. And that’s assuming no recession. Yet in the event of an inevitable contraction as the Fed struggles to put the inflation genie back in the bottle, the pain would be downright crushing.
On top of a $400 billion decline in wage and salary income under recessionary conditions would come another $600 billion in interest payments. In all, households are heading for a $1 trillion or more annualized shock to their living standards.
Will the Fed finally be called to account for turning the middle class into debt serfs?
Alas, this time even the sleepwalkers on both ends of the Acela Corridor may awaken to the calamity of relentless borrowing and debt that the nation’s central bank has been fostering for decades.
Editor’s Note: The truth is, we’re on the cusp of an economic crisis that could eclipse anything we’ve seen before. And most people won’t be prepared for what’s coming.
That’s exactly why bestselling author Doug Casey and his team just released a free report with all the details on how to survive an economic collapse. Click here to download the PDF now.

It is my sincere desire to provide readers of this site with the best unbiased information available, and a forum where it can be discussed openly, as our Founders intended. But it is not easy nor inexpensive to do so, especially when those who wish to prevent us from making the truth known, attack us without mercy on all fronts on a daily basis. So each time you visit the site, I would ask that you consider the value that you receive and have received from The Burning Platform and the community of which you are a vital part. I can't do it all alone, and I need your help and support to keep it alive. Please consider contributing an amount commensurate to the value that you receive from this site and community, or even by becoming a sustaining supporter through periodic contributions. [Burning Platform LLC - PO Box 1520 Kulpsville, PA 19443] or Paypal
-----------------------------------------------------
To donate via Stripe, click here.
-----------------------------------------------------
Use promo code ILMF2, and save up to 66% on all MyPillow purchases. (The Burning Platform benefits when you use this promo code.)


If you are a young man live at home save $$$$$. Once you have the down payment for a condo buy one. Rent out the extra bedrooms and the couch to roommates who have blue eyes and blonde hair.
Reap the profits wash rinse repeat. Get rich.
Fuck off, Langley.
slavery can bring prosperity… to the masters
“Why in the world would our esteemed central bankers wish to impoverish America’s workers”
lol
The issue of debt comes down to the difference in perception and reality.
In a cash market, values are based on what people can afford to pay. That is reality.
In a credit driven debt market, values are based on what people think they will be able to pay. That is perception.
The point of failure in most peoples perception, is that they tend to look at the future as linear instead of cyclical.
When you have a linear view of the future, you assume you will be making more money in the future than you are today, and so being up to your chin in debt is only an issue in the short run.
When you have a cyclical view of the future, you assume that just because the economy is good now, at some point it will turn bad and you may lose your job or have to take a pay cut. This means you need to keep debt low and have savings to fall back on in bad times.
We have not had a real economic recession now for almost 20 years, and even that one was mitigated by artificial support from the Government. Currently people are living in the fantasy of perception and not the world of reality.
Question for Stocman: agreed with your analysis, so when does the SHTF?
I’ve been waiting since 2015.
Why did you use median home prices and then average wages?