

Anyone who appears on CNBC or any of the other MSM propaganda channels and blathers about the stock market being in the early stages of a bull market is either blatantly lying or is just an ignorant motherfucker. Every historically accurate valuation method for the past century screams massive overvaluation. Warren Buffett proves himself to be a sellout shill by ignoring his own favorite valuation method – stock market capitalization to GDP. He keeps touting stocks when his own measure says stocks are overvalued by 140%.
On other measures that have an even stronger historical correlation with actual subsequent market returns than either the Shiller P/E or the S&P 500 price/operating earnings ratio, the ratio of stock market capitalization to GDP is now about 1.33, compared to a pre-bubble norm of 0.55. The S&P 500 price/revenue multiple is now about 1.80, versus a historical norm of 0.80. On the measures we find most reliably associated with actual subsequent 10-year market returns (with a correlation of about 90%), the S&P 500 is not just double, but about 120-140% above historical norms. On a broader set of reliable but more varied measures, the elevation averages about 116%.
In any event, with the current price/revenue ratio at 1.80, and market cap/GDP at 1.33, the notion that stocks are in the early phase of a secular bull market (as some Wall Street analysts have suggested) can only reflect a complete ignorance of the historical record.
The shills and shysters now attempt to discredit Nobel Prize winner Robert Shiller’s valuation method because it shows the market being overvalued by at least 100%. They tried to discredit him in 2000 when he warned about the internet bubble. They tried to discredit him in 2005 when he warned about the housing bubble. The more vociferous the attacks on reasonable truthful men, the more sure you can be that Shiller, Hussman, Grant, and Grantham are right.
The Shiller P/E (S&P 500 divided by the 10-year average of inflation-adjusted earnings) is now 27, versus a long-term historical norm of 15 prior to the late-1990’s bubble. Importantly, the profit margin embedded into the Shiller P/E is currently 6.7% versus a historical norm of just 5.4%. The implied margin is simply the denominator of the Shiller P/E divided by current S&P 500 revenues (the ratio of trailing 12-month earnings to revenues is even higher at 8.9%). As I showed in Margins, Multiples and the Iron Law of Valuation, taking this embedded margin into account significantly improves the usefulness and correlation of the Shiller P/E in explaining actual subsequent market returns. With this adjustment, the margin-adjusted Shiller P/E is now nearly 34, easily more than double its historical norm.
This fact is important, because the Shiller P/E averaged 40 during the first 9 months of 2000 as the tech bubble was peaking. But that Shiller P/E was associated with an embedded profit margin of only 5.0%. Adjusting for that embedded margin brings the margin-adjusted Shiller P/E at the 2000 peak to 37.
The next ten years are not going to be pleasant for anyone who has bought into the stocks for the long run bullshit. It is amazing how the ignorant have already forgotten two historic market collapses in the last fourteen years. If you had bought stocks in 2000 you were warned by John Hussman that stocks would provide a negative return over the next ten years. After two 50% collapses and an 80% rebound from the 2009 lows left you with a negative total return over the ten years.
Current equity valuations provide no margin of safety for long-term investors. One might as well be investing on a dare. It may seem preposterous to suggest that equities are literally more than double the level that would provide a historically adequate long-term return, but the same was true in 2000, which is why the S&P 500 experienced negative total returns over the following decade, even by 2010 after it had rebounded nearly 80% from the 2009 lows. Compared with 2000 when we estimated negative 10-year total returns for the S&P 500 even on the most optimistic assumptions, we presently estimate S&P 500 10-year nominal total returns averaging about 1.3% annually over the coming decade.
The internals of this market continue to deteriorate. Valuations are at 1929, 2000, and 2007 levels. The new highs give the ignorant a feeling of safety when they should be invoking caution and a healthy dose of fear. Wicked losses this way come.
In recent years, the persistent yield-seeking speculation encouraged by quantitative easing has weakened the overlap between these two conditions. That is, we’ve had repeated periods of severely overvalued, overbought, overbullish conditions, but they often have not been accompanied by internal deterioration or widening credit spreads. In those periods, stocks were generally resilient to significant losses. In contrast – even since 2009 – periods that have joined 1) overvalued, overbought, overbullish conditions with 2) deteriorating internals or widening credit spreads have been responsible for nearly stair-step market losses.
At present, the fact that we are highly concerned about market risk is a reflection of a market environment that joins extremely overvalued, overbought, overbullish conditions with still-troubling dispersion in market internals and a widening of credit spreads.
Absent a material improvement in market internals and credit spreads, however, that tendency is also likely to be accompanied by an abrupt vertical drop that wipes out weeks or months of market gains within a handful of sessions. It would be nice to be able to narrow down the window for that event, but that research question has always been difficult to answer. The best we can say is that going into every session here, the probability of an advance is greater than 50%, but the expected return is significantly negative. Numerous small gains, more than offset by a handful of wicked losses. That’s what I mean by unpleasant skew.
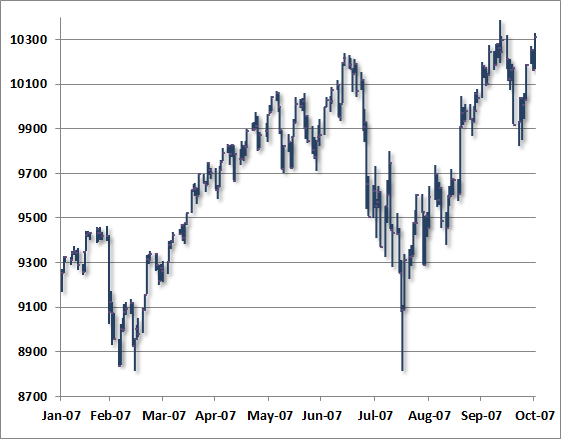
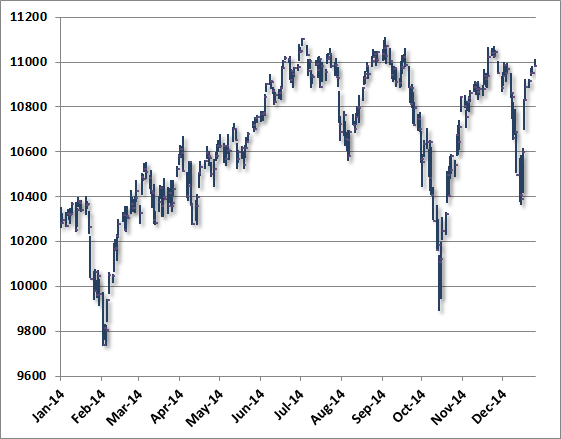
There are virtually no bears left. They have thrown in the towel. If you feel like you’ve been here before, it’s because you have. The perma-bulls were touting the marginal new highs in October 2007 after an initial plunge in July of that year. They saw blue skies ahead. What they didn’t see was a 54% plunge over the next 17 months. History doesn’t repeat, but it does rhyme. Examine the charts below closely. They are virtually identical. I wonder what will happen over the next 17 months. I can guess.
Valuations remain obscene from a historical perspective, bullish sentiment is lopsided (52.5% bulls to 15.8% bears according to Investors Intelligence), and we observe severely overbought conditions at record highs. Moreover, credit spreads have normalized only slightly, and internals have not improved enough to signal a shift from the risk-aversion that emerged a few months ago. Indeed, the day-to-day action of the broad market here looks quite a bit like the topping process that the market experienced in 2007. The chart below shows the peaking process of the New York Stock Exchange Composite Index during 2007. Note the initial selloff as market internals broke down in July of that year. See Market Internals Go Negative for my comments at the time. That initial selloff was followed by a full recovery and a persistent series of marginal new highs, a smaller selloff, and then another push higher before the market eventually rolled into a major collapse.
This bubble is no different than the prior two bubbles, and it will end the same way. Federal Reserve policies and actions have created all three bubbles. The coming tragedy is their fault. The mal-investment, fraud and subprime debt peddled to the masses was condoned and enabled by Bernanke and Yellen. The blood is on their hands. The Federal Reserve cutting interest rates didn’t stop the 1929 Crash, the 2000 Crash or the 2008 Crash. Luckily they don’t have to cut interest rates to fend off the 2015 Crash, because they are still at 0% after five years of “recovery”. Remember – Ignorance is a Choice.
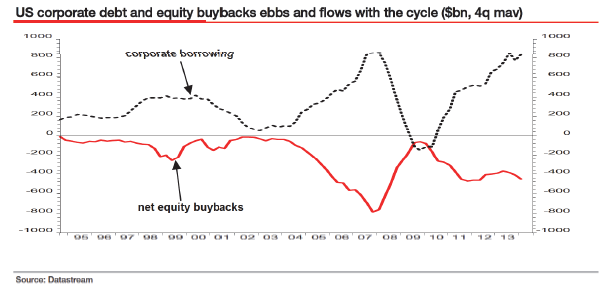
In my view, we’ve gone through an extended period of yield-seeking speculation that has encouraged the issuance of a mountain of low-quality securities to finance reckless malinvestment. In the present cycle, junk debt and covenant lite leveraged loans are the primary vehicles for garbage, but debt-financed stock repurchases (and don’t believe they aren’t debt-financed) are a close third. We’ve seen other sorry versions of this story before. We know better how to navigate the bubble portion with adequate safety nets if it continues (which we doubt it will for long), but we also know that the cycle will ultimately end in tears for the average investor. Forget the lesson three times (1929, 2000, 2007), learn it four times.
To look at the past 14 years and draw the lesson that rich valuations can be ignored (even when market internals and credit spreads are deteriorating), that hedging is a fool’s game, and that Fed easing can be relied on to drive stock prices higher, is to forget the principal lessons from the most severe market losses that the equity market has endured throughout history. What repeatedly distinguishes bubbles from the crashes is the pairing of severely overvalued, overbought, overbullish conditions with a subtle but measurable deterioration in market internals or credit spreads that conveys a shift from risk-seeking to risk-aversion.
As for monetary policy, remember that the Fed did not tighten in 1929, but instead began cutting interest rates on February 11, 1930 – nearly two and a half years before the market bottomed. The Fed cut rates on January 3, 2001 just as a two-year bear market collapse was starting, and kept cutting all the way down. The Fed cut the federal funds rate on September 18, 2007 – several weeks before the top of the market, and kept cutting all the way down. Many of the distinctions that investors believe are important are actually useless in avoiding steep market losses, and many of the distinctions that investors are ignoring at present are absolutely critical.
Read all of John Hussman’s Weekly Letter


The market and economy are finally going to sync VERY soon! Look out below & keep stackin’.
Perhaps Westcoaster, but there are some who see hyperinflation in our future, I myself think it is possible and a likely outcome of the continued printing.
Stocks could well continue rising if that were the case.
Whatever the outcome shorter term, it will be a bust for sure, sooner or later.
A lesson in fiat paper and hyperinflation would also most likely be very useful in helping restore Gold to it’s rightful place in the monetary system.
I believe the cringe worthy Politico article released a few days ago titled “Everything Is Awesome” is a sure sign of the top. The truth is always 100% the opposite of what the government media complex is peddling and it was the most over the top, rainbows and unicorns fluff piece in recent history. In the future, if there is even a modicum of academic freedom left, I believe scholars will point to that article as a sign of the collective insanity of the times. It will be marked as this century’s equivalent of Joe Kennedy’s shoe shine boy hawking stock tips.
I lean more towards the deflationary camp, first, followed by hyperinflation, all the while we get to enjoy the panic of our leaders and the demands of the people to “do something!”
Unless…….
Debt is deflationary, maybe the fuckers will create hyperinflation to stop deflation.
People love to debate back and forth what PM’s will be “worth” in paper during deflation or inflation. Who gives a shit what metal is worth in paper, to me, that’s not what holding metal is all about.
John Kenneth Galbraith: “There are far more people in the market, including mutual funds, than there is intelligence to go around.”
March 1999…
Dow 10,000 Headline: “If This Is a Bubble, It Sure Is Hard to Pop”
Dow 10,000 Headline: “Ordinary People Show Extraordinary Faith, Reaping Rich Rewards”
card802 said:
“Who gives a shit what metal is worth in paper, to me, that’s not what holding metal is all about.”
Exactly! I suspect that most TBP regulars get it but metals are just a means to protect your wealth from the destruction of paper. I used to read the comments over at SilverDoctors.com but now I just skim the headline posts for stories with merit. The comments section seemed to be dominated by those expecting to become instant millionaires when silver went to $1000/oz and gold to $20,000/oz. Same goes for the comments section of many other blogs. They could never explain why they would then trade one ounce of gold for $20,000 worthless dollars.
The reason metal has value in times like these is because paper does not have value.
This can go on for quite a while. The US prints money, Japan prints money, Bunder Bank prints money, England prints money….
Everyone buy’s one another’s debt, and then keeps refinancing it with more of their worthless paper.
It’s like taking $20 out of your left pocket, putting it in your right pocket, and telling yourself that you are $20 richer.
It will go on untill a fair alternative is put forth with the muscle to make it so. These Fascist Finaciers will make the world burn before they let it happen, a true Fourth Turning Climax. The Polarization and set up for that climax is coming into full view. Ageing Empire of Debt vs. well, Not Ageing Empire of Debt. When the world refuses to bear our debt burden, the Melinials will just have to step up and either force the World back into line or refuse to honor it as well.
Good times ahead.