WHAT RECOVERY?

Courtesy of: Visual Capitalist

9.4 Million More Americans Below Poverty Line Than Pre-Crisis

The Chart of the Week is a weekly Visual Capitalist feature on Fridays.

According to Janet Yellen, we are still on pace to raise rates in 2015. While the rate hike was supposed to happen this month, it got derailed by the August market selloff, volatility in China, lackluster work force numbers, and a variety of other factors.

Despite the Fed continuing to kick this down the road, they continue to claim that we are in the middle of an ongoing recovery. There’s just one problem with that: things are getting worse than pre-crisis levels for millions of the poorest Americans.

It’s true that the wealthiest 10% of Americans have finally seen their household incomes rise above the levels last seen in 2007. It’s also true that median incomes have “recovered” from the worst of the 2008 disaster. Median earners were -8.1% worse off in 2011, and now they are only -6.5% worse off according to most recent data for 2014 released by the U.S. Census Bureau last week.

However, when we look at the lowest 10% of income earners, the situation is much more precarious. In 2011, the bottom 10% of households were -9.0% worse off in terms of income than they were pre-crisis. Since then, it hasn’t gotten any better: they now are making -11.6% less income than they were in 2007.
Continue reading “WHAT RECOVERY?”

Disabled Recovery: Since Aug 2010, More People Have Gone On Disability Than Were Added To Labor Force

Guest Post by Anthony Sanders

The Economist blasted the following headline in February: “At last, a proper recovery.”

So, is it their considered opinion that an economy that adds more people to disability than to the labor force is having “a proper recovery?”

To be more specific, since August 2010, the US economy had added 2.96 million  to the Civilian Labor Force. But at the same time, 3.2 million were NOT in the labor force due to a disability.

disabledrec

Another troubling fact is — continued jobless claims have come down by 2.1 million since August 2010. But not in labor force with a disability rose by 3.2 million.

Continue reading “Disabled Recovery: Since Aug 2010, More People Have Gone On Disability Than Were Added To Labor Force”

RECOVERY SELFIE

“We are now in the sixth year of The Recovery™.

There really is no recovery for most people, with over half of all public school students in the US now living at the poverty level. One of the great obstacles to the recovery is that the financial elite in the US has absolutely no rational idea of the depths of the problems and issues with which they are dealing. And at the end of the day, they do not care.

They are taking selfies in the mouth of the abyss.”

Via Jesse


THE MASERATI RECOVERY

Submitted by Michael Gipp of The World Complec

How QE helped Main Street, Example 2: Maserati dealerships

I haven’t written on this topic in a long time, but it is time once again to look at the magnificent benefits that have accrued to main street businesses as a result of bailing out bad bets of banks. Today I have selected another typical main street business–the car dealership. I have randomly selected the Maserati brand as the subject of today’s investigation.

Sales data for Maserati sold in North America are available here.

Continue reading “THE MASERATI RECOVERY”

RIDICULOUS HOUSING PROPAGANDA FROM NAR & MSM

I’ve told myself to not even look at the highly manipulated statistical drivel put out by the government, corrupt organizations, and regurgitated and spun in a positive manner by the captured corporate media. Just when I thought I was out, they pull me back in.

I see Marketwatch with this blaring headline:


Existing-home sales rise 2.4% in July


They are breathlessly describing how this was better than expected, as if it proves we are in a housing recovery. Existing home sales always rise in July versus June because people need to move before school starts. This is a meaningless data point. The important data point is how it compares with the prior July. That is buried deep in the NAR press release.

Surprise, Surprise. Existing home sales FELL by 4.3% versus July of last year. That means the housing market is in decline.

Of course the scumbags at the NAR touted the 4.9% price increase over last July. They use annual data when it suits them. 

What they did not report is that home prices FELL between June and July from $223,300 to $222,900. They have been falling for months. Housing inventory grew by 3.5% over June and by 5.8% over last July. So you have declining sales and rising inventory on a year over year basis. That sure sounds like a recovery to me.

Investors still account for 29% of all sales, but that percentage is declining. The hedge funds are exiting and the flippers are panicking. Wait until prices fall another 5%. The rush for the exits will be on. First time buyers are still near historic long-term lows and will remain there for years.

Yes the MSM and the NAR are actually cheering for negative year over year sales results that put existing home sales at 1999 levels. Yippee. Let’s buy the all-time fucking high in the stock market.


ECONOMIC RECOVERY FOR THE FEW, IMPOVERISHMENT FOR THE MANY

What Disposable Income Looks Like: With And Without Government Handouts

Tyler Durden's picture

While it is now undisputed by even the Federal Reserve itself, that all the “benefits” of QE have accrued exclusively to the wealthiest segment of society, those 0.01% whose wealth is mostly invested in financial assets which have inflated in direct proportion with the Fed’s balance sheet, some have tried to suggest that because the disposable income of the average American has also increased in the past few years, then QE has been a success. There is one problem with that statement: it isn’t true.

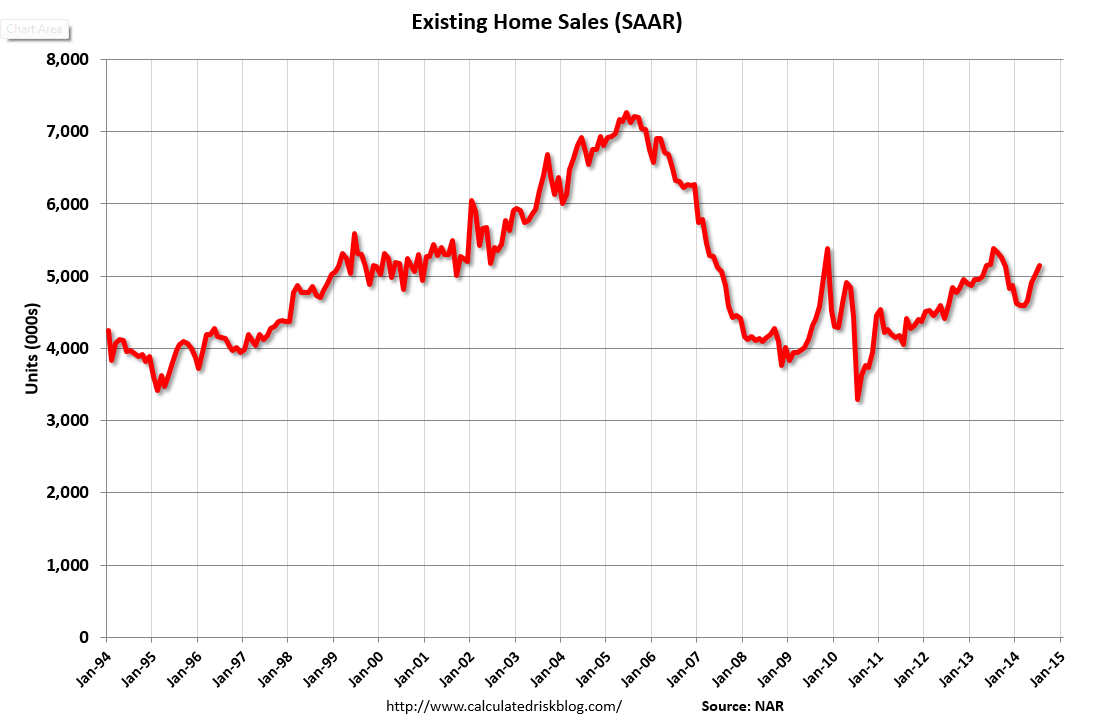
As Eric Sprott points out in his latest letter, “if one looks past headline figures, things are not really getting better. As shown in Figure 1, real disposable income per capita in the U.S. has increased only modestly since the Great Recession. However, all of this increase is due to Government Transfers, not from an improvement in the real economy. If we exclude those transfers from the numbers, disposable income per capita is actually lower than it was at the end of 2005 and has been painfully flat since 2011. Also, those numbers assume that the headline Consumer Price Index (CPI) accurately represents people’s purchasing power.”

Presenting our chart of the day: disposable income with and without government transfers.

And it is not just disposable income: as Sprott explains, “the U.S. economy has been on life support, graciously provided by Central Planners. However hard they try, they will soon realize that no amount of money printing can cleanse the rot of the U.S. economy.”

Here is why for a large portion of the population, “things are not anywhere close to being better, in fact they are worse than before the recession.”

From Eric Sprott

First of all, there is income inequality. Those in the top 20% have seen their incomes increase while those in the bottom 40% have stagnated or even decreased. Figure 2 shows the average after-tax income of U.S. households by quintiles, as measured by the Bureau of Labor Statistics’ Consumer Expenditure Survey, since 2005. It is hard to see from the chart, but in 2012 for the lowest 20% (Quintile 1) of U.S. households, the average annual after-tax income is $10,171 (up from $9,220 in 2005). Similarly, the next 20% is not much better off, with incomes averaging $27,743 (up from $25,200 in 2005). By contrast, during the same period, the average household income for the top earning quintile (Quintile 5) increased 14% to $158,024. From our calculations, the bottom 40% of the U.S. population receives approximately 12% of the nation’s after-tax income, while the highest 20% receives more than 50%. So, because of the wide disparity between U.S. households, it is grossly misleading to consider aggregate measures to assess the health of the U.S. consumer. (Note: For the rest of this analysis we combine the bottom two quintiles (bottom 40%) as they share common characteristics and it facilitates the discussion.)

Source: Bureau of Labor Statistics – Consumer Expenditure Survey

In light of these disparities and to facilitate the analysis, we have combined the two bottom quintiles’ (bottom 40% of households) incomes and expenditures for 2005 (pre-crisis) and 2012 (most recent data from the Bureau of Labour Statistics). Data is presented in Figure 3.

The first panel of Figure 3 shows after tax income for the bottom 40% of households in 2005 and 2012, along with a breakdown of some of its components. All figures are in current dollars (i.e. not adjusted for inflation). Not too surprisingly, average after-tax annual household income increased by a meagre 8%, from $17,463 to $18,844. Wages and salaries, which represent about half of income, increased only 4%. Most of the increase has been in the form of government transfers; social security increased 14%, unemployment and veteran benefits 102% and other forms of public assistance 40%. In fact, of the $1,380 increase in average after-tax income, 93% comes from increases in government transfers.

Source: Consumer Expenditure Survey, 2012, 2005 & Sprott Calculations

The second and third panels of Figure 3 show average annual expenses in dollars as well as in percent of after tax income. We also show a breakdown of spending for categories that we consider “non-discretionary”, in the sense that they are unavoidable expenses such as food, shelter, utilities, health care and transportation. Perhaps the most striking (but not that surprising) finding from that table is the fact that 40% of U.S. households spend about 40% more than they make (138% and 145% in 2005 and 2012, respectively)! In case you wonder how a household can spend more than it earns, there are many ways such as: borrowing, selling assets, assistance from family, etc. While incomes increased only 8%, total expenses increased 14%, driven by very large increases in shelter (22%) and health care (18%) spending.

Additionally, an ever increasing proportion of people’s after tax income goes towards what we call “non-discretionary spending”. As shown at the bottom of Figure 3, in 2005 those households used to spend 97% of their income for basic necessities, while in 2012 this has increased to 104%.

Five years into this so-called economic recovery, on average 40% of the poorest U.S. households still spend more than they earn (including government transfers) for basic necessities!

We believe that there are two main reasons for this. The first one has to do with income inequality; as we have shown, incomes have been almost constant since 2005, with most of the increase driven by unsustainable governmental assistance. Furthermore, prices for basic necessities, which constitute the entirety of these households’ budgets, have been increasing at a steady pace. Figure 4 shows the reported price over the past 7 years for energy, food commodities and rents against the “Official” Headline Consumer Price Index (CPI).

Over that period, overall price levels, as measured by the CPI, went up 22% (versus 8% for after tax incomes). However, for the same period, rent, energy and food prices increased 26%, 54% and 115%, respectively. No wonder those same households spend 33% of their income on shelter, 21% on food and 14% on utilities and fuels!

Source: Bloomberg, Sprott Calculations

How can we have an economic recovery when there is barely any discretionary disposable income for 40% of the population? As we have shown above, those that have seen their incomes grow and not the ones most likely to spend, while the bottom 40% of households still rely heavily on government assistance, have had stagnant incomes and have been faced with increasing inflation for “non-discretionary” goods that constitute a very large share of their incomes.

There is clearly no recovery…

WARM WEATHER DOES WONDERS FOR HOUSING IN JUNE

Remember the cold and snowy winter? It was used as the excuse for every negative economic report over the last six months. It’s now July. If housing starts were delayed due to bad weather, there should have been a strong bounce back in the Spring and Summer. Plus, this is when people buy and sell houses because they don’t like to move when their kids are in school. Maybe it was too warm. Maybe it was too sunny. Maybe the corporate MSM propaganda machine has to come up with a new storyline to feed the ignorant masses.

The June figures were released today and they show a collapse in housing starts and permits. Housing starts were 13% BELOW the expectations of the millionaire Wall Street economists. They were 9.3% BELOW the DOWNWARDLY REVISED May numbers. The single family home starts were the lowest since November 2012. April was revised lower too.

So let me get this straight. Home prices have risen 25% since 2012, but housing starts are exactly where they were in 2012. Yeah, this is a strong healthy market driven housing recovery. No Federal Reserve/Wall Street scheme to enrich the oligarchs here. This surely benefits first time home buyers with trillions in student loan debt.

Please show me the housing recovery on this chart. The current level of single family housing starts is at the same or lower levels of every recession dating back 45 years. They are 65% below the most recent peak. They are 50% below the long term average. With the lowest mortgage rates in 50 years, this is all we got?

The housing market is rolling over and headed down again. Any dupe that got lured into buying a home in the last two years is going to get it good and hard as prices tumble again. Some people never learn.