

“I feel like the problem you have is that you try to work honestly within a warped system, but in order to succeed in that system you need to have the same nature as it.” – John Hussman’s 17 year old daughter
Superstition Ain’t the Way
John P. Hussman, Ph.D.
“The problem with QE is that it works in practice but it doesn’t work in theory.”
– Ben Bernanke, Former Federal Reserve Chairman, January 16, 2014
“When you believe in things that you don’t understand, then you suffer. Superstition ain’t the way.”
– Stevie Wonder, Superstition, 1972
Bernanke clearly meant it as a joke, but it is also an unfortunate statement on recent monetary policy. It’s poetic that Stevie Wonder recorded Superstition in 1972, just before the stock market fell by half. A few weeks ago, William Dudley made the same point as Bernanke – even the Fed doesn’t quite understand how quantitative easing works. What FOMC officials are really saying is that aside from a very predictable effect on short-maturity interest rates, there is no mechanistic link between the monetary base and any other variables – financial or economic – that they are trying to control. There is a sense that creating more monetary base helps stocks advance, and that this contributes to economic confidence. What’s missing is a transmission mechanism that operates through identifiable banking and economic channels – other than promoting a speculative reach-for-yield and the psychological exuberance that accompanies a bull market.
The fact is that Treasury bond yields are above where they were when QE2 was initiated in 2010, and year-over-year growth in employment, real GDP and real-final sales have at best done little but hover at the thresholds that have historically bordered expansion and recession. Good economic policy acts to ease constraints that are binding, and monetary policy can clearly be useful in that regard – particularly during liquidity crises when depositors are rushing for cash. At present, however, quantitative easing acts by massively loosening a constraint that is not binding at all, drowning the economy with idle bank reserves that aren’t even desired. That’s going to have negative consequences.
The chart below shows the ratio of bank reserves to the M1 money supply. We no longer live in a “fractional reserve” banking system. Nearly 100% of deposits in the U.S. banking system are now backed by idle bank reserves. Keep in mind that these reserves don’t “go into” the stock market (every buyer of stocks is matched by a seller who gets the cash). Rather, these reserves may change owners, but stay in the banking system in aggregate, depressing short-term interest rates, and resulting in a pool of zero-interest deposits that change hands from one uncomfortable holder to another.
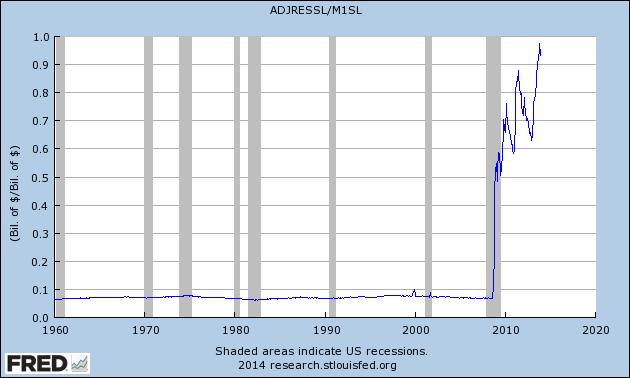
The crux of the issue is this. QE only “works” to the extent that zero-interest liquidity is treated as an undesirable “hot potato,” forcing investors to seek yield by chasing increasingly speculative assets. Having achieved that end, easy money will do nothing to support stock prices in situations where investors actually find short-term liquidity desirable, or approach speculative assets with the slightest amount of risk-aversion.
Of course, part of the impression that QE is effective also traces to misattribution: the belief that it was responsible for avoiding “global financial meltdown.” As I noted in Did Monetary Policy Cause the Recovery?:
“The novelty of quantitative easing, and the misattributed belief that monetary policy ended the banking crisis, has created financial distortions where perception-is-reality, at least for now. We believe that the modifier ‘for now’ will prove no more durable than it was during the tech bubble or the housing bubble.
“A proper understanding of the credit crisis is essential. Much of the present faith in monetary policy derives from the belief that it was the central factor in ending the banking crisis during what is often called the Great Recession. On careful analysis, however, the clearest and most immediate event that ended the banking crisis was not monetary policy, but the abandonment of mark-to-market accounting by the Financial Accounting Standards Board on March 16, 2009, in response to Congressional pressure by the House Committee on Financial Services on March 12, 2009. The change to the accounting rule FAS 157 removed the risk of widespread bank insolvency by eliminating the need for banks to make their losses transparent. No mark-to-market losses, no need for added capital, no need for regulatory intervention, recievership, or even bailouts. Misattributing the recovery to monetary policy has contributed to a faith in its effectiveness that cannot even withstand scrutiny of the 2000-2002 and 2007-2009 recessions, and the accompanying market plunges. This faith is already wavering, but the loss of this faith will be one of the most painful aspects of the completion of the present market cycle.”
On Valuation
Ben Bernanke asserted last week that market valuations seem to be within historical ranges at the moment – which is true, if you take price/earnings ratios wholly at face value, with no adjustment for profit margins, and no consideration of the fact that stocks are long-lived claims on future cash flows. The problem here, as I detailed in An Open Letter to the FOMC: Recognizing the Valuation Bubble in Equities, is that the “equity risk premium” models embraced by Bernanke, Yellen and Greenspan are terribly unreliable compared with methods that account for the cyclical variation in profit margins. The fact is that even if year-to-year earnings are volatile, the discounted value of a long-term stream of those cash flows is very smooth. As a result, the most reliable valuation measures generally have a very smooth denominator. That’s why a dozen alternative measures are far better correlated with actual subsequent total returns (these include market cap/GDP, price/revenue, cyclically-adjusted P/E, price-to-record earnings, and others).
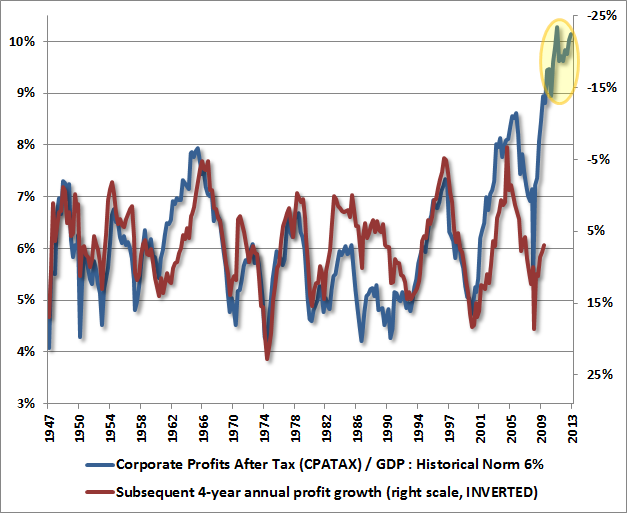
If one examines the errors of the Fed-embraced “equity risk premium” models, one immediately finds that those errors are highly (negatively) correlated with the level of profit margins. In other words, the higher profit margins are at any point in time, the worse actual subsequent market returns tend to be, compared with the returns implied by those models. That’s not a surprise. If you take cyclically elevated profit margins at face value, you’re going to overpay. This is the principal reason that the Fed overlooks valuation risks here.
The chart below shows corporate profits as a share of GDP, with a reminder of how elevated levels relate to subsequent profit growth. I can’t emphasize enough that the issue is not what happens to profits over just the next 4 years, however. The issue is whether current profit margins are representative of what investors should expect for the next 50 years. More on that below.
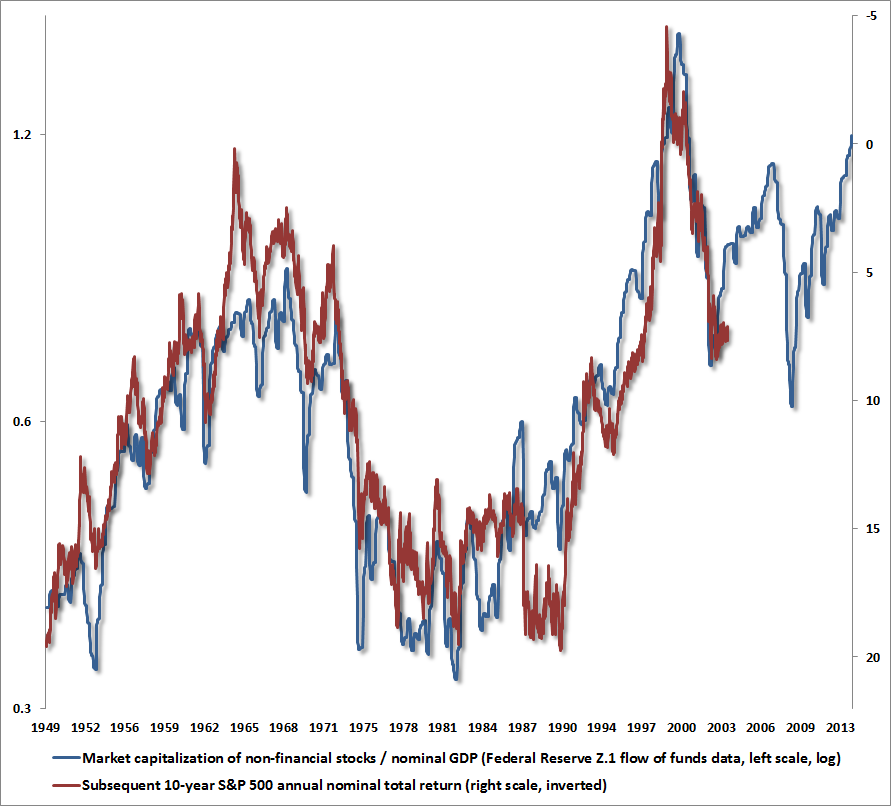
Past weekly comments have presented numerous valuation models that all have a roughly 90% correlation with actual subsequent 10-year market returns, based on properly normalized earnings, forward earnings, dividends, revenues, and so forth. All provide a uniform message:
We currently estimate a negative prospective return of the S&P 500 for all horizons of less than 7 years, with prospective nominal total returns most probably within the range of 0-3% over the coming decade. Notably, these estimates draw from the same valuation methods that – in real time – correctly warned of negative 10-year returns in 2000, defended us against the bulk of the 2007-2009 collapse, and estimated positive 10-year prospective returns in the 10-14% range in early 2009 (our stress-testing response at the time was emphatically not driven by valuation concerns). At an index level, the S&P 500 is richer than it was in 1937, 1972 and 1987. Valuations are similar to those at the 2007 peak and all but the final weeks of the 1929 peak. Index valuations are clearly less extreme than in 2000, but even so, the overvaluation of the median stock has never been greater than at present.
Suppose you own a security that promises a $100 payment, 7 years from today. Your expected return on that security over the next 7 years depends on the current price. If people are paying more than $100 today for that $100 in the future, everyone holding that security may feel “wealthier” in the sense that current prices are high, but those current prices have also “eaten” the future return. In other words, the “wealth effect” of higher current prices comes at the cost of dismal future returns. As the 2000-2002 and 2007-2009 plunges should have made clear, once asset prices become richly valued relative to their properly discounted stream of future cash flows, the piper must be paid.
Criticize me for missed returns from my insistence on stress-testing our estimation methods against Depression-era data in 2009 – despite the fact that our existing methods had performed admirably. Criticize my refusal to believe that “this time is different” in the face of a syndrome of overvalued, overbought, overbullish, rising-yield conditions that have previously appeared exclusively at the 1929, 1972, 1987, 2000 and 2007 peaks. But don’t imagine that there is actually a mechanistic cause-and-effect relationship that links QE to stock prices. Don’t imagine that 7-10 year total returns for the market will be much better than zero, or assume that objective data can be discarded because of our stress-testing miss or the deferred market response to untenably exuberant market conditions. I expect that this will end badly, and there will be far better opportunities to accept risk for those who consider themselves disciplined investors rather than speculative lemmings who again squeak that “this time is different.”
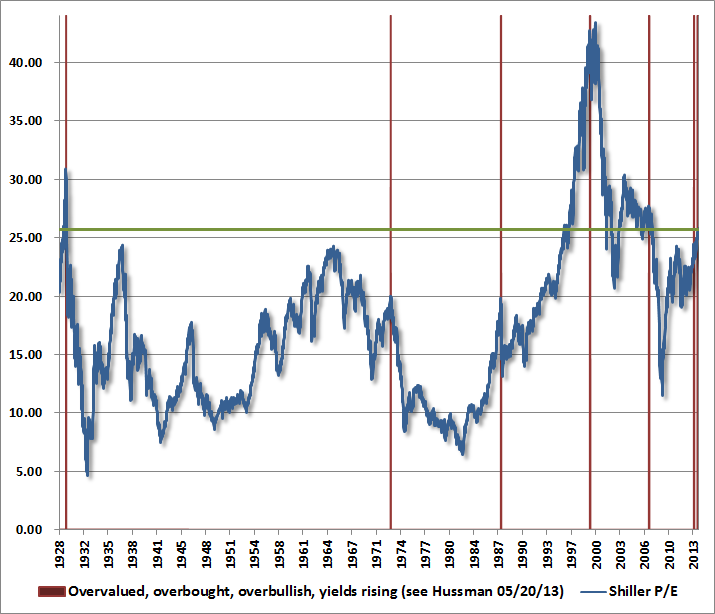
A quick note on the Shiller P/E (the S&P 500 divided by the ratio of 10-year inflation-adjusted earnings). I’ve noted elsewhere that the reliability of this measure is enhanced by also adjusting it for the level of embedded profit margins, as even 10-year averaging doesn’t wipe out the effect of margin variations (see the final chart in Does the CAPE Still Work?). As a technical note, investors should be aware that S&P 500 index earnings declined by about 80% from 1916 to 1921, which has the effect of boosting the Shiller calculation in 1929 with a far greater impact than the very brief earnings declines of the past decade have done. None of our valuation arguments rely on the Shiller P/E, and several metrics are much more reliable (price/revenue being just one), but it’s a convenient measure because it’s readily available. Our own calculations prefer geometric 10-year smoothing to arithmetic, both because it performs better – particularly in post-Depression data – and it’s more sensible than discrete cut-offs for most applications.
Suffice it to say that even on the Shiller P/E, we’ve never seen higher valuations outside of a handful of weeks in 1929 and the period since the late-1990’s bubble. It bears repeating that the 2000-2002 decline wiped out the entire total return of the S&P 500 – in excess of Treasury bill returns – all the way back to May 2006. The 2007-2009 decline wiped out the entire total return of the S&P 500 – in excess of Treasury bill returns – all the way back to June 1995. Even if valuations were to move higher, there is little likelihood that investors will retain any of it. Combine similar valuations (even 30% lower than present levels) with lopsided bullish sentiment, steeply overbought prices, and upward pressure on Treasury yields, and one captures the most memorable market peaks in history. The red bars on the graph below identify other instances where we’ve observed similar overvalued, overbought, overbullish, rising-yield conditions. The green line shows the present level of the Shiller P/E.
My 17-year old daughter made an interesting comment the other day – “I feel like the problem you have is that you try to work honestly within a warped system, but in order to succeed in that system you need to have the same nature as it.” It’s certainly true that the Fed has encouraged reckless behavior and punished historically-informed investors for not going along. Fiduciary behavior is unrewarding here, and as a result, there is likely less of it. But we continue to patiently adhere to our discipline – confident in how our present methods would have performed in this and prior cycles across history in the absence of our awkward stress-testing transition earlier in this cycle.
My impression is that while recent Fed-induced market distortions are well-intended, they lack an adequate grasp of market history, valuation, and consequence. At least over the past couple of years, it’s probably also true that to succeed in this speculative episode has required investors to share that same nature. But over the longer run, market returns turn out to be quite obedient to valuation and historically-informed discipline (as was clearly demonstrated in 2000-2002 and 2007-2009), and I expect that the most durable investment gains will be achieved by sharing that more durable nature.
Regardless of my objections to the course of monetary policy, I think the Fed’s intentions are good, and I share Janet Yellen’s concern for the unemployed. I just believe that there is no demonstrable mechanism that reliably links the actions of the Fed to the outcomes it seeks, and that the unintended effects are greatly underestimated. If there is any lesson to be learned from the past 15 years, it is that the U.S. economy is desperate for scarce savings to be allocated toward productive investment and job creation, and that the economy is enduringly harmed by policies that divert investment activity toward speculative revelry. The impulse to address the collapse of one cyclical distortion through the creation of yet another has the consequence of structurally undermining the economy for a far longer period.
Meanwhile, there is unavoidable damage that is now baked into the cake, because FOMC members seem to be gauging stock valuations only in reference to current earnings without considering the effect of any normalization of profit margins – even decades from now. It’s an unfortunate situation, but unfortunate mainly because we’ve seen it before – nearly always at market peaks that we label, in hindsight, as reckless speculative carnivals. With the Fed now leveraged 74 times against its stated capital, and bond yields above the weighted average at which the Fed accumulated its assets (implying significant capital losses already), the Fed is late but correct to conclude that it has done more than enough.
A Note on Equity Durations
It’s particularly worth observing, in advance, that combination of a very long duration and a very low implied long-term rate of return on stocks creates a powder keg of severe risk and poor expected return here. The duration of the S&P 500 Index – a measure of both investment horizon and price sensitivity – is presently 50 years. Regardless of growth rates, one can demonstrate that if dividends are at least relatively smooth, the duration of stocks works out algebraically to be roughly the price/dividend ratio. For an extensive discussion of this concept, see Buy-and-Hold For the Duration?
Stocks are a claim on a very long-term stream of cash flows. Current earnings, reflecting profit margins about 80% above the historical norm, are not a useful sufficient statistic for those cash flows. Investors (or FOMC officials) who take them at face value must effectively assume that profit margins will remain at these extremes not just for a year or two, but for about five decades. Emphatically, durations rise with valuations, meaning that as stocks or bonds become more richly priced, they also become riskier and longer-term investments from a present-value standpoint.
For passive buy-and-hold investors who don’t hold any particular view about market direction, the general rule in financial planning is to align the duration of your assets with the duration of your liabilities (the horizon over which you’ll spend). For example, an investor that expects to start drawing from a retirement account 10 years from now, and then spend down the assets over the following 20-25 years, has an effective duration of something close to 20 years overall. A passive investor would target a similar portfolio duration. Given that stocks have a duration of about 50 years and 10-year bonds have a duration of about 9 years here, one could achieve a duration of about 20 years with a portfolio equally weighted between stocks, bonds and cash. Of course, our estimate is that the 10-year prospective return on such a portfolio is likely to be less than 2% annually, and we strongly believe that opportunities to achieve higher prospective returns at controlled durations will emerge over the course of the present market cycle. So our own preference is to align our durations more strategically, by extending them in response to high return/risk prospects and shortening them when – as we presently observe – return/risk prospects are dismal.
Low market durations are associated not only with high prospective returns, but also make equities appropriate for a larger fraction of a portfolio. The duration of the S&P 500 Index was just 7 years at the trough of the Depression in 1932, followed by market returns of about 34% annually over the next 5 years before overvalued, overbought, overbullish conditions (less extreme than today) prompted another plunge; the duration was 10 years in 1917, followed by market returns over 20% annually in the 12 years that led up to the 1929 crash; and the duration was 16 years at the 1982 trough, when the market returned 19% annually over the 18 years that preceded the 2000 peak.
In contrast, high market durations are associated with lower prospective returns, and also make equities appropriate for a smaller fraction of a portfolio. The duration of the S&P 500 was 33 years at the 1929 pre-crash peak; 37 years in January 1973, just before stocks lost half their value; 38 years at the August 1987 peak; 90 years at the 2000 peak, from which the S&P 500 has – even now – seen annual total returns averaging little more than 3% (with the likelihood of still another decade of similarly low returns); and 58 years at the 2007 peak. Again, the duration of the S&P 500 is presently 50 years – about double its historical average.
If you wonder why bear markets seem to be more severe since 2000 than in the past, it is because the high duration implies enormously larger price impact in response to increases in required risk premiums and expected returns. Risk premiums (estimated not using single-year earnings but far more reliable cyclically-adjusted methods) are now thinner than at any time other than the final advance to the 2000 peak, and about the same as they were in 1929 and 2007. The sensitivity of stock prices to any increase in required return is likely to be similarly breathtaking.
In honor and remembrance of Dr. Martin Luther King, Jr.
Dr. King noted that he tried to speak on the subject below at least once a year. That still seems an appropriate way to honor him. If you’ve never read Dr. King’s writings, this talk is a good place to start.


Where do I put a large 5-figure amount that I:
-don’t want to speculate with in the stock market,
-don’t want to risk being confiscated/nationaled/bailed-in with a normal bank account,
-don’t want to lose to a sudden bout of inflation?
Is there anywhere? I want it to be liquid enough to use, without much transaction fees… that rules out physical PM. But both the stock market and ordinary banks look pretty iffy right now.
Under your mattress.
Mattress Safe
Sounds like looting a burning depratmnent store about to collapse… you may get out with
the LCD TV and the Kitchenaid blender, but the roof will cave while your grabbing
the microwave oven…
high frequency trading has totally destoryed the market for everyone but insiders..
only S&P shorts and commodities are safe now… the commodity supercycle is
overdue, it will arrive violently.
You guys aren’t being very helpful.
Of course I expect nothing less from TBP. At least no one has proposed a phone booth / mountain lion / cattle fencing tryst, yet.
Persnickety
I wish I had good advice that I was sure about. I think staying as liquid as possible is the best advice when stocks, bonds, and real estate are all extremely overvalued.
Thanks, Jim. I know it’s not easy – if it were I would already “know” what to invest in.
Let me refine it a bit – if I want to be super liquid and avoid market risk as much as I can, but also avoid bank bail-in risk, are there other financial products worth considering – like money market mutual funds, or anything similar? In Ye Olden Tymes I would think about opening an account with a Canadian bank (since they seem to have a healthier banking sector), but thanks to FATCA and other things, US citizens are lepers when it comes to opening bank accounts outside the US. Just looking for any good ideas, not endorsed by Cramer.
I do think credit unions are somewhat safer than banks. With a credit union you are a member. The $250,000 FDIC limit applies. It’s not entirely safe, but in my opinion it’s better than JP Morgan or Citi.
A safe in your home is another option.