

Here come the headlines from the corporate MSM spouting about the strong jobs growth reported by the drones at the BLS this morning. Here is the meme for today:
U.S. surpasses 2008 peak in employment
You will see and hear this all day long. It’s a lie. A quick perusal of the BLS website will show that the number of employed Americans in 2007 surpassed 146 million. The number of employed Americans today totals 145.8 million. But who cares about facts or the truth when you have a recovery story to sell? The sheep must be kept calm for the fleecing to continue.
The faux financial journalists will leave out the FACT that there were 232 million working age Americans when the number of employed reached 146 million. There are now 248 million working age Americans. So we have sixteen MILLION more people who are capable of working and the the same number of working Americans. This is truly a success story to be shouted from the highest mountaintop. The teleprompter in chief should give a rousing speech on the White House lawn to take credit for this miraculous accomplishment.
Let’s dig into some of the details of this putrid propaganda report:
- The headlines blare that 217,000 new jobs were created, while ignoring the much broader survey that shows only 145,000 more people employed. The number of men over the age of 20 who are employed FELL in May and is now 100,000 lower than it was in March.
- The wonderful Birth Death Adjustment, which supposedly estimates the number of jobs created by small businesses, added 205,000 jobs to the calculation after adding 234,000 phantom jobs last month. This is nothing but a wild assed uneducated excel spreadsheet guess by a bunch of government drones in Washington DC. Do you really believe small businesses are hiring that many employees as their sales decline, energy costs rise, and Obamacare mandates crush them? Really?
- The number of people not in the labor force remains at an all-time high of 92 million. And don’t blame it on retiring boomers. The percentage of people over 55 working is at an all-time high.

- The percentage of people in the labor force remains at a 36 year low. Who needs a job anyway?

- The fantastic 217,000 growth in jobs was mostly burger flippers, bed pan emptiers, government assistance purveyors, and the tried and true temp worker. There were 55,000 jobs added in health and social services, 32,000 restaurant workers, and 14,000 temp workers. These jobs pay shit wages. There were exactly ZERO jobs added in the high paying manufacturing industry. And now with the implosion of retailers there was NO new hiring in the retail industry. It will be shedding jobs for years.
- You’ll be thrilled to know that average wages are up a whole 2% in the last year. Your daily living expenses are up 5% or more while your wages stagnate. And corporate profits are at all-time highs. That’s called WINNING!!!!
So the MSM and the Obama minions will try to make this pile of shit seem like a pile of gold. It’s just more BS on our road to serfdom.
We don’t need no stinking wage increases!!!!


” …. the FACT that there were 232 working age Americans when the number of employed reached 146 million. ” ————- Admin’s comment
Only 232 working age Americans.
Damn, that brutal! I bet they got a lot of overtime, though.
2014-06-06 08:00 by Karl Denninger
Payroll Report: +217k (Meh)
From the Bureau of Lies and Scams:
Total nonfarm payroll employment rose by 217,000 in May, and the unemployment rate was unchanged at 6.3 percent, the U.S. Bureau of Labor Statistics reported today. Employment increased in professional and business services, health care and social assistance, food services and drinking places, and transportation and warehousing.
The initial futures response was muted but positive. Is that warranted?
First, leisure and hospitality is where the “best” gains have come. That’s code for waitresses and dishwashers, and while they’re important they’re also low-wage, low (or no) benefit positions.
Indeed 311,000 people were added to “food service and drinking establishments” over the last year, or so the BLS claims. That’s an utterly-stunning 16% of all jobs added over the last 12 months — or three times the rate of adds to manufacturing.
Meh. The annualized change is right near 2 million, which sounds good except — it’s not. Why not? Because despite the incessant lie that “all the seniors are rolling off the workforce” we in fact are making more new entrants to the workforce (that’s the product of two people screwing, if you’re curious) than there are old farts leaving it due to age.
Unfortunately the “gain rate” is lower for jobs than for working-age people.
In an interesting aside this month we had (on a monthly basis) nearly a million people come back into the workforce. The bad news is that on an annualized basis the rate went the other way. That nasty elevation of people giving up that began in 2008 has not reversed.
When you take the top line number and adjust for population the problem is apparent — we’re losing ground. Not by a lot, but negative is negative. This is the unfortunate reality over the last 15 years — even during the “go go” period from 2004-2007 there were only a few months where we made progress in that regard.
You cannot consider the job market “healthy” on this basis — nor could you do so over the last decade and more when one looks at it in terms of working-age people. This, of course, is not brought up on TeeVee lest it cause people to realize that the so-called “markets” are nothing other than a computer game these days.
Finally, my “US employment in one chart” shows that while the labor/population ratio ticked up a bit the “official” unemployment rate did not move at all. Then again through July of each year this rate tends to tick up a bit, only to decline after July. It’s called summer, and the low-wage summer jobs do dent the negative participation ratio — a bit. Fro perspective the 59.1% is 2 ticks above where it was last year, so credit where credit is due.
But until that chart truly breaks out I remain unimpressed.
One interesting sub-table that I think sums things up pretty well is found in the household data “A” table; those with less than a high school diploma have been their situation improve materially over the last 12 months, with unemployment down from 11% to 9.1%. If you have a high school diploma, it’s down from 7.4 to 6.5%, or about half that improvement. And while college graduates are much-less likely to be unemployed they dropped in unemployment rate from 3.8% to 3.2%.
You might try to surmise from this that being a college grad is tremendously good when it comes to employment prospects. Unfortunately it’s not that simple, because if you’re a college grad but have $100,000 worth of student loans and the job growth is all in “leisure and hospitality” (and it is) may I politely inquire whether you’re better off going backward while pulling coffees at Starbucks or whether you’d be better off going nowhere while sunning yourself on the beach?
If you’re going to be broke, in short, why in the hell would you work at it?
No Stucky, no overtime, just a lot of unpaid hours working for the company store. John
Stuck
Whatever do you mean?
BM
How I feel as I write these posts.
[img [/img]
HOW CAN THE BLS BE REPORTING NEW JOBS IN FINANCIAL SERVICES IF WALL STREET IS FIRING STAFF? INQUIRING MINDS WANT TO KNOW.
Banks shed jobs as fixed-income revenue shrinks
By Sital S. Patel, MarketWatch
NEW YORK (MarketWatch) – Revenue from the once lucrative fixed-income trading business has fallen sharply in recent years and analysts say it will never recover to its peak levels.
“The market has permanently shrunk,” said Gerard Cassidy, analyst at RBC Capital Markets.
In the first quarter of 2014, major banks generated revenue from fixed income, currencies and commodities, known by the acronym FICC, of $22 billion, down 37% from the $35 billion generated in the same quarter of 2010, according to research firm Coalition.
Revenue from FICC accounted for 50% of total revenue in the quarter, down from 63.5% in the first quarter of 2010, according to Coalition.
There are two main reasons for the slump. First, the regulatory regime that has been put in place since the 2007-8 crisis has brought major changes to how banks do business. Tougher capital requirements have significantly eroded profit in business areas such as FICC and forced executives to make tough decisions on capital deployment.
The changes have come at a time when central banks keen to boost sagging economies have kept interest rates at ultra-low levels. That, in turn, has reduced volatility and made it much harder to make money from what used to be the most profitable trading segment.
“Interest rates have been much less volatile the past two years,” said David Hilder, analyst at Drexel Hamilton. “Once the euro crisis cooled, all the world’s major central banks decided to keep rates lower for longer to try to stimulate economic growth.”
But even if economies eventually get back on track, bankers are expecting the downward trend in FICC to continue.
J.P. Morgan Chase & Co.’s (NYSE:JPM) has already told investors it expects second-quarter trading revenue to fall as much as 20%, after a 17% slump in the first quarter.
Citigroup Inc. (NYSE:C) is expecting a second-quarter decline of 20% to 25%, after a decline of 18% in the first-quarter. Chief Financial Officer John Gerspach recently forecast a 5% to 10% slump for the year.
It’s no surprise then that banks are reacting to the new environment by cutting back, shedding staff and redirecting capital to other business lines.
The cutbacks have been most dramatic at European banks, which are grappling with additional capital requirements under new U.S. rules regarding the capitalization of local subsidiaries.
UBS AG (NYSE:UBS) , Credit Suisse AG (NYSE:CS) and Barclays Plc (NYSE:BCS) have all announced drastic measures to reduce their FICC business.
UBS said last fall it would cut 10,000 jobs and shut most of its fixed income business to refocus on its less capital-intensive wealth management business. The Swiss bank saw FICC revenue drop 38% in the first-quarter of this year.
Barclays reported a 41% drop in first-quarter in FICC revenue and said it would create a “bad-bank” division consisting of 115 billion pounds ($195 billion) of risk-weighted assets. These will include its European retail-banking assets and some parts of the investment bank, such as nonstandard fixed-income derivatives, physical commodities and emerging markets products. The bank is planning to cut a total of 19,000 jobs in the next three years, including 7,000 positions at the investment bank.
Credit Suisse said FICC revenue fell 21% in the first-quarter compared to the same period a year earlier.The firm has made aggressive cuts to shrink the bank and reduce risk following pressure from regulators. (The Swiss bank’s trading problems have been overshadowed by its recent $2.5 billion settlement with the U.S. government for allegedly helping Americans evade taxes.)
“What these companies have decided to do, some more dramatic more than others, is restructure their business,” said RBC’s Cassidy.
“You just have to manage your business differently by realigning your cost structure to the new level of revenues due to the changes form rules, regulations and laws.”
The big U.S. players seem to be coming to terms with the new world and making the best of it.
At a recent conference, Bank of America Corp. (NYSE:BAC) CEO Brian Moynihan acknowledged the industry slowdown but said, “we can make money at that level.”
Goldman Sachs president Gary Cohn said the current economic environment is more significant than any business slowdown.
“When things are tough, people think the markets will never get good again,” he told the same conference, insisting that is not the case.
His comments echoed those of Goldman CEO Lloyd Blankfein, who said in an interview earlier this month that after being in the industry for 30 years, it’s tough to say something is not working after a few years of weakness.
Goldman reported a 13% decline in FICC revenues for the first quarter, a smaller decline than analysts were expecting. On its earnings call, Chief Financial Officer Harvey Schwartz said diversity was the key in FICC trading.
“Despite market headwinds, our performance within FICC demonstrated the benefits of offers to our clients of a diversified product suite meeting needs across rates, credit, currencies, mortgages and commodities,” he said.
Another pack of lies. All those college graduates that are $30,000 in debt are getting “leisure” and service jobs, the same jobs they had in college in the summer. Since 2007, 12.8 million people have left the workforce. 20 years ago, I don’t remember the government reporting the “left the workforce” numbers. It’s the 500lb gorilla in the room, that nobody ever talks about, that makes the BLS numbers utter bullshit. It’s more propaganda from the fascists running this country. Nobody even watches the news or CNBC anymore, except old boomers counting their winnings in the stock market, winnings soon to vaporize when the whole charade comes crashing down from reality.
19% of all jobs are part-time and another 9% are self employed.
[img [/img]
Hmmm….
Not in labor force: 92 million
on welfare: 100 million
on disability: 10 million
That’s 202 million, not including SS retirees, union government drone retirees, military retirees, and only 118 million have full time jobs. There are also more retirees/welfare/SS/disability than people that have jobs and pay taxes. How much longer can this charade go on?
AWD,
It will go on until it doesn’t. When our reserve currency dies, our standard of living dies. Remember when the USSR died, it was quite sudden. Emlpires are expensive to maintain. This country is running on fumes, hopum, and doing lots of really stupid things. I may not see the end due to my age, and I think you will see the reset button pushed. It will be ugly.
Welshman
Don’t forget we’re $17.5 trillion in debt, $59 trillion public/private debt.
The whole birth-death scheme is a license to lie and manipulate, one of the few things the government actually excels at. The surprising aspect of their statistics is that any thinking human being would believe any of it.
People are taking out “home equity loans” in record numbers again, using their house as an ATM, and are running up their credit cards again, the most since 2007. Turning to more debt just to survive in Obama’s economic catastrophe.
Consumer Credit Has Fifth Biggest Monthly Jump In History; Revolving Credit Soars By Most Since November 2007
Submitted by Tyler Durden on 06/06/2014 – 15:23
A month ago we pointed out that with April US consumer savings plunging to levels not seen since Lehman, the only place where the tapped out consumer could find some purchasing power is by maxing out their credit cards. This is precisely what happened: moments ago the Fed released its April consumer credit report and it was a doozy: expected to print at $15.00 billion, down from a pre-revision $17.5 billion, the April total instead exploded to a whopping $26.85 billion. This was the fifth biggest surge in history, and was only surpassed by the 2010 “cash for clunkers” record, as well as previous one time outliers in 1998, 2001, and 2006.
Hooray, the stock market is making another new record!
[img [/img]
Adjusted for seasonality, the labor force participation rate (LFR) has never increased — not once — under Obama! Normalized by month, the LFR has been on a non-stop ride to progressive Utopia (i.e., full unemployment).
[img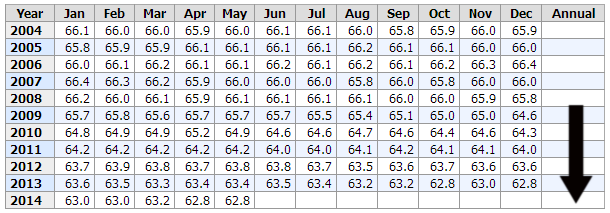 [/img]
If u want to work for $0 (volunteer) there is unlimited demand for labor.