

It’s that time of the month again, where the Bureau of Lies and Scams issues their latest manipulated, massaged, and falsified unemployment data to the willfully ignorant masses. The MSM will unquestioningly regurgitate the lies with breathless enthusiasm. The Wall Street hucksters will interpret any data as positive for the stock market.
The two headlines flashing across TV screens and websites are diametrically opposed, but none of the talking heads will reveal they can’t both be true. Here are the two headlines from Marketwatch:
U.S. economy adds 173,000 jobs in August
Unemployment rate falls to 5.1%
It is too bad that most Americans are so preoccupied with the latest App on their iGadget, frantically finalizing their fantasy football roster, or so dumbed down by our so called public education system, they have absolutely no clue that it is mathematically impossible for the REAL unemployment rate to fall when only 173,000 jobs are added. The only way this can happen is if the BLS blatantly lies and tells you that hundreds of thousands of working age Americans again decided their lives were so fulfilled and finances so solid, that they don’t want to work anymore. As we all know, this is complete and utter bullshit.
U.S. politicians and government apparatchiks are following the advice of Jean-Claude Juncker:
“When it becomes serious, you have to lie.”
Let’s dig into the BLS reported bullshit and extract some facts which will obliterate the government reported lies:
- The BLS is reporting an unemployment rate of 5.1%, the lowest since April of 2008. If the unemployment rate is really 5.1%, then why does the Federal Reserve need to keep interest rates at 0%? The Fed Discount rate in April 2008 was 2.5%. GDP was only growing at 2.0% in 2008. Today it is supposedly growing at 3.7%. The Fed would not have emergency level interest rates in place if the unemployment rate was really 5.1%.
- The Establishment Survey says we added 173,000 jobs in August. You won’t hear the bimbos on CNBC or Fox mention that the excel spreadsheet generated fake guess birth death adjustment totaled 111,000 in August. Even though we know for an absolute fact that more small businesses have been closing than opening over the last five years, the BLS continues to use historical data to pretend that small businesses are creating more jobs. The 111,000 is absolutely false. In reality, there are 50,000 or more small business jobs being destroyed each month. If the BLS was forced to be truthful, the total number of new jobs in August would be about ZERO.
- Now for the plunge in the unemployment rate. That comes from the household survey. The fact is that 220,000 more Americans entered the work force in August. According to this survey, 196,000 more Americans were employed. In the real world this would result in the unemployment rate going UP. Not in the Bizarro world of the BLS. They expect the peasants to believe that 261,000 Americans, of their own free will, voluntarily left the workforce in August because they don’t need a job to pay the bills, feed themselves, and keep a roof over their heads. The idiocy of this ridiculous assumption is breathtaking to behold. Only an Ivy League educated economist, CNBC shill, or complete and utter moron could believe this drivel.
- The government wants you to believe the economy is improving. Since January, 1.5 million Americans have supposedly dropped out of the workforce. Meanwhile, only 835,000 more Americans got jobs. But the unemployment rate has supposedly dropped from 5.7% to 5.1%. It would be hysterical if it wasn’t so sad. They are going with the Big Lie.
- The Participation rate of 62.6% is the lowest since 1977. Since December 2007, 14.9 million Americans have “willingly” left the workforce while only 4 million new jobs have been created. That’s a recovery in the oligarch books.

- Average hourly earnings rose a “fantastic” 2.2% over the last year. I’m sure the average household, experiencing inflation of 5% or more per year, are thrilled to see their wages going up by 2.2%. Wages of the 140 million non-supervisors was below 2.0%. The chart below reveals the fraud of a reported 5.1% unemployment rate. The law of supply and demand applies in all economic areas. If there really were so few unemployed people in America, wage increases would not be stagnant for the last six years. In 2007/2008 when the unemployment rate was this low, wage increases were in the 3.5% range.

- There are now 94 million Americans supposedly not in the workforce, there are another 8 million classified as unemployed. So we have 149 million employed Americans going to work to support 102 million non-working Americans, and their offspring. It’s even worse than that. Of the 149 million employed Americans, 26 million are working part-time and another 9 million are self employed (selling their old shit on Ebay). That sure sounds like a healthy prosperous economy to me.
- The breakdown of the 173,000 new jobs is even more revealing. The number of high paying goods producing jobs grew by NEGATIVE 24,000. That’s right. We don’t need to produce anything in this country. We added 164,000 low paying Obama shit jobs. We added fry cooks, housekeepers, bed pan emptiers, bartenders, social workers and government union teachers. And you will be thrilled to know there was a surge in government drone employment by 33,000. The Federal, State, and Local governments are bloated and they’re essentially bankrupt, but they keep hiring more drones to control us. Great news!!!
- Now for another smell test. The number of people on food stamps has historically been correlated to how well the economy is really doing. When the economy is improving and unemployment is low, the number of people on food stamps falls. The last time the unemployment rate was this low was April 2008. At that time there were 27 million Americans on foodstamps, costing American taxpayers $35 billion per year. Today there are 46 million Americans on foodstamps, costing American taxpayers $70 billion per year. The number of people on foodstamps has barely budged in the last four years of dramatic economic recovery and plunging unemployment rate.

The lies will continue until morale improves. At the current rate, the BLS will be reporting a 0% unemployment rate in another couple years, as 200 million Americans sit at home watching Jerry Springer and living the good life.


Greetings,
I’m ok with this as each and every lie exposes these ass clowns for what they are – ass clowns. That they report unemployment numbers at near historic lows gives everyone who pays attention to this a good laugh.
The truly tragic aspect of these reports is how The Lumpen naively buy into it: “The economy must be getting better, they just said so on TV…and they couldn’t say it if it weren’t true….” Unfortunately most people are completely clueless how these number are arrived at and more importantly, what they do and don’t tell you. A more accurate gauge of employment is the number of full-time employed versus the total number of employable persons. The BLS kicks those seeking employment but who can’t find it (“discouraged workers”) off the back of the of the job-search bus and pretends they simply don’t exist, and includes those working only part time but who want full time as though they really are full time! Ta-da! Total government bullshit. “Gee at this rate we’ll have zero unemployment and no one will be working!” Perfect!”
by Karl Denninger
Employment Report: Hmmm….
Well now…..
Total nonfarm payroll employment increased by 173,000 in August, and the unemployment rate edged down to 5.1 percent, the U.S. Bureau of Labor Statistics reported today. Job gains occurred in health care and social assistance and in financial activities. Manufacturing and mining lost jobs.
Note that 5.1% is below the “start of tightening” target for The Fed, which was 5.2.
Oops. Note that we’re still not adding enough to cover new entrants to the workforce! So where’s the “improvement” coming from in the official unemployment rate?
That’s not hard to figure out — The Not In Labor Force number went up by 1.3 million last month. At the same time the actual number of employed people, by the Household Survey, went down by 494,000.
For perspective last year this was down 618,000, so you can call that “improvement” if you’d like, and this month is one where people typically do leave the workforce (about 1.3 million left last year in August as well.)
The Labor:Population ratio ticked down by 0.3%, which again is normal for this month.
How about the internals of the report?
Last year we had gains in goods-producing employment for August. This year we lost jobs in that category across the board,, with two minor exceptions – construction which was roughly flat (compared to a robust increase last year) and automobile-related (up slightly compared to last year.) All other sub-categories were job losers.
What did gain? Service providing — specifically, health care (which is bankrupting us) and hospitality (we’ll see what next month looks like, as August is the end of the summer months of course.)
Government was also up big, compared with basically flat last year.
Weekly hours ticked up a tenth.
The troublesome pattern in who is getting hired, however, is continuing. If you have a High School diploma you gained in terms of labor participation. There was, however, no gain for those with some college or a degree.
In other words the gains continue to happen, on-balance, in lower-skilled no-degree-required positions — which are also lower paid.
In addition, and this is deeply troubling, the only group among non-disabled persons who had a participation rate increase on a comparative basis were seniors 65 and over. Non-disabled persons among both men and women younger than 65 lost jobs on a participation-rate basis.
This is why I follow TBP. You don’t get any bullshit from James Quinn. He calls them like he sees them.
Those 94,000,000 not in the work force, most are living on their private yachts, enjoying the good life.
Think of it this way: Once there are no jobs, and nobody is looking for work, we will ZERO unemployment!
I do software consulting. If someone asked, I’d say ‘for manufacturing’. Now I say ‘distribution’ – cause all these companies do is buy shit from China and resell it here.
Just read on the Drudge Report 94 + million people of working age are not in workforce. Another 8,9,or 10 million unemployed or underemployed . Who knows for sure.I can tell you as a FedEx contractor business is still good.They keep us moving. I’m in Salt Lake City right now.Plenty of loads going back east some all the way to Pennsylvania. So right now things are ok.
New Record In Waiters And Bartenders Masks First Manufacturing Drop In Over 2 Years
Submitted by Tyler Durden on 09/04/2015 11:09 -0400
In August, the reality of the oil crunch finally caught up with the BLS, when not only did the number of Mining and Logging employees decline again by 10,000 workers to 823K, the lowest since October 2011, an 8-month stretch of consecutive declines last seen during the previous recession driven by the ongoing weakness in the oil patch and the US shale drilling sector…
… but far more importantly for those tracking the US manufacturing recession, for the first time in over two years, the US manufacturing sector also lost workers, as 17,000 mfg lost their jobs. As shown in the chart below, this is the first time US manufacturing jobs have declined since July 2013, and the sudden drop means that only 28,000 manufacturing jobs have been added so far in 2015.
Considering the flurry of subprime-debt driven activity in US auto manufacturing, this was a very unexpected outcome, and those concerned that the US is about to enter, or already finds itself in, a manufacturing recession this will be the most important number in the months to come.
But don’t worry: while US manufacturing may have peaked, US waiters and bartender are more than making up for it. In August, the US service economy grew by another 26,100 waiters and bartenders, bring the total to a record 11.1 million, thanks to 207,100 “food service and drinking places” jobs added in 2015: nearly 7 times more than manufacturing workers added over this period.
Putting this all together, since the start of the Second Great Depression, the US economy has lost 1.4 million manufacturing workers, but has more than made up for this with the addition ff 1.5 million waiters and bartenders.
And there, in one chart, is your minimum-wage recovery.
@ bb, I also watch the trucking, rail and airline cargo tonnage…they seem a good barometer of where the economy stands and to some where it’s headed.
If everyone is employed why are retail sales in the shitter? Curious minds want to know.
BLS
Bullshit Lies & Stuff.
Ain’t it the truth.
I work in manufacturing . This shit is tanking,at least in our company. Cut 10% blue collar last fall and they shitcanned another 10% last week(mostly high seniority or insurance users). No raises in 2 years(1% would be usual) , raping people on insurance ,bonuses HA!. Even the rats are starting to jump ship.
I get in the truck for they ride home today and sure enough .Its all sunshine and roses according to Npr, another great BS report.
I listen to Wyoming public radio all day.
You will understand what Milton Friedman said long ago about the importance of a free press if you did to.
The government soft soaps people most of the day with pop music and gives them bullshit all day how well everything is doing.
You get the other side . But the other side will never listen or be informed about your side. Try listening to public radio some time.
Word got around that the sodomite negro said jobs are being created. So they went and created figures that show jobs are being created, just like what the sodomite negro told them!
1) “Official” Labor force = 157M
2) Unemployed not counted in labor force = 94M
3) “Official” unemployed = 8.2M
“Official” unemployment rate (3/1) = 5.2%
4) Real labor force (1 + 2) = 251M
5) Real unemployed (2 + 3) = 102.2M
6) Real unemployment (5/4) = 40.7%
They are following the Keynesian Playbook. Lie and Talk up the Economy even though what they say is the exact opposite. They have hidden the soup lines during this Depression by handing out EBT cards, which get used just like a credit or debit card. I know people on SSD that get free healthcare, food-stamps, etc and they all they do is play tennis all day. When my wife was on unemployment we got bombarded with phone calls and mailings telling us to sign up for food-stamps, the marketing was unbelievable. I have rental properties, when I look for a tenant, the number of people that come with Housing Vouchers, Welfare and other Government handouts (which legally I have to consider as income) is unbelievable! The amount these people get from the government for doing tells me they will never get a job and would be stupid to even think about it. People today have no honor, as a kid, its was embarrassing for anyone to be taking anything from the government, now it is the norm! This system has to crash to be fixed – there is no way or no one that can fix the bureaucratic nightmare that has been created. Prepare, I think that crash is closer them most think, I give the FED major credit for keeping things running as long as they did, but we are close, the cliff is a step or two away!
That’s right oncefired, lets shame the poor even more. They are all a bunch of lazy bums. It doesn’t have anything to do with the offshoring of jobs. In fact, let’s make things harder on them, especially if they get SSD (you know how hard it is to get??)…pfffffft. Please, you and your ilk, don’t ever talk to me in the real world. Instead go kiss some elite a** and beg them for the crumbs, and slave wages. Just hope you ever get sick or are in need.
Great Article- spot on.
Please consider WHY the ads that no dubt help pay for this site HAVE TO cover the interesting charts that can’t be read? There is Plenty of room to push ADS out to the right of the page! Yes ?
This is a suggestion -hope it’s well received 🙂
Absolutely agree with OnceFired. The Overfed, Overentertained and the Purposeless MUST SUFFER in order to exsercise their petit-sized spirit, in order to grow it, as the door to the Truth can only be unlocked with both hands: The Spirit and The Intellect. So far the United States is a FAILED EXPERIMENT. Then, after 1,000 years of suffering, the Spiritual Guides will appear and show the masses the road to the truth.
Thanks to the Neoliberalism that begin in the 1980s when Ronald Reagan and Its advocates support extensive economic liberalization policies such as cut taxes for the rich, privatization, fiscal austerity to cut only social service, deregulation, free trade, and reductions in government spending, to enhance the role of the private sector in the economy. Neoliberalism was the Reagan economic and foreign policy and it was introduced by Ronald Reagan in the United States and Margaret Thatcher in the United Kingdom. The transition of consensus towards the neoliberal policies and the acceptance of the Reagan neoliberal economic policies are the root of the financial crisis of 2007–08 and the coming U.S. and the world economic catastrophe on 2016.
You’re right less than 20% own 93% of everything and they have the audacity to call us lazy bums. But from the comments, I see a lot of people buy the Fox News narrative. They get us to shame and despise one another, and it works! Blame the victim!
I call this manipulated data. Many charts are not fully readable on a large computer screen fully expanded view. And the x and y grid data points of reference are in light print (unlike the charts posted by commentators). Used selected data and selected reference comparisons. Population not in the work force. Just how does that look when compared with the increase in post WWII births? Or, when you removed from the non-employed those who have retired? I am tired of pro and con sides manipulating data. I find little source siting for how “he” arrived at his POV. I have seen some small businesses go out of business in our areas and economy was not the biggest reason. Big chain retail businesses moving in, and can offer lower prices (like Walmart….and what does Walmart do for its employees > not pay enough or work enough hours to qualify for benefits > employee qualifies and must use government assistance). If you are going to post items like this, site resources to validate, be more truthful with data (such as number working that are part of the working population not retired or child) AND make charts readable besides lines on a paper that you tell us what it is trying to prove. Or, have them pop up larger when clicked on. Otherwise, this “article” is like so many others classed as HS.
Blow me. If your pea brain is too small to comprehend simple mathematics then go to a lifestyle website and look at the latest fashions or play Pokemon Go. I really should require an IQ test before letting idiots like yourself comment.
What an intelligent, rationale debate of the issue. Instead, when someone cannot support what they post, they attack and insult. I am an intelligent person, that is why I looked for more info, wanted to be able to fully see the info for the charts and where the info came from. You do not offer this, so one must assume you are not able. I would suggest you window of vision is fairly narrow. Analysis of incomes, jobs, employment is not simple, and often slanted by the data the publisher wishes to acknowledge (Republicans, Democrats, liberals, tea party). I still hold this is manipulated biased data. Make the graphs big, site sources of info, be willing to back up the assertions you are making. The insults you post are just that, not defending you POV.
Amazing how you are the only one who can’t read a graph. You drop a big shit on my site with your worthless whiny comment because you are too intellectually lazy to investigate the facts presented. Your original comment referencing population growth shows your mathematical deficiencies, as the graphs about not in the labor force are as a percentage of the total. Your contention that the data is manipulated proves you are an intellectual lightweight who doesn’t even understand what she is reading. Your clearly not an intelligent person. I would suggest you go to a website like Huffington Post where you can get in touch with your feelings rather than think or comprehend. Maff is hard for intellectually challenged lazy people like yourself. Go drop a shit comment on some other site where you won’t be called on being a lightweight.
For the administrator of a site, I’m befuddled by your behavior. In my experience, people in leadership roles should set a behavioral example for those who look up to them.
The example you set is one of anger and a foul temper. Instead of reading my post and replying in an adult manner, you immediately lower yourself to the bottom rung of the internet, flinging insults instead of logic.
I pointed out my opinion that the graphs were intentionally presented in a way to alter the way the data is perceived. For example, the graph “correlating” employment rates with annual change in hourly earnings:
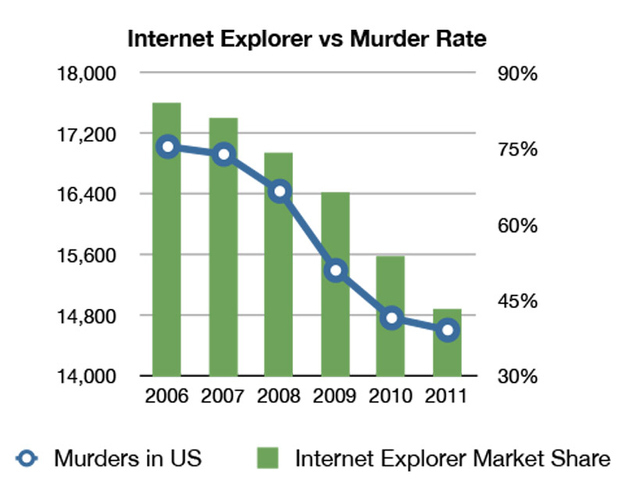
In hindsight, you can create graphs correlating the silliest things. In order for these data sets to represent scientific accuracy, you have to then PROVE the correlation in a predictive manner, instead of simply looking at them in the future. For example, here are some great graphs showing amazing correlations.
This graph shows the correlation between use of Internet Explorer and Murders in the USA:
This graph displays the correlation between films starring Nicholas Cage, and how many people drown in pools:

So, before you go insulting other people over their opinions and assertions, I recommend that you return your degree (if any) to whatever University you graduated from. Because it obviously isn’t helping you at all, if the only reaction you have to a reasonable argument (even if it dissents with yours) is to throw insults and attempt to bully the questioning viewpoint.
Grow up. And I wish you the best of luck in your future endeavors. It is my opinion that luck may be the only help you get (with an attitude like yours).
Wow. You wrote dozens of paragraphs and said absolutely nothing. Now let’s get down to business Debbie. My post has multiple bullet points with factual data within each bullet point. Let’s test your awesome math skills, since you are incapable of interpreting a chart and feel the need to deflect my comments with gibberish links.
SPECIFICALLY present a counter point to any of my facts. Not your bullshit generalizations. Let’s address each of my points one by one and see who knows their shit. I will obliterate you because you don’t have a clue what you are talking about. Bring it on baby. Or maybe you can post some more worthless links and cry about being mistreated after your initial shit dump comment on a 10 month old post.
I await your detailed counterpoint analysis of my facts.
I did not invite you to call me Debbie, AND am not by any means your baby. Both show your rude assumptions or demeaning behavior. My first post suggested you purposely did not make the charts readable so others could see what you were showing. The lines were bolded and easy to see, but not the data points on the x and y axis. Then I requested references to where you get your data from/reference points. Thus, the data and charts could be reviewed, and if desired, a discussion. I suggested you select the data you want that would support your claims. Instead, you have attacked, insulted, demeaned. To me, this means you are unable to have a discussion that has opposing views, or worse, unable to support you argument. Without improved/fully readable charts I see no reason for debate. Anyone reading this will note I have not called names or demeaned. The ridiculous charts were to demonstrate how easy it is to make charts try to show something. Everyone should ask to read the fine print if they are going to accept the data presented. That was my point, lack of that suggests you want persons willing to follow like sheep, and not question what you have presented. I will be watching for improved/readable charts, then will evaluate the data you are presenting, if you dare.
Non-response, just as I expected. Your very first words in your first comment was that I manipulated data. You have not provided one iota of counter data to prove your worthless point. I love when first time commenters arrive on the site and drop a big shit insult and then when I respond in a likewise tone, they get their panties in a twist. Right Debbie.
Most of the article is verbiage, describing what you are seeing in the charts. You see what you want to see. I can read the charts perfectly well and so can everyone else. You are not mathematically proficient enough to make a cogent counter argument to my facts.
Here are your links to larger versions of the charts:


OK sweetheart, I await your detailed fact based analysis of how I have manipulated the data presented in the article. If you dare.
These are the people you should blow (the high side of the graph in green), they might feed you some crumbs. Hope you can understand it 😉
[img [/img]
Debbie coughed up the following:
“I am an intelligent person, that is why I looked for more info, wanted to be able to fully see the info for the charts and where the info came from.”
Demonstrate your intelligence by digging up info to refute what was posted. We won’t be holding our breath.
I appreciate the larger charts. Again, insults after demeaning insults. You ASSUME I go by Debbie, and presume to call me this, along with demeaning sweet heart and baby. I would dare, but my work week starts, and have less time than on the weekend. Why did it take so long to provide the link to bigger charts? And why no link in the “report”? Interesting that I did not hoist personal insults, etc. yet get them back when I challenged data. You state others could read the charts, fully read each none bolded x and y access words. I was not the only one in my house that found them difficult to read. Fine print, faint print leads to suspicions. Yet, you have to attack even the difficulty in reading it, rather than say “sorry, let me provide you with links that will make that easier, then please respond for a discussion of how and where I obtained data to create charts”. If time permits, I will follow up with this next weekend.
I didn’t provide the charts. I suggested that you show your intelligence and dig up data to refute the data provided by admin. Still waiting
Re-read your first missive here. Notice how you took a shit on the article? How is it that you flinging shit is ok but admin flinging it back is not? Hypocrite much?
All it took for me to find the charts you questioned and their source was a right click and a left click. Is it just too taxing for you to do the same? Internet searches are your friend….learn how to use them. You never know when a simple search will prevent you from looking like an ass.
Debbie Baby
What a shocker. YOU called me a manipulating liar with your first fucking sentence. And now your panties are all twisted because I kicked the shit out of you and challenged you to prove my facts wrong. You have made a half dozen worthless bullshit posts saying absolutely nothing. That’s the sure sign you are a Bernie Sanders voting liberal. You are a lightweight.
I provide you the enlarged charts, but now you want some sort of report. You are a dolt. You are incapable of logical thought. I can’t wait for your detailed counter analysis to my facts. Take care sweetheart. And don’t burn the fries at McDonalds. You’ve already got two written warnings.
What kind of sperg just shows up a year and a half later and starts discussing the screen resolution of the charts? Shouldn’t you be getting ready for the kick-off of the DNC?
Hey Little Debbie, you’re walking into a hornets nest with a cricket bat and a blindfold.
Somebody better call the Amber Lamps.