

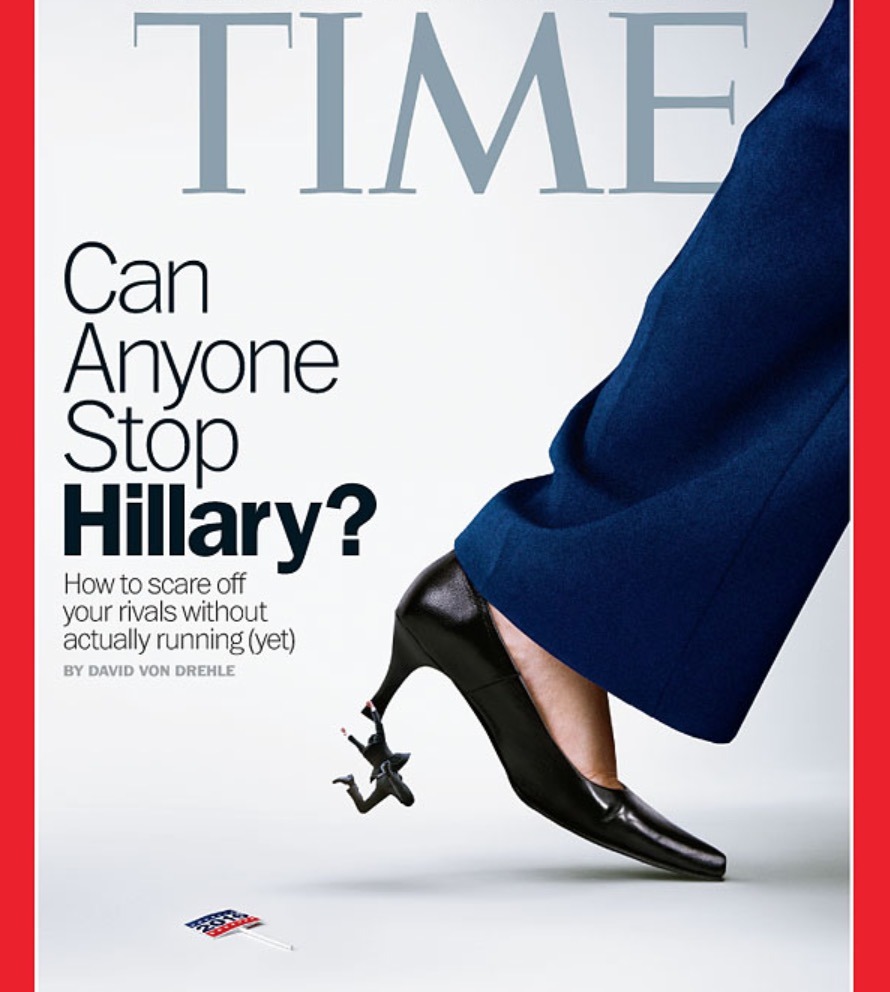
2014 Time Magazine Cover
A couple of days ago, investigative journalist Sharyl Attkisson published a very interesting article which examined how Bloomberg News egregiously spun the results of its recent presidential poll.
She notes:
Is Hillary Clinton squashing Donald Trump into oblivion in the polls? Or is her lead over him perilously shrinking? One thing we know is: there are countless ways to spin a poll. Consider the case of selective reporting on the most recent Bloomberg national poll.
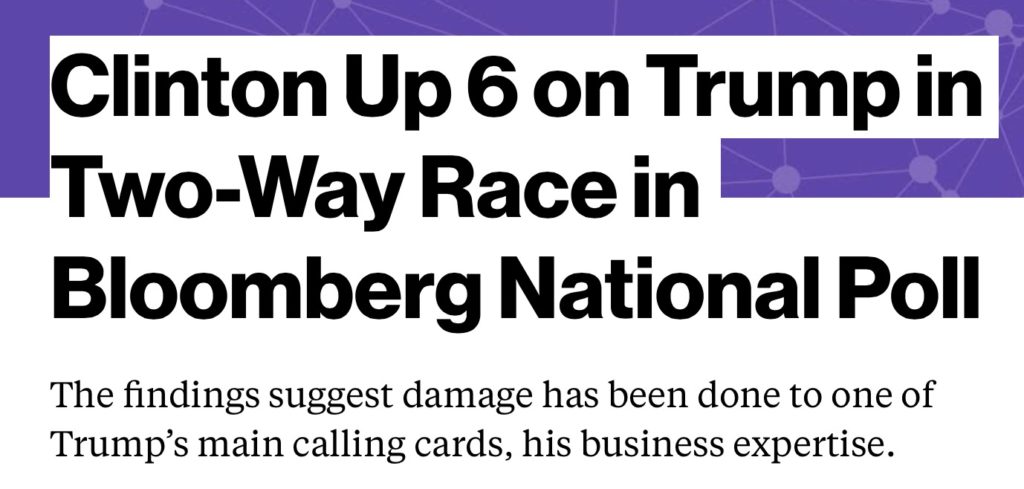
On Aug. 10, Bloomberg reported “Clinton up 6 on Trump in Two Way Race.” But looking at the actual poll, Trump has moved so close to Clinton, the results are within the margin of error.
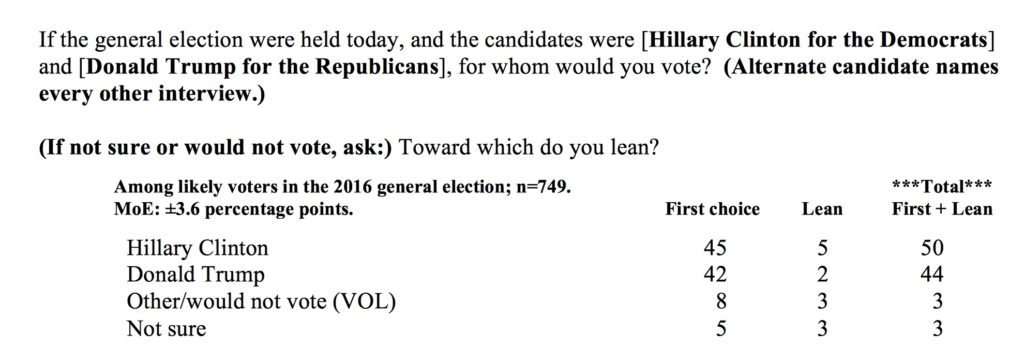
In the most recent poll, the spread between Clinton and Trump in a two-person race was down to just 3 percentage points, Clinton at 45% and Trump at 42%. That’s within the margin of error. When Libertarian and Green Party candidates are put in the mix, it’s Clinton 42% and Trump 40% –again within the margin of error.
But this notable trend isn’t reflected in the Bloomberg write-up here. Instead, the reporter chose to use the poll numbers that look better for Clinton: ones that added in “leaners.” What are leaners? Respondents who were first asked who they’d vote for, then answered they didn’t plan to vote or didn’t know who they’d vote for, and then were pressed to pick a candidate they were leaning toward, anyway. This is how Bloomberg got to the 6-point spread cited in its headline…double the actual spread of 3%.
The graphic Bloomberg used in its news story appears somewhat misleading in this context. It depicts the 6-point spread as the result of the question “…for whom would you vote?” It doesn’t disclose that the graphic adds in “leaners” who were asked a followup question.
It’s simply another reminder that what you read in the news often comes through a filter.
So here’s the primary thing Sharyl is calling out in the above paragraphs.
From Bloomberg’s polling data:
While I’ll give Bloomberg the benefit of the doubt and assume that they’ve always included the “lean” category in their totals (they did for June, unclear if they did prior to that), is adding this category to the total really justified? Moreover, Bloomberg should make this meaningful choice clear in the text of their article (they don’t), particularly when the tone of the article is unabashedly promoting the idea that Clinton is doing incredibly well.
All you need to do is take a look at the article’s heading to see how biased it is.
Does this seem in any way appropriate considering her lead when not including the “lean” category is a measly 3 points? Moreover, what does Bloomberg’s own polling data tell us about the race when Gary Johnson and Jill Stein are included (as they should be since they will appear on most ballots).
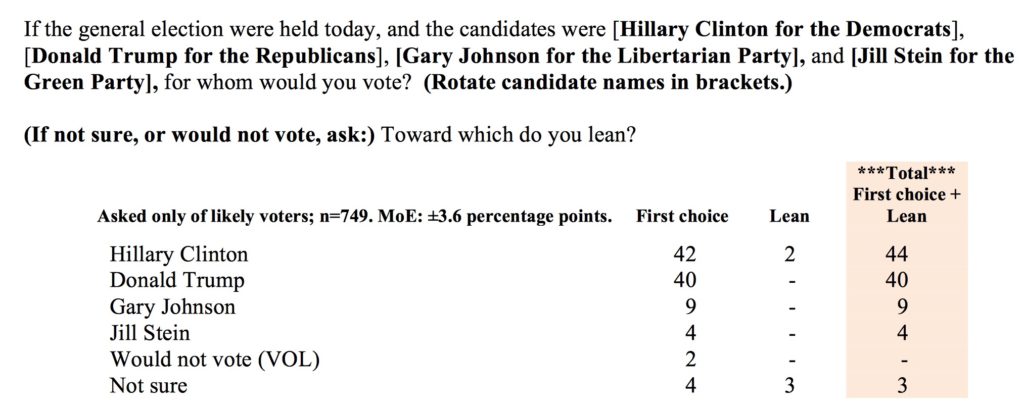
So with the four options that appear on most ballots, Clinton is in a pretty tight race with Trump. These are the facts, but as you saw, the article’s headline was incredibly misleading and skewed to make it seem as if a Hillary victory is inevitable.
But it’s not just the headline. The entire article reads like PR for team Hillary. A few more paragraphs of note:
Hillary Clinton has retained most of the bounce she received after the Democratic National Convention and now enjoys a 6-point lead over Donald Trump in a two-way contest among likely voters.
The findings suggest damage has been done to one of Trump’s main calling cards, his business expertise, with 61 percent of likely voters saying they’re less impressed with the Republican nominee’s business acumen than when the campaign started.
Clinton’s lead over Trump of 50 percent to 44 percent in a two-way contest is boosted by a greater consolidation of support among Democrats than Republicans have shown for their candidate. She wins 94 percent of the Democratic vote, including 93 percent of Democrats who backed Senator Bernie Sanders in the primary race, while Trump gets 87 percent of the Republican vote.
Does the above sound like fair coverage of a poll that shows a 2 point spread between Clinton and Trump in a four person race? While Bloomberg does acknowledge that the results are within the margin of error in a four person race, it is mentioned as an aside as opposed to being the focal point of the piece. Instead, the writer chooses to focus his attention on how strong Hillary’s position is relative to Trump. A fact that doesn’t seem to be confirmed by the actual poll results.
Here’s some more “analysis” from the article.
The poll confirms Clinton emerged from the noisy campaign week that followed her convention in a stronger position than Trump. That edge could prove valuable, if she can maintain it, during a period when there are no major events on the political calendar until the first debate on Sept. 26.
“The question following a convention bounce is how much of it will stick, as memory of the event and excitement fades,” said pollster J. Ann Selzer, whose Iowa-based firm Selzer & Co. oversaw the survey. “For Clinton, the contest is far from settled, but she is on solid ground.”
Clinton’s voters are more positive about her candidacy than those backing Trump are about his, with 56 percent saying their alignment with her is more an act of support than to stop Trump. His fans, meanwhile, are more motivated by their disdain for her, with 56 percent saying their backing of Trump is more a vote against her than support for him.
So what’s my point? My point is this race is a lot closer than people think, and media headlines re:polls are probably being spun across the board. Most people just read headlines and never bother to actually read articles, let alone dig into the underlying poll data to see what’s really going on. As such, people are being manipulated by the media into thinking that Clinton is inevitable when she isn’t.
This explains a lot. I’ve been shocked by the visceral hatred being spewed by pro-Clinton henchmen at Jill Stein and her followers over the past few weeks. Such attacks make no sense unless Clinton people:
1) Know the election is much closer than the media is claiming.
2) Recognize Sanders supporters are not backing her to the extent polls are claiming.
Which brings me to the final point. In its article, Bloomberg claims 93% of Democrats who backed Sanders support Hillary. This is a clever slight of hand because many Sanders supporters are not registered Democrats. A casual reader will come away thinking that 93% of Sanders supporters back Hillary, which is unquestionably untrue. Telling readers what percentage of Democratic Sanders supporters back Clinton tells you absolutely nothing. I’ve said for months that anywhere between 25%-33% of Sanders supporters will either vote Jill Stein or stay home. I stick to that prediction.


It’s the Lemming thing again.
“Who you votin’ for?”
“I don’t know, who you votin’ for?”
“I’m votin’ for who ever you vote for?”
Convincing you the herd is moving in this direction and you better move with the herd.
I’m sure many of the Bovine in our population will do exactly that.
Pow: It’s just a 2-point race, Clinton 38%, Trump 36%
By Paul Bedard (@SecretsBedard) • 8/16/16 2:57 PM
The convention polling bumps for Democrat Hillary Rodham Clinton and Republican Donald Trump are over, and they are practically even, according to a new poll of likely voters.
A Zogby Analytics survey provided to Secrets Tuesday shows:
Hillary Clinton 38%
Donald Trump 36%
Libertarian Gary Johnson 8%
Green Party Jill Stein 5%
Not sure 13%
“It seems the convention bumps are behind us and we are back to a close race!” said the analysis.
What’s new in the online poll is that older millennials are starting to trend to Trump.
Trump’s team believes that online polls more accurately show the horserace because more and more voters prefer to give their opinions anonymously.
Pollster John Zogby is a specialist in digging into specific voting blocks, some of which he has given names like NASCAR and Weekly Walmart voters. Zogby revealed in the new poll analysis that those two groups of voters trended Democratic under President Obama, but are now behind Trump.
Overall, Zogby said that Clinton leads middle income voters, blacks, women and Hispanics. Trump leads among independents, men and older voters.
The takeaways from Zogby Analytics’ analysis:
— Donald Trump continues to lead among his core groups, which are men, he leads Clinton 41% to 35%. He also leads Clinton among older likely voters such as 50-64 year olds (41%-36%), and those 65+ (44%-36%).
— Trump’s numbers have dipped a little among middle income voters, Hillary Clinton now leads among those voters who earn $35k-50k (38%-37%), $50k-75K (37%-34%) and $75-100k (45-35%). Clinton also leads big among her core base-Millennials 18-29 years old (36%-26%), 18-24 year olds (59%-22%), Hispanics (51%-18%) and African Americans (81%-8%), which is not a big surprise. She has also won back the support of women voters, which Trump had narrowed the gap in our last poll; Clinton is winning among women 42% to 32%.
— Trump has kept the race close by winning Independents. He is winning Independents 32% to 26% and has also closed the gap among older Millennials. Trump is tied with Clinton at 30% among 25-34 year old voters.
I read “Originals” by Adam Grant not long ago, and one of the things that stuck with me was the discussion about unappealing circumstances. What they proved was that people are much more likely to accept a shitty situation if they are primed for it first. I’m guessing that’s what all this “Hillary inevitability” and “Trump imploding” bullshit is about. They are trying to get everyone used to the taste of dog shit in the hopes that more people will vote for her in the Fall.
All that matters is who is counting the votes and who bought them. Nothing is done legit any longer.
I’m no statistician but even I know that the “margin of error” as used in statistical purposes doesn’t mean you can just subtract 3% from one option and add 3% to another. It’s more of a measure of how accurate a poll is, i.e. a poll with a 3% margin of error should be regarded more highly than a poll with a 6% margin of error. Yet year after year I see “journalists” subtracting a percentage from one candidate and adding said percentage to the other because “that’s within the margin error!” Stunning levels of intellectual ignorance that reveal most journalists are highly-functioning idiots who would be revealed as such in a heartbeat if not for their armies of teleprompters, stylists, writers, directors, and producers.
A margin of error means that if the poll were re-conducted, it would reflect the same results as the original** plus or minus the margin of error.
If you have the original poll at 50/50 with a 4% margin of error the next re-sampling could show 48/52 or 52/48.
It describes the accuracy and reliability of the poll itself.
**Provided there were no other factors that could influence the result, such as dissimilitude in the sampled data.
When they get an answer they don’t like, they lie. They spin, adjust, and revise. It’s all the same:
BLS statistics
polls
AGW
SS trust fund stability / viability
Whenever the answer doesn’t fit the narrative, they adjust the answer to fit rather than the narrative. It’s about the only thing in national news that’s truly transparent: how much, how often and how egregiously they lie. Believe them not.
Trump will get a very nice TV show after the elections, as a consolation prize, for destroying the GOP. Which was his job, as a globalist.
He is blowing the election on purpose, he does not want the responsibility, he just wants to hear himself speak.
Even if he did get elected, he would get shuffled into a room, where they show him the play book, and tell him, “do this, or we won’t protect you”
Hillary has already seen the play book, and can’t wait to destroy what is left of the ME.