SUBPRIME AUTO NATION

Have you heard the news? Auto sales are booming. Total sales for the month of August were 1,285,202 vehicles, according to Autodata Corp, the highest monthly sales figure for any August since 2007, when 1.47 million autos were sold in the United States. Year to date auto sales have totaled 9.7 million and are on track to reach 14.5 million. Between 2006 and 2007, auto sales ranged between 16 million and 18 million. They crashed below 10 million in 2009. The Keynesians running our government have pulled out all the stops to restart this engine of consumer spending. First they wasted $3 billion of taxpayer funds on the Cash for Clunkers debacle. Almost 700,000 perfectly good cars were destroyed in order to keep union workers happy.  This Keynesian brain fart distorted the used car market for two years, raising prices for cars needed by the working poor. After that miserable failure, they realized the true secret to selling vehicles is to give them away to anyone that can scratch an X on a loan document, with 0% interest for 60 months, financed by Federal government controlled banking interests. Add in some massive channel stuffing and presto!!! – You’ve got an auto sales boom.

General Motors sales are up 3.7% over 2011. Ford Motors sales are up 6% over 2011. The Obama administration continues to tout their saving of the U.S. auto industry with their bailout in 2009 that saved unions and screwed bondholders. If this strong auto recovery is not an illusion, how do you explain the two charts below? General Motors stock is down 42% since 2011. The highly proclaimed success story called Ford Motors has seen their stock collapse by 50% since 2011. This is surely a sign of tremendous success and anticipation of soaring profits for these bastions of American manufacturing dominance.

Chart forGeneral Motors Company (GM)

Chart forFord Motor Co. (F)

This is America, land of the delusional and home of the vain. The appearance of success is more important than actual success. The corporate mainstream media dutifully reports the surge in auto sales is surely a sign the economy is recovering and the consumer has finished deleveraging and is ready to spend again. The government propaganda machine proclaims the surging auto sales are due to their wise and forward thinking policies (like the Chevy Volt). Luckily for them, there are millions of gullible Americans who believe the storyline and are easily convinced that driving a $30,000 new car, financed over seven years, makes them a success. The decades of Bernaysian marketing propaganda has worked its magic on the government educated, math challenged citizenry. There are only two things that matter to the non-thinking auto buyer (renter) – the monthly payment and what the next door neighbor and his coworkers will think. Buying a fuel efficient car they can afford, paying it off in three or four years, and driving it for ten years, while saving the monthly car payment, is what a practical, rational thinking person would do. The fact that only 20% of the 9.7 million vehicles sold this year have been small cars and the average sales price of new cars sold is now $31,000 proves Americans are still living in a delusional fantasyland of cheap gas and monthly payments for eternity.

As gas prices surpass $4 per gallon across the country, somehow 4.7 million of the 9.7 million vehicles sold in 2012 have been pickups, vans, crossovers or SUVs. Three of the top eight selling vehicles are pickups. Luxury vehicle sales are booming, with Mercedes, BMW, Porsche, Land Rover and Audi showing double digit percentage sales gains over 2011. We’ve entered a recession, gas prices are approaching all-time highs, job growth is pitiful, and Americans continue to buy luxury gas guzzlers on credit. This will surely end well.

The average payment on a new car in 2012 is $461. For used cars, the average monthly payment is $346. Today, 77% of new car purchases are financed. About half of all used vehicles involve financing. Of those cars financed, 89% are through a loan vs. 11% with a lease. A critical thinking person might wonder how a country with 4 million less employed people than we had in 2007, median household net worth down 35%, and real wages lower than they were in 2007, could be experiencing an auto boom. The answer is a government/corporate/banker/media effort to funnel taxpayer funds to deadbeats across the land in a fruitless attempt to create a facade of recovery. Our governing elite are convinced that more debt peddled to the masses is the path to recovery for an economy that imploded due to excessive debt peddled to the masses in the first place. Essentially, it comes down to who benefits from the peddling of debt. It isn’t the masses, as they become enslaved in the chains of debt and monthly payments in perpetuity. Debt peddling benefits Wall Street bankers, politicians, and mega-corporations selling crap to the masses.

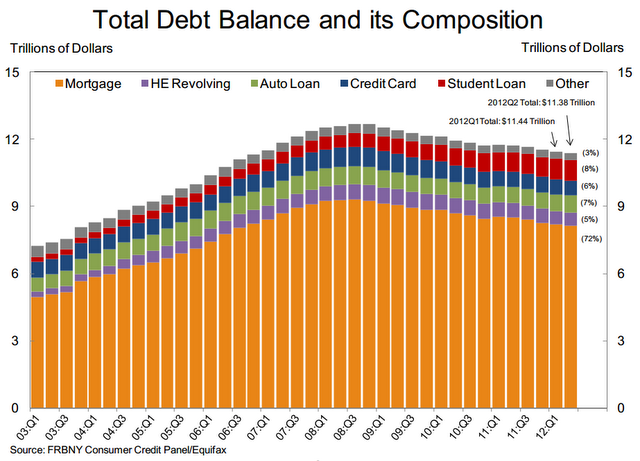
The storyline being sold to the vegetative dupes (watching Honey Boo Boo) that occupy space in this delusional paradise we call America, by the corporate media, is that consumers have deleveraged and are ready to resume their “normal” pattern of spending money they don’t have on stuff they don’t need. Of course, the facts always seem to get in the way of a good yarn. Consumers have never deleveraged. Consumer credit outstanding is at an all-time high of $2.58 trillion. The decline from $2.55 trillion in 2008 to $2.4 trillion in 2010 was NOT deleveraging. It was the Wall Street Too Big To Fail banks taking a big dump on the American taxpayers. They passed their bad debts to you through TARP, the Federal Reserve buying their toxic “assets”, and ZIRP. 

Revolving credit (credit card) debt peaked at just above $1 trillion in 2008 and “declined” to $850 billion during 2010.  The media storyline is that you buckled down and paid off your credit cards, therefore depressing consumer spending and creating a recession. Sounds convincing except for the fact that it’s a load of bullshit. The Federal Reserve’s own data proves it to be false. Your friendly Wall Street banks have written off $213 billion of credit card debt since 2008 and passed the bill to the few remaining taxpayers in this country. For the math challenged, this means that consumers have actually INCREASED their credit card debt by $68 billion since 2008. The bad news for our Chinese crap peddling mega-retailers is that the significantly poorer average middle class American household is using their credit cards to pay their property tax bills, IRS bills, and utility bills in order to survive.  

Credit Card Charge-off in Dollars 2005 – 2011 — Not Seasonally Adjusted:

Year Dollar Amount
2011 $46,017,459,671
2010 $75,090,106,350
2009 $83,179,901,000
2008 $53,506,353,600
2007 $38,149,440,000
2006 $32,111,934,400
2005 $40,634,994,400
Year & Quarter Dollar Amount
2012Q1 $8,772,385,443


The category of debt that barely budged in the 2009 collapse was non-revolving credit. It stayed in the $1.5 trillion range in 2009 and has since surged to over $1.7 trillion in 2012. What could possibly have made this debt skyrocket by $200 billion when the GDP has only grown by 12% over the same time frame? You guessed it – your corporate fascist friends in Washington DC and on Wall Street. Non-revolving debt consists of auto loan debt of $663 billion and student loan debt of approximately $1 trillion. Student loan debt has shot up by $300 billion since 2008. This student loan debt is being distributed, like candy by a pedophile, from the Federal government in an effort to artificially hold down the unemployment rate.

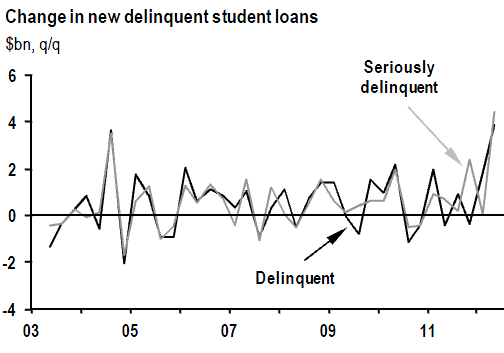
Approximately $500 billion of the student loan debt is held directly by the Federal government, up from $100 billion in 2008. The Feds guarantee the majority of the remaining student loan debt. Can you think of a more subprime borrower than a 40 year old former construction worker getting a liberal arts degree from the University of Phoenix, sitting at his computer in his underwear scratching his balls, and paying with a $10,000 Federal student loan from you? This fraudulent attempt to obscure the true employment situation will end in tears for the borrowers and the American taxpayer. It’s tough to make a loan payment without a job. The student loan bailout is just over the horizon and will cost you at least $300 billion. Delinquencies are already off the charts.


When has offering low interest debt in ample portions to people without jobs, income or assets ever backfired before? The bankers and politicians that control this country seem to be a one-trick pony. They will never admit that debt is the problem and reducing it the solution. The real solution would make them poorer, so their solution is to pour gasoline on the fire with more debt at lower interest rates to more people. The addict will keep injecting more poison into their system until sudden death. The bankers and politicians know we are a car-centric society and appeal to our vanity and poor math skills to keep the game going.     

During the first quarter of this year, total U.S. car loans totaled $52.5 billion. That’s 49% higher than the same period in 2009. Also during the first quarter, the average amount financed on new vehicles rose by $589, to $25,995, and for used cars by $411, to $17,050. Furthermore, buyers are stretching out payments for longer terms: The average length of new- and used-vehicle loans jumped a full month during the first three months of this year, to 64 and 59 months, respectively. The surge in auto sales is being completely driven by doling out more loans for a longer time frame to deadbeat borrowers. Subprime auto loans now make up 45% of all car loans and the vast majority of all used car loans.  They have even created a category called Deep Subprime. Borrowers classified as “deep subprime” (i.e. those with Vantage scores below 600) account for 10.7% of auto loans. You can also classify them as loans that will never be repaid.


Two thirds of all car sales are for used cars, so the fact that 37% of all new cars are being sold to subprime borrowers is exacerbated by the ridiculous lending practices for used cars. The fine folks at Zero Hedge have provided the outrageous data and a chart that proves beyond a shadow of a doubt what awaits the American taxpayer – another bailout. Zero Hedge has already revealed the GM fake recovery by detailing their channel stuffing over the last two years. Now they’ve dug up more dirt on why car sales are surging. What could possibly go wrong providing loans for more than the value of the asset to people with a history of not paying their debts?

  • Subprime borrowers received 56.46% of loans on used cars in the quarter, up from 52.70% a year earlier.
  • The average loan-to-value on new cars was 109.55%
  • The average used car loan-to-value ratio rose to 126.62%
  • 77% of Subprime Auto Loans are for a period greater than five years

It’s amazing how many cars you can sell when you aren’t worried about getting paid. This is the beauty of a fiat currency, a printing press, and a taxpayer available to pick up the tab after the drunken party gets out of hand. The chart below provides the details of our superhighway to disaster. The percentage of used car loans to prime borrowers is now at an all-time low, while the percentage of loans to subprime borrowers is near all-time highs reached just prior to the 2008 crash. When lenders cared about being paid back in the early 2000’s, they rarely made loans longer than five years. Today, more than 77% of all subprime used car loans are longer than five years and average FICO scores are now well below 600. Just to clarify – if your FICO score is below 600 – YOU ARE A DEADBEAT.

When you start to connect the dots, things that didn’t seem to make sense begin to crystallize. This is all part of the master plan concocted by Bernanke, Geithner, Obama and the Wall Street Shysters. The auto section of my local paper now makes sense. Offers of 7 year financing at 0% interest and monthly lease offers of $150 to $200 for brand new cars now are understandable. The newer model BMWs, Cadillac Escalades, Volvos, and Jaguars I see parked in front of the low income luxury gated townhome community in West Philadelphia now makes sense. A pizza delivery guy driving a new Lexus is now explainable.   

The master plan is fairly simple. The Federal Reserve lends money to the Wall Street banks for 0% interest. These banks then turn around and provide credit card debt at 13% interest, new & used car loans to prime borrowers at 5% interest, and new & used car loans to subprime borrowers at 16%. When you can borrow for free, you can take a chance that a significant number of your borrowers will default. Essentially, Ben Bernanke is screwing the prudent savers and senior citizens by paying them 0.15% on their savings in order to subsidize the bankers that destroyed the country so they can make auto loans to the same people who took out the zero percent down interest only no doc mortgage loans in 2005. In addition, Wall Street knows the Bernanke Put is still in place. If and when these subprime loans explode in their faces again, Bennie, Timmy and Obamaney will come to the rescue with your tax dollars. Its heads you lose, tails you lose, again.    

 The chart below is like a who’s who of TARP recipients. The top 20 auto lenders control half the market. And look at the leader of the pack. Our friends at Ally Bank are the market share leader. You remember Ally Bank – they conveniently changed their name from GMAC (also known as Ditech – biggest subprime mortgage lender) after losing billions and being bailed out by you. They still owe you $11 billion and are 85% owned by the U.S. Treasury. No conflict of interest there. You have the biggest auto lender on earth controlled by the Obama administration. Do you think they have an incentive to make as many loans as humanly possible to help Obama create the illusion of an auto recovery? The only downside is for the American taxpayer when we have to eat billions more in Ally/GMAC losses. This insolvent excuse for a lending institution has been extremely aggressive in the subprime auto lending market and has forced the other wannabes – Wells Fargo, JP Morgan, Capital One and Bank of America – to lower their lending standards. Does this scenario ring a bell? 

top_20_car_lenders_market_share

We’ve become a subprime auto nation, addicted to easy debt, living lives of hope, delusion and minimum monthly payments. Storylines about economic recovery, fraudulent government statistics showing lower unemployment, feel good propaganda from the corporate mainstream media, and a return to easy money debt fueled spending does not constitute a real recovery. Until the bad debt is purged from the system and saving takes precedence over spending, the country will stagger and ultimately fall under the weight of its immense debt. We are lost in a blizzard of lies. This subprime fueled engine of recovery will propel the country into the same canyon of reality we entered in 2008. The crack up boom approaches.


survival seed vault


WILL THE MILITARY SHOOT YOU DOWN LIKE DOGS? – OPEN THREAD

There seems to be a notion among  intellectuals that the U.S. Military would never conduct military operations against the citizens of the United States. I find that laughable, as the list below proves. American troops have been used against civilians since the inception of our country. Those in power will use everything at their disposal to retain that power, including using troops to slaughter Americans that choose to dissent. The persistent “training exercises” taking place in and around U.S. cities is not a coincidence. Those in power know our economic situation is tenuous and a collapse is on the horizon. I believe that National Guard and Federal troops will fire on Americans when ordered to do so. What do you think? 


  • The Whiskey Rebellion, or Whiskey Insurrection, was a tax protest in the United States beginning in 1791, during the presidency of George Washington. Farmers who sold their grain in the form of whiskey had to pay a new tax which they strongly resented. The tax was a part of treasury secretary Alexander Hamilton‘s program to pay off the national debt. On the western frontier, protesters used violence and intimidation to prevent federal officials from collecting the tax. Resistance came to a climax in July 1794, when a U.S. marshal arrived in western Pennsylvania to serve writs to distillers who had not paid the excise. The alarm was raised, and more than 500 armed men attacked the fortified home of tax inspector General John Neville. Washington responded by sending peace commissioners to western Pennsylvania to negotiate with the rebels, while at the same time calling on governors to send a militia force to suppress the violence. With 15,000 militia provided by the governors of Virginia, Maryland, New Jersey, and Pennsylvania, Washington rode at the head of an army to suppress the insurgency. The rebels all went home before the arrival of the army, and there was no confrontation. About 20 men were arrested, but all were later acquitted or pardoned. The issue fueled support for the new opposition Democratic Republican Party, which repealed the tax when it came to power in Washington in 1801.


  • The New York City draft riots (July 13 to July 16, 1863; known at the time as Draft Week[2]) were violent disturbances in New York City that were the culmination of working-class discontent with new laws passed by Congress that year to draft men to fight in the ongoing American Civil War. The riots were the largest civil insurrection in American history.[3] President Abraham Lincoln diverted several regiments of militia and volunteer troops from following up after the Battle of Gettysburg to control the city. The rioters were overwhelmingly working-class men, primarily ethnic Irish, resenting particularly that wealthier men, who could afford to pay a $300 commutation fee to hire a substitute, were spared the draft.[4][5] Initially intended to express anger at the draft, the protests turned into an ugly race riot, with the white rioters attacking blacks wherever they could be found. At least 100 black people were estimated to have been killed. The conditions in the city were such that Major General John E. Wool, commander of the Department of the East, stated on July 16, “Martial law ought to be proclaimed, but I have not a sufficient force to enforce it.”[6] The military did not reach the city until after the first day of rioting, when mobs had already ransacked or destroyed numerous buildings, including public buildings and homes of abolitionist sympathizers, many black homes, and the Colored Orphan Asylum at 44th Street and Fifth Avenue, which was burned to the ground. The children were not harmed.[7] The exact death toll during the New York Draft Riots is unknown, but according to historian James M. McPherson (2001), at least 120 civilians were killed. At least eleven black men were lynched.[20] Violence by longshoremen against black men was especially fierce in the docks area.[7] 


  • The Great Railroad Strike of 1877, sometimes referred to as the Great Upheaval, began on July 14 in Martinsburg, West Virginia, United States and ended some 45 days later after it was put down by local and state militias, and federal troops.


  • The Pullman Strike was a nationwide conflict between the new American Railway Union (ARU) and railroads that occurred in the United States in summer 1894. It shut down much of the nation’s freight and passenger traffic west of Detroit. The conflict began in the town of Pullman, Illinois, on May 11 when nearly 4,000 employees of the Pullman Palace Car Company began a wildcat strike in response to recent reductions in wages. Under instruction from President Grover Cleveland, a Democrat, US Attorney General Richard Olney (formerly a lawyer for a railroad) dealt with the strike. Olney obtained an injunction in federal court barring union leaders from supporting the strike and demanding that the strikers cease their activities or face being fired. Debs and other leaders of the ARU ignored the injunction, and federal troops were called up to enforce it.[9] While Debs had been reluctant to start the strike he now threw his energies into organizing it. Debs not only ignored the federal court injunction he instead called a general strike of all union members in Chicago, but it was opposed by Samuel Gompers, head of American Federation of Labor, and other established unions, and failed.[10] City by city the federal forces broke the ARU efforts to shut down the national transportation system Thousands of United States Marshals and some 12,000 United States Army troops, commanded by Nelson Miles took action. President Cleveland wanted the trains moving again and his legal basis was his constitutional responsibility for the mails. His lawyers also argued that the boycott violated the Sherman Antitrust Act, and represented a threat to public safety. The arrival of the military and subsequent deaths of workers led to further outbreaks of violence. During the course of the strike, 13 strikers were killed and 57 were wounded. Property damage exceeded $80 million.


  • The Bonus Army was the popular name of an assemblage of some 43,000 marchers—17,000 World War I veterans, their families, and affiliated groups—who gathered in Washington, D.C., in the spring and summer of 1932 to demand immediate cash-payment redemption of their service certificates. Its organizers called it the Bonus Expeditionary Force to echo the name of World War I‘s American Expeditionary Force, while the media called it the Bonus March. It was led by Walter W. Waters, a former Army sergeant. Many of the war veterans had been out of work since the beginning of the Great Depression. The World War Adjusted Compensation Act of 1924 had awarded them bonuses in the form of certificates they could not redeem until 1945. Each service certificate, issued to a qualified veteran soldier, bore a face value equal to the soldier’s promised payment plus compound interest. The principal demand of the Bonus Army was the immediate cash payment of their certificates. Retired Marine Corps Major General Smedley Butler, one of the most popular military figures of the time, visited their camp to back the effort and encourage them.[1] On July 28, U.S. Attorney General William D. Mitchell ordered the veterans removed from all government property. Washington police met with resistance, shots were fired and two veterans were wounded and later died. Veterans were also shot dead at other locations during the demonstration. President Herbert Hoover then ordered the army to clear the veterans’ campsite. Army Chief of Staff General Douglas MacArthur commanded the infantry and cavalry supported by six tanks. The Bonus Army marchers with their wives and children were driven out, and their shelters and belongings burned.


  • The 1967 Detroit riot, also known as the 12th Street riot, was a civil disturbance in Detroit, Michigan, US that began in the early morning hours of Sunday, July 23, 1967. The precipitating event was a police raid of an unlicensed, after-hours bar then known as a blind pig, on the corner of 12th (today Rosa Parks Boulevard) and Clairmount streets on the city’s Near West Side. Police confrontations with patrons and observers on the street evolved into one of the deadliest and most destructive riots in United States history, lasting five days and surpassing the violence and property destruction of Detroit’s 1943 race riot. To help end the disturbance, Governor George W. Romney ordered the Michigan National Guard into Detroit, and President Lyndon B. Johnson sent in Army troops. The result was 43 dead, 467 injured, over 7,200 arrests, and more than 2,000 buildings destroyed.


  • The Kent State shootings—also known as the May 4 massacre or the Kent State massacre[2][3][4]—occurred at Kent State University in the U.S. city of Kent, Ohio, and involved the shooting of unarmed college students by the Ohio National Guard on Monday, May 4, 1970. The guardsmen fired 67 rounds over a period of 13 seconds, killing four students and wounding nine others, one of whom suffered permanent paralysis.[5] Some of the students who were shot had been protesting against the American invasion of Cambodia, which President Richard Nixon announced in a television address on April 30. Other students who were shot had been walking nearby or observing the protest from a distance.[6][7]

SCREWED GENERATION

Does the entitlement/welfare/ warfare state benefit the Boomers or the Millenials? Has the massive consumer and government debt accumulated over the last 30 years benefitted the Boomers or the Millenials? Who will vote in massive numbers to keep the status quo? Who didn’t save enough for their retirement so they are not leaving the workforce, keeping young people out of the workforce? Who gets sent to die in wars started and managed by Boomers? During Fourth Turnings the Prophet Generation is supposed to lead and the Hero generation is supposed to follow and do the heavy lifting. Not too much leadership coming from the Prophet generation, just finger pointing, greed and blaming the youth for their own sins. Yes, Boomers have earned their reputation as the Shallowest Generation.

Older generations to the young: Drop dead

The acronym NEET first gained wide exposure last August, when riots blamed on young people “Not in Employment, Education or Training” broke out in London’s Tottenham district. It’s a useful term, particularly with youth unemployment fueling the angst over the European debt crisis.

The NEET rate among those 15 to 24 years of age is 19 percent in Italy, 18 percent in Greece and 17 percent in Spain and Ireland. In the United States, it’s almost 15 percent, according to figures compiled by the Organization for Economic Cooperation and Development.

Urban development expert Joel Kotkin has another term for this group of young people: “The Screwed Generation.” Writing at his website NewGeography.com, Mr. Kotkin calls these young people “the victims of expansive welfare states and the massive structural debt charged by their parents.”

Mr. Kotkin has a knack for a blunt phrase. In 2004, when he was at Pepperdine University in California, he was hired by the Greater St. Louis Economic Development Council to study how St. Louis could attract young professionals and entrepreneurs. Mr. Kotkin had some useful recommendations, few of which were remembered after he told a Post-Dispatch editorial board meeting, “Your downtown sucks.”

His view of the dim prospects facing today’s young people is rooted not just in NEET numbers, but in studies that show many college graduates are struggling to find full-time employment at a living wage. One study of 444 recent graduates by the Center for Workforce Development at Rutgers University showed that only 51 percent of graduates of four-year colleges between 2006 and 2011 had found full-time employment. Twenty percent had gone back to graduate or professional school, but the rest were working part-time or not at all.

Data from the 2010 census show the number of unemployed young people, age 16 to 29, declined 18 percent between 2000 and 2010 to its lowest point since World War II. Nearly 6 million Americans aged 25 to 34 are living with their parents, up 25 percent since 2007. Among families with heads of household younger than 30, the the poverty rate was 37 percent.

Ninety-four percent of them came out of college carrying at least some debt; the median debt load for graduates of public universities was $18,690. It was $24,460 for private university graduates.

It’s not just that companies have been slow to expand, it’s that older workers are staying on the job longer, working at least until full Social Security and Medicaid benefits become available. These are benefits that young people will be taxed for (assuming they get work) but, given long-term budget outlooks, may not be available in 40 years.

And not only are older Americans hogging the jobs and the benefits, they’re voting in large numbers against changing the calculus. Having enjoyed the benefits of post-war prosperity, many older Americans don’t want to pay the debts they’ve incurred, much less preserve benefits, repair the infrastructure or fix global warming.

Screwed is right.

In the 2008 presidential election, record numbers of 18- to 24-year-old voters turned out at the polls. They may not match that 49 percent turnout this year. Their elders vote at rates of up to 70 percent.

It’s easy to understand why America’s NEETs and debt-burdened college graduates would be disenchanted with politics. But they really can’t afford to take the year off.

Read more: http://www.stltoday.com/news/opinion/columns/the-platform/editorial-older-generations-to-the-young-drop-dead/article_68af2bc2-55be-5273-802c-972fc54cde72.html#ixzz1xIkNqnPa

BET ON THE DEBT

Time for a TBP competition. I just noticed the number on the National Debt Clock on the right side of the page. It is sitting at (well not exactly sitting – more like spiraling out of control) about $15.983 TRILLION.

You know what that means – We are going to hit the MAGICAL $16 TRILLION mark in the near future. I wish I could say this is a rare occurance, but we hit a new trillion dollar level every 11 months or so.

Let’s have a TPB bet. You need to guess which day and hour that our National Debt will hit $16 trillion. It will help me assess who on this site thinks math is hard. I’m also eligible to play – and as everyone should know by now – I always win.

The winner will get one year of free tax advice from Mitt Romney’s tax advisor, an all expenses paid trip to visit Obama’s birthplace in Kenya, and a low income housing luxury townhouse in West Philly with a leased Cadillac Escalade thrown in for good measure.

Get those calculators out. Ready, set, go.


10 YEARS INTO THE LAST FOURTH TURNING

Seventy three years ago today, World War II began. Over 65 million people (2.5% of the world population) died in the next six years. It began in year 10 of the last Fourth Turning. We are in the 4th year of the current Fourth Turning. If you think it has been bad so far, imagine what awaits.

Sep 1, 1939:

Germans invade Poland

At 4:45 a.m., some 1.5 million German troops invade Poland all along its 1,750-mile border with German-controlled territory. Simultaneously, the German Luftwaffe bombed Polish airfields, and German warships and U-boats attacked Polish naval forces in the Baltic Sea. Nazi leader Adolf Hitler claimed the massive invasion was a defensive action, but Britain and France were not convinced. On September 3, they declared war on Germany, initiating World War II.

To Hitler, the conquest of Poland would bring Lebensraum, or “living space,” for the German people. According to his plan, the “racially superior” Germans would colonize the territory and the native Slavs would be enslaved. German expansion had begun in 1938 with the annexation of Austria and then continued with the occupation of the Sudetenland and then all of Czechoslovakia in 1939. Both had been accomplished without igniting hostilities with the major powers, and Hitler hoped that his invasion of Poland would likewise be tolerated.

To neutralize the possibility that the USSR would come to Poland’s aid, Germany signed a nonaggression pact with the Soviet Union on August 23, 1939. In a secret clause of the agreement, the ideological enemies agreed to divide Poland between them. Hitler gave orders for the Poland invasion to begin on August 26, but on August 25 he delayed the attack when he learned that Britain had signed a new treaty with Poland, promising military support should it be attacked. To forestall a British intervention, Hitler turned to propaganda and misinformation, alleging persecution of German-speakers in eastern Poland. Fearing imminent attack, Poland began to call up its troops, but Britain and France persuaded Poland to postpone general mobilization until August 31 in a last ditch effort to dissuade Germany from war.

Shortly after noon on August 31, Hitler ordered hostilities against Poland to begin at 4:45 a.m. the next morning. At 8 p.m. on August 31, Nazi S.S. troops wearing Polish uniforms staged a phony invasion of Germany, damaging several minor installations on the German side of the border. They also left behind a handful of dead concentration camp prisoners in Polish uniforms to serve as further evidence of the supposed Polish invasion, which Nazi propagandists publicized as an unforgivable act of aggression.

At 4:45 a.m. on September 1, the invasion began. Nazi diplomats and propagandists scrambled to head off hostilities with the Western powers, but on September 2 Britain and France demanded that Germany withdraw by September 3 or face war. At 11 p.m. on September 3, the British ultimatum expired, and 15 minutes later British Prime Minister Neville Chamberlain went on national radio to solemnly announce that Britain was at war with Germany. Australia, New Zealand, and India followed suit shortly thereafter. At 5:00 p.m., France declared war on Germany.

In Poland, German forces advanced at a dizzying rate. Employing a military strategy known as the blitzkrieg, or “lightning war,” armored divisions smashed through enemy lines and isolated segments of the enemy, which were encircled and captured by motorized German infantry while the panzer tanks rushed forward to repeat the pattern. Meanwhile, the sophisticated German air force–the Luftwaffe–destroyed Polish air capability, provided air support for the blitzkrieg, and indiscriminately bombed Polish cities in an effort to further terrorize the enemy.

The Polish army was able to mobilize one million men but was hopelessly outmatched in every respect. Rather than take a strong defensive position, troops were rushed to the front to confront the Germans and were systematically captured or annihilated. In a famously ill-fated strategy, Polish commanders even sent horsed cavalry into battle against the heavy German armor. By September 8, German forces had reached the outskirts of Warsaw, having advanced 140 miles in the first week of the invasion.

The Polish armed forces hoped to hold out long enough so that an offensive could be mounted against Germany in the west, but on September 17 Soviet forces invaded from the east and all hope was lost. The next day, Poland’s government and military leaders fled the country. On September 28, the Warsaw garrison finally surrendered to a relentless German siege. That day, Germany and the USSR concluded an agreement outlining their zones of occupation. For the fourth time in its history, Poland was partitioned by its more powerful neighbors.

Despite their declaration of war against Germany, Britain and France did little militarily to aid Poland. Britain bombed German warships on September 4, but Chamberlain resisted bombing Germany itself. Though Germans kept only 23 divisions in the west during their campaign in Poland, France did not launch a full-scale attack even though it had mobilized over four times that number. There were modest assaults by France on its border with Germany but these actions ceased with the defeat of Poland. During the subsequent seven months, some observers accused Britain and France of waging a “phony war,” because, with the exception of a few dramatic British-German clashes at sea, no major military action was taken. However, hostilities escalated exponentially in 1940 with Germany’s April invasion of Norway and May invasion of the Low Countries and France.

In June 1941, Hitler attacked the USSR, breaking his nonaggression with the Soviet Union, and Germany seized all of Poland. During the German occupation, nearly three million Polish Jews were killed in the Nazi death camps. The Nazis also severely persecuted the Slavic majority, deporting and executing Poles in an attempt to destroy the intelligentsia and Polish culture. A large Polish resistance movement effectively fought against the occupation with the assistance of the Polish government-in-exile. Many exiled Poles also fought for the Allied cause. The Soviets completed the liberation of Poland in 1945 and established a communist government in the nation.

ENOUGH ALREADY

OK. Enough already.

Let me try and explain myself. First of all, it was not llpoh’s fault. It is nobody’s fault. I’m just mentally burnt out. I seem to have a problem with balancing my life. The daily rage required to keep this blog interesting affects my health. For a couple weeks I’ve sat in front of the computer trying to write part three of my last article. I keep drawing a blank. I don’t know why. I can’t seem to focus or think properly.

I concluded, rightly or wrongly, that trying to write five to ten commentaries per day and live my real life has mentally drained me. It happened back in December and seems to be happening more frequently.

I haven’t left the planet. My goal is to not leave the planet sooner than I want to. Keeping up the  daily rage required to keep this blog growing will probably put me in an early grave. So, I’m just going to step back from the daily commentary.

I’ll post articles I find interesting from other people, but I’m going to try and not get worked up on a daily basis. I hope that my mental faculties return and I can write an occasional article.

I appreciate all of the nice things you’ve said, but I’ve learned far more from you than you will ever know. I won’t pull the plug on this blog because it wouldn’t be fair to all the brilliant, funny, intelligent people who have become like a family to me. A dysfunctional family, but a family none the less.

Thank you for the donations, but this has nothing to do with money or TBP being a business venture. I don’t care about making money. I care about the truth and my kids’ future.

So this isn’t about the end of TBP. I just need to find some sort of balance that doesn’t make me crazier than I already am.

P.S. This is really me. I have not been carted away to a mental institution by the authorities.

No one has threatened me or my family. I just need to step back and get some balance.

Keep throwing the shit.

MUCK ALERT

Who the fuck knows? I certainly don’t. Maybe Muck can check with his sources and give us the answer. I can’t imagine that Obama would be supportive of oil prices going up to $150 a barrel just before the election. Is Netanyahu that crazy? He strikes me as a prick, but not crazy.

Netanyahu ‘Determined to Attack Iran’ Before U.S. Elections, Israeli News Says

Posted on Aug 25, 2012
Abode of Chaos (CC BY 2.0)
 

Israel’s Channel 10 reported this week that Israeli Prime Minister Benjamin Netanyahu “is determined to attack Iran before the U.S. elections” and that Israel is now “closer than ever” to a military strike intended to foil Iran’s nuclear ambitions.

The station’s military reporter said Netanyahu was unlikely to wait for a potential meeting with President Barack Obama in late September. “I doubt Obama could say anything that would convince Netanyahu to delay a possible attack,” the reporter added, before saying that Netanyahu and Israel’s defense minister believe Obama would be pressured to support an attack given the U.S. presidential elections in November.

Ex-CIA analyst Ray McGovern earlier stressed the possibility of such an attack.

—Posted by Alexander Reed Kelly. Follow him on Twitter: @areedkelly.

The Times of Israel:

The TV station’s military reporter Alon Ben-David, who earlier this year was given extensive access to the Israel Air Force as it trained for a possible attack, reported that, since upgraded sanctions against Iran have failed to force a suspension of the Iranian nuclear program in the past two months, “from the prime minister’s point of view, the time for action is getting ever closer.”

Asked by the news anchor in the Hebrew-language TV report how close Israel now was to “a decision and perhaps an attack,” Ben-David said: “It appears that we are closer than ever.”

Read more

CHICAGO – MY KIND OF TOWN

How come when you read the mainstream media versions of these vicious crimes, they never mention that all of the perpetrators are black? They refer to them as rowdy youths. LMFAO. They are nothing but the result of decades of Democratic welfare policies. The black community is responsible for creating these animals and Democratic politicians have encouraged and subsidized these murdering thugs. I thought Philly was bad. Frank is rolling over in his grave.

http://youtu.be/MpCoidxg6Ek

Chicago needs Wyatt Earp

Rick Moran

The last few days have seen an astonishing explosion of violence in the city of Chicago.

Two nights ago, 4 were killed and 15 wounded in a spree where 13 of those victims were shot in just 1/2 an hour.

Last night, one was killed and 16 wounded in another spasm of violence. So far this August, there have been 50 homicides in the city, 15 more than occurred in August, 2011.

This website gives the gory details. Hundreds have been wounded in addition to the record number of homicides.

Meanwhile, police arrested 20 “juveniles” for “rowdy” behavior along the Magnificent Mile. Kids were pushing pedestrians, darting in and out of traffic as police pursued the gang up and down Michigan avenue.

The city is being rocked by lawlessness. Simply put, the streets are unsafe anywhere. There have been a lot of theories about why the sudden outbreak of violence is occurring. Blame is being assigned to Mayor Emanuel or the economic situation that has meant far fewer jobs for young men.

It hardly matters. The question is, what should be done about it?

If Chicago is going to act like a wild west town, they need a wild west solution; Wyatt Earp. Or at least someone with his hard headed, single mindedness (if not his tactics in keeping the peace which could be quite brutal).

Earp and his brother enforced the law. It really is that simple sometimes. New York liberals went ballistic when Mayor Rudy Guiliani began to arrest graffiti “artists,” turnstile jumpers, vandals, and other petty criminals, enforcing laws that had rarely been enforced under previous mayors. It appeared to work. The message that the law would be enforced — along with federal prison guidelines that took violent criminals off the streets for longer periods of time — drove New York’s crime rate down significantly.

Might something like that work in Chicago? Rahmbo better try something quickly. Chicago is turning into a shooting gallery and citizens are living in fear that the next outbreak of violence may target them or their loved ones.


Page Printed from: http://www.americanthinker.com/blog/2012/08/chicago_needs_wyatt_earp.html at August 27, 2012 – 08:05:53 AM CDT

GOVERNMENT DRONES PROTECTING YOU TO DEATH

Another example of government protecting us from savages roaming the streets of Philly and other urban kill zones across the land. They take your taxes and then proceed to function like a drunken retard. A nineteen year veteran officer was gunned down in cold blood by two black animals last week. Now the best part. One of these animals was let out of prison by a government judge and told to stay in his grandma’s house under house arrest. He was supposed to have an electronic monitoring device on his ankle. Guess why he didn’t when he gunned down Moses Walker? The PA Dept of Probations needs a telephone land line for their bracelets to work. His granny didn’t have a land line. These clueless government drones ORDERED this fucking savage to have a land line installed. He had better things to do like killing and robbing. Government at its finest.

If you think government is going to protect you from anything or anyone, you are living in a delusional fantasyland.  

Chancier McFarland, left, and Rafael Jones , accused in Officer Moses Walker Jr.

How accused cop-killer slipped free

By Mark Fazlollah, Mike Newall, and Joseph A. Slobodzian

When a judge on July 25 sentenced alleged cop-killer Rafael Jones for violating his probation on a gun conviction, she ordered him confined to house arrest at his grandmother’s North Philadelphia rowhouse.

But the state Board of Probations and Parole failed to set up the electronic monitoring bracelet mandated by the judge, and Jones never returned to live at the house, his family said Friday.

The day he got out of prison, Aug. 8, Jones was hanging out at 18th and Susquehanna Streets – the corner where he was shot last winter – without the bracelet ordered by Common Pleas Court Judge Susan I. Schulman.

Ten days after that, police say, he and another man stalked and killed Officer Moses Walker Jr. in a pre-dawn robbery attempt.

On Friday, Jones, 23, was arraigned on murder, robbery, firearms, conspiracy and related charges in the shooting of Walker, a 19-year veteran of the force killed while walking home after his shift at the 22d District in North Philadelphia. As is police custom when an officer is killed, Walker’s handcuffs were placed on Jones’ wrists by Walker’s fellow officers from the 22d.

Jones was held without bail and a preliminary hearing was scheduled for Sept. 12 in Municipal Court.

Jones, a thin man with a shaved head, said nothing except to acknowledge his identity and the charges.

Police also issued an arrest warrant Friday for Jones’ alleged accomplice, Chancier McFarland, 19, of the 1400 block of North 23d Street in North Philadelphia.

The circumstances around Jones’ release remain unclear. Although Schulman on July 25 ordered him released to house arrest with electronic monitoring by the state, he did not leave the Curran-Fromhold Correctional Facility until Aug. 8.

On that date, Schulman e-mailed prison officials to release Jones “with instructions to report directly to state parole,” according to a city official who reviewed the e-mail.

Schulman’s e-mail order followed one from a Philadelphia prison system representative, said the official. That e-mail appeared to state that a monitoring system was being set up for Jones.

As a result, Jones walked out of prison that day unfettered, instructed only to report to his state probation officer. He apparently did report in the days after that, a source said, but there is no indication he was ever placed on electronic monitoring.

Jones’ grandmother Ada Banks said Friday afternoon that Jones’ probation officer contacted her before last month’s probation violation hearing, asking if Jones could come live with her.

Banks said she declined. Jones had been shot in the neighborhood earlier this year, she said Friday, and she worried that if he returned to her neighborhood, he would only find trouble.

“This is a house of peace,” she said, surrounded by some of her grandchildren, in front of her Bouvier Street home, just a block from the 22d District station, where the flag hangs at half-staff. “I didn’t need the drama.”

She said the probation officer was in a hurry and told her Jones could be released as soon as that day. Banks said she told the officer that Jones could live with his aunt in West Oak Lane. “He said, ‘I’m just going to tell the judge he’s being released to you, and when he comes to you send him to his aunt’s,” she said.

The probation officer said he would find Jones to get him fitted with the ankle bracelet, Banks said. That never happened, she said.

Banks was not at the July hearing, and her grandson did not stay with her again.

At the hearing, state parole agent Jose Rodriguez recommended that Jones be released on probation and put on electronic monitoring.

Rodriguez told the judge that officers are trained in fitting ankle bracelets and could outfit his home with equipment that would be monitored from Harrisburg – “We get either e-mail alerts, phone call alerts or – should he violate it, leave the house at an unauthorized time.”

But Rodriguez questioned whether Jones could live at his grandmother’s, based on the conversation with her.

Jones’ attorney, Rosemary Zeccardi, told the judge that Jones would be living with with his grandmother.

Neither Rodriguez nor Zeccardi could be reached for comment Friday. Schulman has declined to comment.

Based on the assurance in court, Schulman ordered that Jones serve six months’ house arrest at the grandmother’s home.

And she ordered Rodriguez to get police to detain Jones if he left the house for any reason other than looking for a job, completing his GED, or doing required community service work.

“There will be no other reasons for him to be out of the house,” she said. “None.”

Schulman, who in 2008 sentenced Jones to a four-year prison term for a gun conviction, noted Jones’ juvenile record and warned him that she was not impressed with his record since had finished his sentence in October.

Jones’ juvenile record goes back to age 12, when he was charged with throwing a rock through his mother’s front door. He was arrested at 15 for selling drugs and then caught in a stolen Jeep.

His first gun arrest was when he was 17, when officers said they caught him with a loaded .38-caliber revolver.

“To see that I am concerned about you would be an understatement,” Schulman told Jones.

Jeremy Brooks, Jones’ cousin, said he and Jones’ mother saw Jones hanging on the corner the night he was released.

“I pulled up and said, ‘It’s good to see you,’ ” Brooks said. “He said he was ‘laying back,’ trying to stay out of trouble.”

Jones’ family said the West Oak Lane home where he stayed did not have a phone line, a must for house arrest.

Sherry Tate, a state parole board spokeswoman, said even general information about how her department conducted house arrests and monitoring was confidential.

Police Commissioner Charles H. Ramsey, asked about the apparent failures between the state probation and justice systems, said, “Right now our focus is simple – getting the second person in custody so we can wrap this up.”

About Jones, he said: “Thank God we got him and he won’t be able to harm anyone else, and this time perhaps the system will put him away for the rest of his miserable life.”

OBAMA SAID GM WAS A SUCCESS STORY

Have you heard Obama and his minions bursting with pride over their “successful” saving of GM? The storyline perpetuated by the MSM and political hacks is that General Motors has been reborn and his doing fantastic. After the taxpayers ate all of their debt in bankruptcy, these marketing geniuses are on track to make 35% less income on flat revenue in 2012 versus 2011. The stock is down 45% since January 2011. Has Obama and the big fans of government bailouts mentioned this on CNBC lately?

Chart forGeneral Motors Company (GM)

Not only are their financial results horrific, they’re also fraudulent and supported by government debt, with the future losses going to you. GM has been channel stuffing for the last two years. They record sales when they force their dealers to take delivery of their Volts. The dealers don’t have any demand for these piece of shit GM lemons, but GM keeps reporting “strong” sales. They’ve stuffed 67% more automobiles down the gullets of their dealers in a fraudulent effort to appear successful. The dealers have reached capacity. Maybe Obama can create a car lot on the White House grounds for his union pals at GM.

Who could ever forget our friends at GMAC/Ditech? They were the automobile and housing subprime loan specialists in the good old days of the 2003 – 2008. You bailed them out to the tune of $20 billion. They decided to change their name for some reason. They are known as Ally Bank and are still 85% owned by YOU/Obama. As you can witness in the mean streets of West Philly, any lowlife subprime dirtbag can get a loan from Ally Financial these days. If I was a non-trusting soul, I might think that Obama and his buddy Geithner have given a wink and a nod to Ally and the other Wall Street shyster banks to open the flood gates on loans to people who won’t pay YOU back.

So keep supporting the huge GM success story. I love fairy tales.

DEATH OF THE MIDDLE CLASS

Some of the figures in this report shocked even me. The last chart is almost mind boggling. The middle and lower income families have the same median net worth they had in 1983. After three decades of debt financed delusion, most families haven’t advanced one penny. But the upper income families have increased their net worth by $267,000. Did the upper income people just work harder or did they rig the game in their favor? Were the majority of Americans just lazy and stupid or did the upper income executives ship their jobs overseas in order to boost stock prices and goose their own net worth? Did the people at the top use propaganda and lies to convince the majority that a debt based consumer economy would make them rich? Were these people at the top the issuers and beneficiaries of the debt? You can look at the data and make up your own mind. 

Released:    August 22, 2012

The Lost Decade of the Middle Class

Fewer, Poorer, Gloomier


Chapter 1: Overview

As the 2012 presidential candidates prepare their closing arguments to America’s middle class, they are courting a group that has endured a lost decade for economic well-being. Since 2000, the middle class has shrunk in size, fallen backward in income and wealth, and shed some—but by no means all—of its characteristic faith in the future.

These stark assessments are based on findings from a new nationally representative Pew Research Center survey that includes 1,287 adults who describe themselves as middle class, supplemented by the Center’s analysis of data from the U.S. Census Bureau and Federal Reserve Board of Governors.

Fully 85% of self-described middle-class adults say it is more difficult now than it was a decade ago for middle-class people to maintain their standard of living. Of those who feel this way, 62% say “a lot” of the blame lies with Congress, while 54% say the same about banks and financial institutions, 47% about large corporations, 44% about the Bush administration, 39% about foreign competition and 34% about the Obama administration. Just 8% blame the middle class itself a lot.

Their downbeat take on their economic situation comes at the end of a decade in which, for the first time since the end of World War II, mean family incomes declined for Americans in all income tiers. But the middle-income tier—defined in this Pew Research analysis as all adults whose annual household income is two-thirds to double the national

median 1 —is the only one that also shrunk in size, a trend that has continued over the past four decades.

In 2011, this middle-income tier included 51% of all adults; back in 1971, using the same income boundaries, it had included 61%. 2 The hollowing of the middle has been accompanied by a dispersion of the population into the economic tiers both above and below. The upper-income tier rose to 20% of adults in 2011, up from 14% in 1971; the lower-income tier rose to 29%, up from 25%. However, over the same period, only the upper-income tier increased its share in the nation’s household income pie. It now takes in 46%, up from 29% four decades ago. The middle tier now takes in 45%, down from 62% four decades ago. The lower tier takes in 9%, down from 10% four decades ago.

For the middle-income group, the “lost decade” of the 2000s has been even worse for wealth loss than for income loss. The median income of the middle-income tier fell 5%, but median wealth (assets minus debt) declined by 28%, to $93,150 from $129,582. 3 During this period, the median wealth of the upper-income tier was essentially unchanged—it rose by 1%, to $574,788 from $569,905. Meantime, the wealth of the lower-income tier plunged by 45%, albeit from a much smaller base, to $10,151 from $18,421.

Which Presidential Candidate Is Better for the Middle Class?

As the 2012 presidential campaign heads toward the party conventions and the fall climax, no group has been the target of more electioneering appeals than America’s beleaguered middle class. The Pew Research survey finds that neither candidate has sealed the deal with middle-class adults but that President Obama is in somewhat better shape than his Republican challenger, Mitt Romney. 4

About half (52%) of adults who self-identify as middle class say they believe Obama’s policies in a second term would help the middle class, while 39% say they would not help. By comparison, 42% say that Romney’s election would help the middle class, while 40% say it would not help. There is much more variance in the judgments of the middle class about the likely impact of the two candidates’ policies on the wealthy and the poor. Fully seven-in-ten (71%) middle-class respondents say Romney’s policies would help the wealthy, while just a third (33%) say they would help the poor. Judgments about Obama tilt the opposite way. Roughly four-in-ten (38%) middle-class respondents say his policies would help the wealthy, and about six-in-ten (62%) say they would help the poor.

Who Is Middle Class?

In addition to looking at a “statistical middle” derived from government data, this report looks at those who self-identify as middle class, based on a Pew Research Center national survey of 2,508 adults. In the survey, 49% of adults describe themselves as middle class; 53% said the same in a similar survey in early 2008, when what is now known as the Great Recession was gathering steam. That recession, according to the National Bureau of Economic Research, began in December 2007 and ended in June 2009.

The 2012 survey finds an increase in those who self-identify as being in the lower or lower-middle class—32% place themselves in these categories, up from 25% in 2008. And 17% now say they are in the upper or upper-middle class, down from 21% in 2008.

Noteworthy patterns by race, age and gender are present in all of these self-categorizations.

Similar shares of whites (51%), blacks (48%) and Hispanics (47%) say they are middle class, even though government data show that whites have a higher median income and much more wealth than blacks or Hispanics.

Adults ages 65 and older (63%) are more inclined than all other age groups to call themselves middle class and less inclined to say they are lower class (20%). Meantime, younger adults (those ages 18 to 29) are more likely to say they are in the lower or lower-middle class; fully 39% say this now, compared with 25% who said so in 2008.

Men (46%) are somewhat less likely than women (53%) to include themselves in the middle class. In 2008, a somewhat larger share of men (51%) said they were middle class, and 54% of women said they were.

Falling Behind, Moving Ahead

When middle-class Americans size up their personal economies, they see themselves as both moving ahead and falling behind. It all depends on the time frame. Over the short term, their evaluations tilt negative. Over the span of the past decade, they’re mixed. And over the full arc of their lives, they’re positive—albeit less so now than in the past.

The Great Recession officially ended three years ago, but most middle-class Americans are still feeling pinched. About six-in-ten (62%) say they had to reduce household spending in the past year because money was tight, compared with 53% who said so in 2008.

The downbeat short-term perspective is not surprising in light of the heavy economic blows delivered by the Great Recession of 2007-2009 and the sluggish recovery since. About four-in-ten (42%) middle-class adults say their household’s financial situation is worse now than it was before the recession, while 32% say they are in better shape; an additional 23% volunteered that their finances are unchanged. Of those who say they’re in worse shape, about half (51%) say it will take at least five years to recover, including 8% who predict they will never recover.

Asked to compare their financial situation now with what it was 10 years ago, the evaluations of the middle class are more evenly divided. Some 44% say they are more financially secure than they had been, and 42% say less. (An additional 12% volunteered that it’s about the same.)

Over the longer term, the evaluations grow more positive. Six-in-ten (60%) say their standard of living is better than that of their parents at the same age, 24% say it is the same and just 13% say it is worse. However, these evaluations were even rosier four years ago, when 67% said they were doing better than their parents at the same age.

Does Hard Work Pay Off?

In addition to their scaled-back judgments about how they are doing personally, Americans have a bit less faith in their long-held beliefs about the efficacy of hard work.

Two-thirds of the middle class (67%) agree that “most people who want to get ahead can make it if they are willing to work hard,” while 29% agree that “hard work and determination are no guarantee of success for most people.” Among the general public, the shares are similar—63% say hard work pays off, while 34% say it does not necessarily lead to success. The Pew Research Center has asked this question 10 times since 1994, when 68% of the public agreed that hard work would pay off. The proportion saying so peaked in 1999, when roughly three-quarters (74%) expressed that view.

Looking Ahead with Muted Hope

Middle-class Americans look to the economic future—their own, their children’s, and the nation’s—with a mix of apprehension and muted optimism.

About a quarter (23%) say they are very confident that they will have enough income and assets to last throughout their retirement years; an additional 43% say they are somewhat confident and 32% say they are not too or not at all confident.

As for their children’s economic future, some 43% of those in the middle class expect that their children’s standard of living will be better than their own, while 26% think it will be worse and 21% think it will be about the same. Four years ago, in response to the same question, the middle class had higher hopes for their offspring, with 51% predicting they would have a better standard of living and 19% thinking it would be worse.

As for the nation as a whole, the verdict from the middle class is likewise muted. Only about one-in-ten (11%) say they are very optimistic about the country’s long-term economic future, 44% are somewhat optimistic and 41% are somewhat or very pessimistic.

Does Partisan Affiliation Influence Economic Perceptions?

As is true of the population overall, more members of the middle class identify with or lean toward the Democratic Party (50%) than with the Republican Party (39%), with 11% declining to take sides. These partisan affiliations are correlated with the economic attitudes and perceptions of survey respondents in ways that often run contrary to their actual economic circumstances, a pattern evident in many Pew Research surveys conducted since 2008, when the recession took hold and Barack Obama was elected president.

Many of the demographic groups that have fared the worst during the recession—including young adults (ages 18 to 24), blacks and Hispanics—have the most upbeat assessments of their own economic mobility, their children’s economic prospects and the nation’s economic future.

These groups are all heavily Democrats and supporters of President Obama. For example, young adults are more optimistic than older adults about the nation’s long-term economic future (67% of adults ages 18 to 24 vs. 52% of adults ages 35 and older), and blacks (78%) and Hispanics (67%) are more optimistic than whites (48%). The same patterns play out in many evaluations of personal finances.

Partisan differences also affect the way members of the middle class apportion blame for the economic difficulties the middle class has endured over the past decade. Sizable gaps exist on whether a lot of blame belongs with large corporations (Democrats 59% vs. Republicans 27%) and banks and other financial institutions (Democrats 62% vs. Republicans 40%). However, similar majorities of both groups blame Congress (63% for Democrats and 58% for Republicans).


Cost To Lead a Middle-class Life

The survey also asked how much annual income a family of four would need to lead a middle-class lifestyle. The median response among those who consider themselves middle class is $70,000, meaning that half of middle-class adults say it would take more than $70,000 annually and half say it would take less than that amount.

Public estimates of how much money it takes for a family of four to live a middle-class lifestyle are quite close to the Pew Research Center’s analysis based on U.S. Census Bureau data that the median income for a four-person household is $68,274. 5

As expected from the varying cost of living across the country, the annual family income seen as necessary for a middle-class lifestyle is a median of $85,000 in the East and $60,000 in the Midwest (with a median of $70,000 in both the South and the West). Similarly, the median among middle-class adults living in rural areas is $55,000; among suburban and urban dwellers, it is $75,000 and $70,000, respectively.

Income Trends from Government Data

The economic narrative the middle class tells about itself through its responses to the Pew Research survey is consistent with the story told by government economic and demographic trend data. For the half century following World War II, American families enjoyed rising prosperity in every decade—a streak that ended in the decade from 2000 to 2010, when inflation-adjusted family income fell for the middle income as well as for all other income groups, according to U.S. Census Bureau data. 6

A Pew Research Center analysis of long-term census data also finds that those in the upper-income tier now take in a much larger share of U.S. aggregate household income than they did four decades ago, while those in the middle tier take in a much lower share. (For the purpose of this analysis, the middle tier is defined as those living in households with an annual income

that is 67% to 200% of the national median; the upper tier is made up of those in households above the 200% threshold, and the lower tier is made up of those below the 67% threshold.)


The Pew Research analysis finds that upper-income households accounted for 46% of U.S. aggregate household income in 2010, compared with 29% in 1970. Middle-income households claimed 45% of aggregate income in 2010, compared with 62% in 1970. Lower-income households had 9% of aggregate income in 2010 and 10% in 1970.

These shifts result from two trends: larger income gains for upper-income households than for others and a decline in the share of adults who live in middle-income households. From 1970 to 2010, median incomes rose 43% for upper-income households, 34% for middle-income households and 29% for lower-income households. Over the same four decades, the share of the adult population living in upper-income households rose to 20% from 14%; for middle-income households, it fell to 51% from 61%; and for lower-income households, it rose to 29% from 25%.

Winners and Losers

Even as the share of Americans in the middle has declined, the income status has improved for some demographic groups and deteriorated for others. This report classified groups into winners and losers by comparing changes over time in their shares in the upper- and lower-income tiers.

From 2001 to 2011, there were distinct differences by age: Adults ages 65 and older were the greatest winners, while other age groups were economic losers. The widowed and currently married were winners, while those who never married or who were divorced or separated were economic losers. Age helps explain some differences by marital status. Widowed and currently married adults tend to be older than those who never married. Adults with only a high school diploma were among the groups that lost the most ground, although college graduates also experienced a small loss.

Over the longer term—1971 to 2011—older adults fared better than younger ones, married adults fared better than the unmarried, and college-educated adults fared better than those with less education.

Wealth, Assets and Debt

The net worth of middle-income families—that is, the sum of assets minus debts—also took a hit during the past decade, according to data for 2001 to 2010 from the Federal Reserve’s Survey of Consumer Finances. Median net worth fell 28%, to $93,150, erasing two decades of gains.

Wealth of middle-income families had been unchanged from 1983 to 1992, then grew sharply—by 43%—from 1992 to 2001, and continued to grow in the 2001-2007 period, by 18%. Net worth of middle-income families dropped 39% in the later years of the decade as the housing market crash and Great Recession wiped out the previous advances. Over the 1983 to 2010 period, only upper-income families registered strong increases in wealth.

Breaking apart the two components of net worth—assets and liabilities—the value of assets grew more than the level of debt in dollar terms from 1983 to 2001 and from 2001 to 2007 for all families and for middle-income families. For middle-income families, though, the rate of increase in debt was larger than the rate of increase in assets during both periods. From 2007 to 2010, mean debt level for middle-income families fell 11%, or $11,040, but the value of their assets fell even more, by 19%, or $75,621.

One reason that upper-income families fared better than others is that they are less dependent on home equity, which has been the main source of declines in wealth since 2006. Home equity accounted for at most 24% of the mean assets of upper-income families from 1983 to 2010, compared with at least 40% of the assets of middle-income families during the same period.

About the Authors

This report was edited by Paul Taylor, executive vice president of the Pew Research Center and director of its Social & Demographic Trends project, who also co-wrote Chapter 1. Senior editor Rich Morin led the team that drafted the questionnaire; he also co-wrote Chapter 3 with research assistant Eileen Patten and wrote Chapter 5. Senior writer D’Vera Cohn co-wrote Chapter 1 and wrote Chapter 2; senior researcher Cary Funk wrote Chapter 4. Chapters 6 and 7 were written by associate director for research Rakesh Kochhar and senior research associate Richard Fry. Research assistant Seth Motel and Patten helped with the preparation of charts, and Patten formatted the final report. Patten and Motel also numbers-checked the report. Social & Demographics Trend project associate director Kim Parker and research associate Wendy Wang assisted on all aspects of the research project.

About the Report

The remainder of this report is organized as follows: Chapter 2 provides a detailed demographic profile of those who described themselves as middle class in the Pew Research survey. Chapter 3 reports how well middle-class Americans say they have fared financially in the past decade. Chapter 4 examines social mobility, including whether middle-class Americans believe they have done better or worse in life than their parents, their expectations for their children, and asks Americans how much money is needed to lead a middle-class life. Chapter 5 examines the politics of the middle class, including their judgments about the political parties and presidential candidates on matters related to the middle class. Chapter 6 uses an income-based definition of the middle tier derived from U.S. Census Bureau data to analyze economic and demographic trends over the past 60 years, with a special focus on the past decade. Chapter 7 also uses government data to conduct a detailed analysis of trends in both wealth and income from 1983 to 2011, with a special focus on the decline in wealth since 2007 among different income groups.

About the Data

The income, wealth and demographic data come from two primary sources. The demographic and household income data reported in Chapter 6 are derived from the Current Population Survey, Annual Social and Economic Supplements (ASEC) conducted in March of every year. Income is reported for the year prior to the survey year (e.g., 2010 income is reported in the 2011 survey). The specific files used in this report are from March 1971 to March 2011, the latest year for which ASEC data are available. Conducted jointly by the U.S. Census Bureau and the Bureau of Labor Statistics, the CPS is a monthly survey of approximately 55,000 households and is the source of the nation’s official statistics on unemployment. Additionally, the mean family income numbers in Chapter 6 are derived from the U.S. Census Bureau’s Historical Income Tables. The wealth data in Chapter 7 are derived from the Survey of Consumer Finances (SCF), which is sponsored by the Federal Reserve Board of Governors and the Department of Treasury. It has been conducted every three years since 1983 and is designed to provide detailed information on the finances of U.S. families. The SCF sample typically consists of approximately 4,500 families, but the 2010 survey included about 6,500 families. For more details, see Appendix 2.

The general public survey is based on telephone interviews conducted July 16-26, 2012, with a nationally representative sample of 2,508 adults ages 18 and older, including 1,287 respondents who identified themselves as “middle class.” The survey included an oversample of 407 non-Hispanic blacks and 377 Hispanics. A total of 1,505 interviews were completed with respondents contacted by landline telephone and 1,003 with those contacted on their cellular phone. Data are weighted to produce a final sample that is representative of the general population of adults in the continental United States. Survey interviews were conducted in English and Spanish under the direction of Princeton Survey Research Associates International. Margin of sampling error is plus or minus 2.8 percentage points for results based on the total sample, 3.9 percentage points for those in the middle class, 5.7 percentage points for non-Hispanic blacks and 5.5 percentage points for the Hispanic subsamples at the 95% confidence level. For more details, see Appendix 3.

Notes on Terminology

Race/Ethnicity: Hispanics are of any race. Whites and blacks include only non-Hispanics.

Education: “High school or less” refers to those who either did not finish high school or who graduated high school (with a regular diploma or its equivalent, such as a GED) but did not obtain any college education. The educational level “some college” refers to those who do not have a four-year college degree, but have completed some college credits, including those who received associate degrees. “College graduate” refers to anyone with at least a bachelor’s degree, including those with a graduate or professional degree.

Net Worth: The difference between the value of assets owned by a household (such as home, stocks and savings accounts) and its liabilities (such as mortgages, credit card debt and loans for education). The terms “net worth” and “wealth” are used interchangeably in this report.

Income Tiers: Analysis based on census data refers to lower-, middle- and upper-income groups, or tiers. Using income as the criterion, the middle tier is defined as those living in households with an annual income that is two-thirds to double (67% to 200%) the national median; the upper tier is made up of those in households above the 200% threshold, and the lower tier is made up of those below the 67% threshold. The assignment of a household to a tier depends on what its income expressed in 2011 dollars is estimated to be after it is scaled to a three-person household (see Appendix 2 for details on the adjustment process).

Social Classes: In survey-based analysis, assignment into the lower, middle or upper classes is based on a respondent’s answer to the following question: “If you were asked to use one of these commonly used names for the social classes, which would you say you belong in? The upper class, upper-middle class, middle class, lower-middle class or lower class?” Respondents who say they are upper or upper-middle are combined into a single “upper-class” category; respondents who say they are lower or lower-middle are combined into a single “lower-class” category. The size of the middle group, whether based on household income in 2010 or based on self-described class in the 2012 survey, turns out to be nearly identical.

  1. This income range is $39,418 to $118,255 in 2011 dollars. As explained in Appendix 2, incomes are adjusted for household size and then scaled to reflect a three-person household.
  2. In the U.S. Census Bureau’s Current Population Survey, the source of the income analysis in this report, respondents are asked to provide household income data for the calendar year prior to the year of the survey (e.g., 2010 income is reported in the 2011 survey). This means, for example, that 51% of adults in 2011 were in the middle-income tier based on the incomes they reported for 2010. For this reason, income data in this report cover the 1970 to 2010 period and the demographic data cover the 1971 to 2011 period.
  3. Due to data limitations, change over time for wealth is measured from 2001 to 2010 rather than 2000 to 2010. For an explanation of data sources, see Appendix 2. 
  4. Interviewing for the survey ended in late July, nearly three weeks before Romney selected Rep. Paul Ryan of Wisconsin to be his running mate and a month before the GOP convention was to convene in Tampa. 
  5. Pew Research Center estimate of 2010 calendar year income (in 2011 dollars) from the Current Population Survey, Annual Social and Economic Supplement, March 2011. Incomes are adjusted for household size and scaled to reflect a four-person household.
  6. Due to data limitations, this set of trend data tracks income for families (related people living in the same housing unit), while most other data analyzed in this report is based on income for households (all people living in the same housing unit). For an explanation, see page 58. 

LATEST FASHION IN WEST PHILLY

I guaranfuckingtee you I will see some brothers walking down 36th Street in West Philly in their $315 Lebron James sneakers, talking on their iPhone, wearing their $150 throwback Jordan Jersey, and headed to the corner store to try and buy some Colt 45 with their EBT card in the next two weeks. Vote Obama on November 6 and get a free pair of Lebrons, courtesy of the American taxpayer.

Nike charging $315 for new LeBron James sneaker

NEW YORK (MarketWatch) — Nike Inc. /quotes/zigman/235840/quotes/nls/nkeNKE+0.25% will charge about $315 for a pair of their new LeBron X basketball sneakers as part of an overall price hike for its athletic shoes, The Wall Street Journal reported on Tuesday. Overall, Nike will raise shoe and clothing prices by 5% to 10% in the face of increased costs for labor, materials and shipping, the newspaper reported, citing analysts. The new LeBron X shoe, named after LeBron James, who led the Miami Heat to win the NBA title in June, will feature motion sensors that measure how high the wearer jumps, the newspaper said. Currently, the LeBron 9 PS Elite basketball shoe sells at retail for $250.

IGNORANCE IS A CHOICE WITH CONSEQUENCES

Not only are there 165 million members of the free shit army out there, but they are also the most ignorant mass of humanity in U.S. history. When you examine the statistics and see the results achieved by our government run union public school system at an annual cost of  $10,600 per student, you have to wonder whether this was done on purpose. Did our owners purposely create an educational system designed to keep the masses ignorant, stupid and unable to think critically? Did they set out to keep us so stupid we wouldn’t be able to figure out how badly they were screwing us? Or is the mass ignorance in this country the result of individuals and families just not caring about learning, questioning, and having a desire to better themselves? Why study hard, work hard, and read books for fun, when the government provides the minimal level of subsistence to those who do nothing?

I believe it’s a combination of factors. Our owners and their politician puppets prefer an ignorant apathetic public who don’t understand math. It allows them to pillage the wealth of the nation and pass the bill to future generations. The selfishness and inherent laziness of a vast swath of the American populace is a perfect fit for the owners’ master plan. All is going swimmingly. It seems Fat, Drunk and Stupid is the way to go through life.

The kids are not alright

By Jack Kelly

The kids are in peril. The unemployment rate among Americans aged 18-29 is 50 percent higher than the national average. More than 43 percent of recent college graduates who have jobs do work which does not require a college education.

If the Obama administration policies which keep unemployment high are reversed, for most of us, the recession will end. But the kids will still be screwed, because they don’t know what they need to know to survive in the global economy.

The key is STEM education — Science, Technology, Engineering, Mathematics. The United States used to be the world’s leader. Today, we’re one of just three of the 34 countries in the Organization for Economic Cooperation and Development where the kids know no more about these subjects than their parents did.

The kids don’t know much of anything else, either. More than half of high school seniors scored “below basic” in their knowledge of history, according to the National Assessment of Education Progress.

In a National Geographic survey, half of Americans aged 18-24 couldn’t find New York state on a map. Only 3 percent of high school students could pass the citizenship test foreigners take to become Americans, a survey in Oklahoma found. Only a handful of the roughly 6,000 students who’ve passed through his classroom know how to form a sentence or write an intelligible paragraph, a retiring high school teacher told Mark Morford of the San Francisco Chronicle.

“If you think education is expensive, try ignorance,” said Harvard University president Derek Bok (1971-1991).

Boy, was he right! For the monumental ignorance described above, we spend, on average, $10,615 per pupil in the public schools. That’s almost 250 percent more, in real terms, than we spent in 1970, when students were learning.

Kids today don’t even know how little they know. “Many students tell me that they are the most well-informed generation in history,” said George Mason University professor Rick Shenkman.

If we had more teachers, and paid them more, the problem would be solved, teacher unions say. Since 1970, the number of teachers and administrators in public schools has risen 11 times faster than enrollment. This has meant more union dues, more campaign contributions for Democrats. But students learn less.

Not because teachers are underpaid. Their compensation is 150 percent more than for private sector workers with similar skills, according to a study last year by the Heritage Foundation and the American Enterprise Institute. On an hourly basis, teachers earn more than most accountants, architects and nurses.

There are many good teachers. It isn’t they who teacher unions represent. If we got rid of the worst 5 to 7 percent of teachers, that alone would lift our schools back among the world’s best, said the Hoover Institution’s Eric Hanushek. But it’s for that 5 to 7 percent that teacher unions go to bat.

About 30 percent of high school students studying math, 60 percent studying the physical sciences, are taught by teachers who did not major in the subject in college, or are not certified to teach it.

“How in the world can we expect our students to master science and technology when their teachers may not have mastered it?” asked U.S. News publisher Mortimer Zuckerman.

The retired or layed-off professionals who could close the gap are kept out of the classroom because they haven’t taken the dreck education courses the cartel has made prerequisites.

Schools of education are by no means the only reason why things are as bad — or worse — at the next level. Students are more likely to leave college with massive debt than with marketable skills.

For Democrats, support for “education” means giving teacher unions whatever they want. More Americans disagree. In Gallup’s annual poll in June, only 29 percent expressed confidence in public schools, the lowest level ever recorded. That’s down from 58 percent when Gallup first asked the question in 1973.

“How much ignorance can a country stand?” Mr. Shenkman asked. “There have to be terrible consequences when it reaches a certain level.”

We’ll find out soon what those consequences are, Mr. Morford’s teacher friend thinks. To “escape what he sees will be the surefire collapse of functioning American society in the next handful of years,” he’s considering moving out of the country.

JWR contributor Jack Kelly, a former Marine and Green Beret, was a deputy assistant secretary of the Air Force in the Reagan administration.


FREE SH*T ARMY LINES UP FOR FREE SHIT

As I travelled my usual route into work this morning through the badlands of West Philly, I witnessed the usual Thursday morning phenomenon. I usually make my way down 36th Street between 7:00 am and 7:30 am every day. I never get stuck in traffic on this route as no one in this community is rushing off to work in the morning. I rarely see any human beings in Mantua in the morning. Bustling is not a word that describes this section of West Philly. They are snug in their government issued posturepedic beds, in their government subsidized low income luxury townhouses, watching their government subsidized Direct TV, and munching on pork rinds and cheetos bought with their EBT card.

Thursday mornings are different. There is a large non-descript building on the corner of 36th & Haverford Ave. housing the Grace Lutheran Evangelical Church. Below is a partial picture of the building.

On Thursday’s there is a long line of folks with their grocery carts in tow lined up in front of this building. They even bring their own chairs to stake out their position in line. By my estimation they are lined up two hours before they open the doors. It is sort of a Black Friday in Squalorville. This morning there was even a dude in his government subsidized Hoveround in line. Did you know those hoverounds are practically free? I couldn’t help noticing that 80% of the people waiting for the free food were obese. I thought the point of distributing food to poor people was to prevent them from starving. It sure is working, because there were no famished people in that line. 

I’m a big fan of those who are well off, donating food and money to foodbanks to help those less fortunate. But I have a sneaking suspicion that the “free” food being distributed to the fine folks in West Philly has been donated at gunpoint by your tax dollars. The government has taken over deciding how charity should function. It’s almost as if the Savior himself was handing out the food to his people. I wonder if I would get any funny looks if I parked my car, got out and joined the ranks of the Free Shit Army in the line. It would probably make for a humourous post if I lived to tell it.

I wonder how many people would line up if they were distributing brooms, trash bags, paint brushes and hammers and requesting that these people clean up their neighborhood? What a silly question. That’s the government’s responsibility.

The Free Shit Army marches onward to its rendevous with destiny.


Here is a link to google maps. If you click Grace Evangelical Lutheran Church and then go to Street View, you can experience my morning commute firsthand. If you cruise down 36th street, you can see some beautiful murals of black people doing great things. You may see a few $25,000 hovels with a few $60,000 Escalades parked nearby.

http://maps.google.com/maps?um=1&hl=en&q=36th%20%26%20Haverford%20ave%20west%20phila%20grace%20evangelical%20lutheran%20church&bav=on.2,or.r_gc.r_pw.r_qf.&biw=1600&bih=695&wrapid=tlif134514162532911&ie=UTF-8&sa=N&tab=il

You know who will be showing up at the food bank sometime today.