ARE YOU SEEING WHAT I’M SEEING?

Is it just me, or are the signs of consumer collapse as clear as a Lowes parking lot on a Saturday afternoon? Sometimes I wonder if I’m just seeing the world through my pessimistic lens, skewing my point of view. My daily commute through West Philadelphia is not very enlightening, as the squalor, filth and lack of legal commerce remain consistent from year to year. This community is sustained by taxpayer subsidized low income housing, taxpayer subsidized food stamps, welfare payments, and illegal drug dealing. The dependency attitude, lifestyles of slothfulness and total lack of commerce has remained constant for decades in West Philly. It is on the weekends, cruising around a once thriving suburbia, where you perceive the persistent deterioration and decay of our debt fixated consumer spending based society.

The last two weekends I’ve needed to travel the highways of Montgomery County, PA going to a family party and purchasing a garbage disposal for my sink at my local Lowes store. Montgomery County is the typical white upper middle class suburb, with tracts of McMansions dotting the landscape. The population of 800,000 is spread over a 500 square mile area. Over 81% of the population is white, with the 9% black population confined to the urban enclaves of Norristown and Pottstown.

The median age is 38 and the median household income is $75,000, 50% above the national average. The employers are well diversified with an even distribution between education, health care, manufacturing, retail, professional services, finance and real estate. The median home price is $300,000, also 50% above the national average. The county leans Democrat, with Obama winning 60% of the vote in 2008. The 300,000 households were occupied by college educated white collar professionals. From a strictly demographic standpoint, Montgomery County appears to be a prosperous flourishing community where the residents are living lives of relative affluence. But, if you look closer and connect the dots, you see fissures in this façade of affluence that spread more expansively by the day. The cheap oil based, automobile dependent, mall centric, suburban sprawl, sanctuary of consumerism lifestyle is showing distinct signs of erosion. The clues are there for all to see and portend a bleak future for those mentally trapped in the delusions of a debt dependent suburban oasis of retail outlets, chain restaurants, office parks and enclaves of cookie cutter McMansions. An unsustainable paradigm can’t be sustained.

The first weekend had me driving along Ridge Pike, from Collegeville to Pottstown. Ridge Pike is a meandering two lane road that extends from Philadelphia, winds through Conshohocken, Plymouth Meeting, Norristown, past Ursinus College in Collegeville, to the farthest reaches of Montgomery County, at least 50 miles in length. It served as a main artery prior to the introduction of the interstates and superhighways that now connect the larger cities in eastern PA. Except for morning and evening rush hours, this road is fairly sedate. Like many primary routes in suburbia, the landscape is engulfed by strip malls, gas stations, automobile dealerships, office buildings, fast food joints, once thriving manufacturing facilities sitting vacant and older homes that preceded the proliferation of cookie cutter communities that now dominate what was once farmland.

Telltale Signs


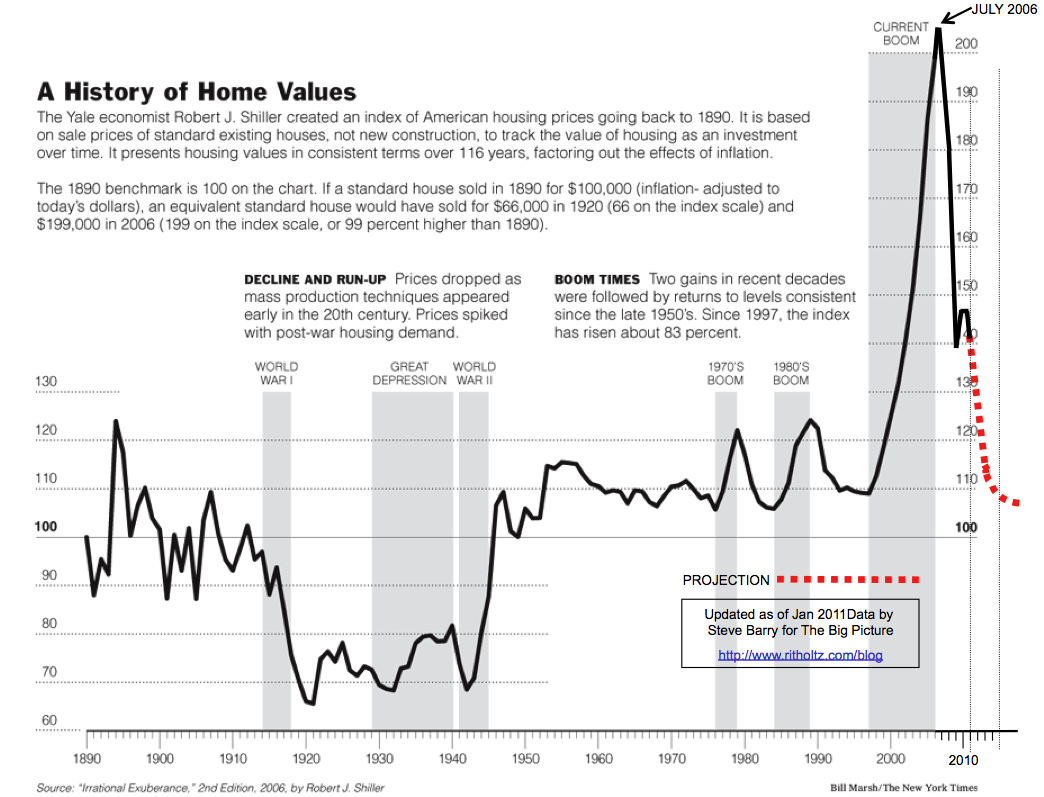
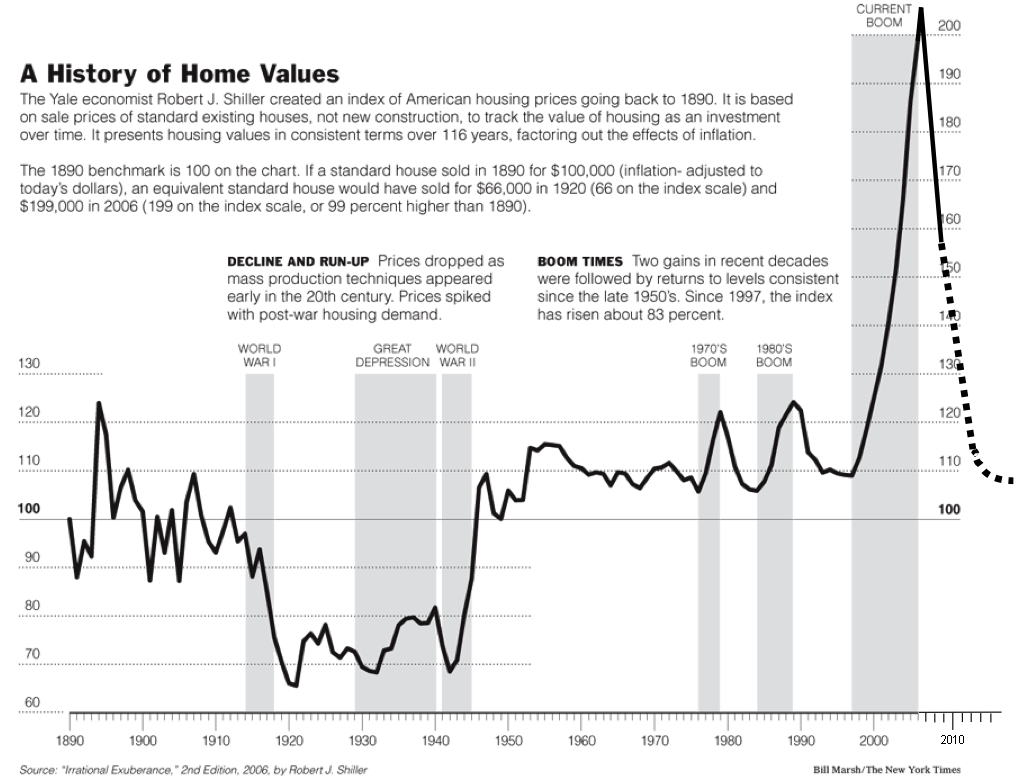
I should probably be keeping my eyes on the road, but I can’t help but notice the telltale signs of an economic system gone haywire. As you drive along, the number of For Sale signs in front of homes stands out. When you consider how bad the housing market has been, the 40% decline in national home prices since 2007, the 30% of home dwellers underwater on their mortgage, and declining household income, you realize how desperate a home seller must be to try and unload a home in this market. The reality of the number of For Sale signs does not match the rhetoric coming from the NAR, government mouthpieces, CNBC pundits, and other housing recovery shills about record low inventory and home price increases.

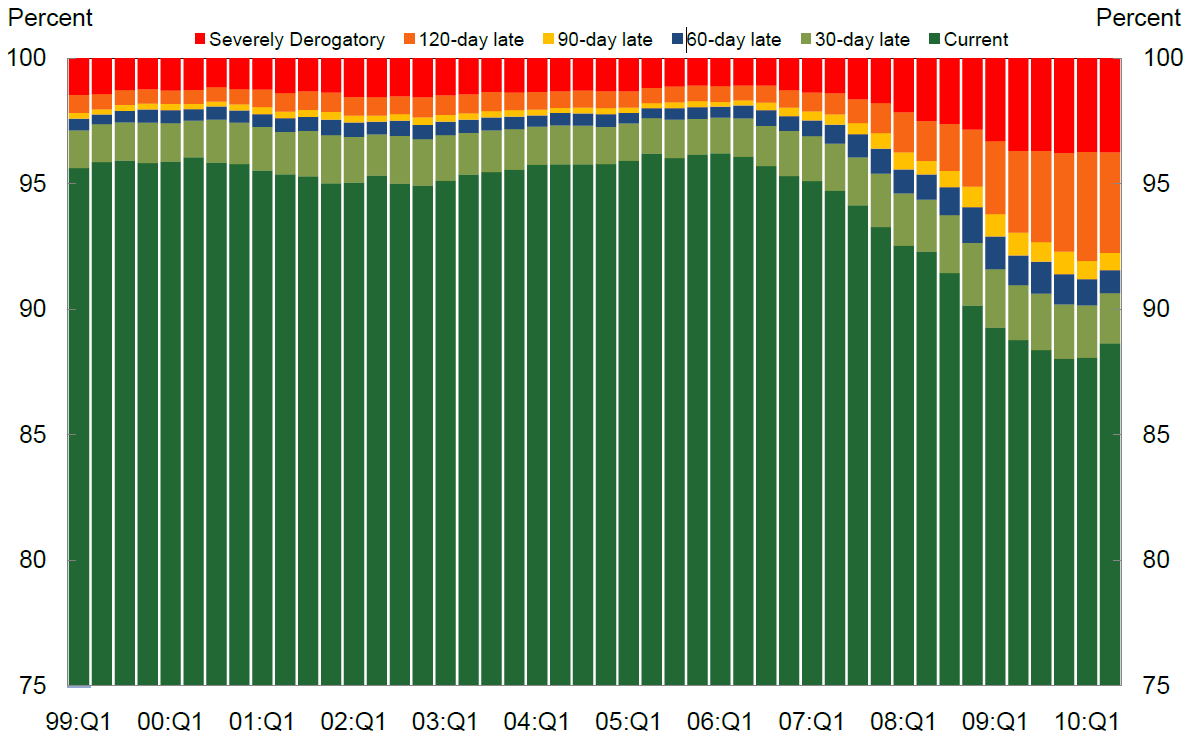
The Federal Reserve/Wall Street/U.S. Treasury charade of foreclosure delaying tactics and selling thousands of properties in bulk to their crony capitalist buddies at a discount is designed to misinform the public. My local paper lists foreclosures in the community every Monday morning. In 2009 it would extend for four full pages. Today, it still extends four full pages. The fact that Wall Street bankers have criminally forged mortgage documents, people are living in houses for two years without making mortgage payments, and the Federal Government backing 97% of all mortgages while encouraging 3.5% down financing does not constitute a true housing recovery. Show me the housing recovery in these charts.

Existing home sales are at 1998 levels, with 45 million more people living in the country today.

New single family homes under construction are below levels in 1969, when there were 112 million less people in the country.

Another observation that can be made as you cruise through this suburban mecca of malaise is the overall decay of the infrastructure, appearances and disinterest or inability to maintain properties. The roadways are potholed with fading traffic lines, utility poles leaning and rotting, and signage corroding and antiquated. Houses are missing roof tiles, siding is cracked, gutters astray, porches sagging, windows cracked, a paint brush hasn’t been utilized in decades, and yards are inundated with debris and weeds. Not every house looks this way, but far more than you would think when viewing the overall demographics for Montgomery County. You wonder how many number among the 10 million vacant houses in the country today. The number of dilapidated run down properties paints a picture of the silent, barely perceptible Depression that grips the country today. With such little sense of community in the suburbs, most people don’t even know their neighbors. With the electronic transfer of food stamps, unemployment compensation, and other welfare benefits you would never know that your neighbor is unemployed and hasn’t made the mortgage payment on his house in 30 months. The corporate fascist ruling plutocracy uses their propaganda mouthpieces in the mainstream corporate media and government agency drones to misinform and obscure the truth, but the data and anecdotal observational evidence reveal the true nature of our societal implosion.

A report by the Census Bureau this past week inadvertently reveals data that confirms my observations on the roadways of my suburban existence. Annual household income fell in 2011 for the fourth straight year, to an inflation-adjusted $50,054. The median income — meaning half earned more, half less — now stands 8.9% lower than the all-time peak of $54,932 in 1999. It is far worse than even that dreadful result. Real median household income is lower than it was in 1989. When you understand that real household income hasn’t risen in 23 years, you can connect the dots with the decay and deterioration of properties in suburbia. A vast swath of Americans cannot afford to maintain their residences. If the choice is feeding your kids and keeping the heat on versus repairing the porch, replacing the windows or getting a new roof, the only option is survival.

US GDP vs. Median Household Income

All races have seen their income fall, with educational achievement reflected in the much higher incomes of Whites and Asians. It is interesting to note that after a 45 year War on Poverty the median household income for black families is only up 19% since 1968.

real household income

Now for the really bad news. Any critical thinking person should realize the Federal Government has been systematically under-reporting inflation since the early 1980’s in an effort to obscure the fact they are debasing the currency and methodically destroying the lives of middle class Americans. If inflation was calculated exactly as it was in 1980, the GDP figures would be substantially lower and inflation would be reported 5% higher than it is today. Faking the numbers does not change reality, only the perception of reality. Calculating real median household income with the true level of inflation exposes the true picture for middle class America. Real median household income is lower than it was in 1970, just prior to Nixon closing the gold window and unleashing the full fury of a Federal Reserve able to print fiat currency and politicians to promise the earth, moon and the sun to voters. With incomes not rising over the last four decades is it any wonder many of our 115 million households slowly rot and decay from within like an old diseased oak tree. The slightest gust of wind can lead to disaster.

Eliminating the last remnants of fiscal discipline on bankers and politicians in 1971 accomplished the desired result of enriching the top 0.1% while leaving the bottom 90% in debt and desolation. The Wall Street debt peddlers, Military Industrial arms dealers, and job destroying corporate goliaths have reaped the benefits of financialization (money printing) while shoveling the costs, their gambling losses, trillions of consumer debt, and relentless inflation upon the working tax paying middle class. The creation of the Federal Reserve and implementation of the individual income tax in 1913, along with leaving the gold standard has rewarded the cabal of private banking interests who have captured our economic and political systems with obscene levels of wealth, while senior citizens are left with no interest earnings ($400 billion per year has been absconded from savers and doled out to bankers since 2008 by Ben Bernanke) and the middle class has gone decades seeing their earnings stagnate and their purchasing power fall precipitously.


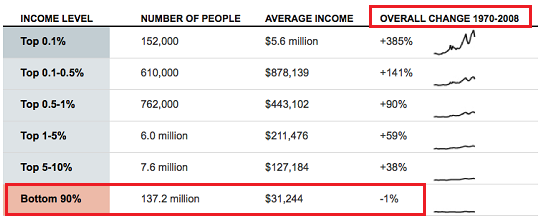
The facts exposed in the chart above didn’t happen by accident. The system has been rigged by those in power to enrich them, while impoverishing the masses. When you gain control over the issuance of currency, issuance of debt, tax system, political system and legal apparatus, you’ve essentially hijacked the country and can funnel all the benefits to yourself and costs to the math challenged, government educated, brainwashed dupes, known as the masses. But there is a problem for the 0.1%. Their sociopathic personalities never allow them to stop plundering and preying upon the sheep. They have left nothing but carcasses of the once proud hard working middle class across the country side. There are only so many Lear jets, estates in the Hamptons, Jaguars, and Rolexes the 0.1% can buy. There are only 152,000 of them. Their sociopathic looting and pillaging of the national wealth has destroyed the host. When 90% of the population can barely subsist, collapse and revolution beckon.

Extend, Pretend & Depend

As I drove further along Ridge Pike we passed the endless monuments to our spiral into the depths of materialism, consumerism, and the illusion that goods purchased on credit represented true wealth. Mile after mile of strip malls, restaurants, gas stations, and office buildings rolled by my window. Anyone who lives in the suburbs knows what I’m talking about. You can’t travel three miles in any direction without passing a Dunkin Donuts, KFC, McDonalds, Subway, 7-11, Dairy Queen, Supercuts, Jiffy Lube or Exxon Station. The proliferation of office parks to accommodate the millions of paper pushers that make our service economy hum has been unprecedented in human history. Never have so many done so little in so many places. Everyone knows what a standard American strip mall consists of – a pizza place, a Chinese takeout, beer store, a tanning, salon, a weight loss center, a nail salon, a Curves, karate studio, Gamestop, Radioshack, Dollar Store, H&R Block, and a debt counseling service. They are a reflection of who we’ve become – an obese drunken species with excessive narcissistic tendencies that prefers to play video games while texting on our iGadgets as our debt financed lifestyles ultimately require professional financial assistance.

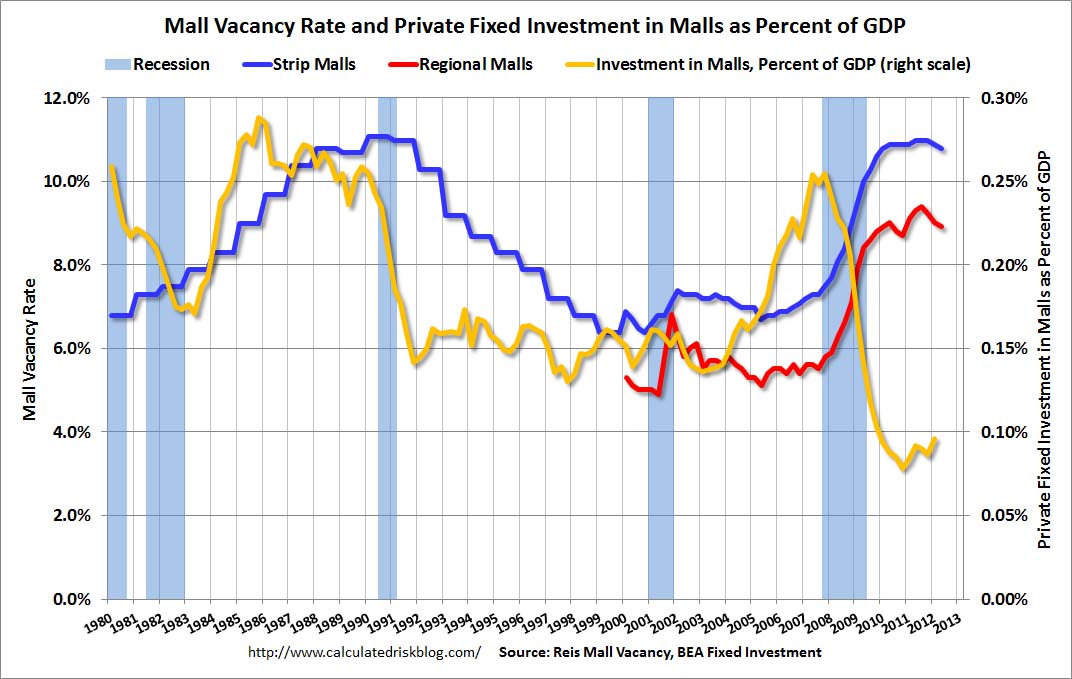
What you can’t ignore today is the number of vacant storefronts in these strip malls and the overwhelming number of SPACE AVAILABLE, FOR LEASE, and FOR RENT signs that proliferate in front of these dying testaments to an unsustainable economic system based upon debt fueled consumer spending and infinite growth assumptions. The booming sign manufacturer is surely based in China. The officially reported national vacancy rates of 11% are already at record highs, but anyone with two eyes knows these self-reported numbers are a fraud. Vacancy rates based on my observations are closer to 30%. This is part of the extend and pretend strategy that has been implemented by Ben Bernanke, Tim Geithner, the FASB, and the Wall Street banking cabal. The fraud and false storyline of a commercial real estate recovery is evident to anyone willing to think critically. The incriminating data is provided by the Federal Reserve in their Quarterly Delinquency Report.

The last commercial real estate crisis occurred in 1991. Mall vacancy rates were at levels consistent with today.

The current reported office vacancy rates of 17.5% are only slightly below the 19% levels of 1991.

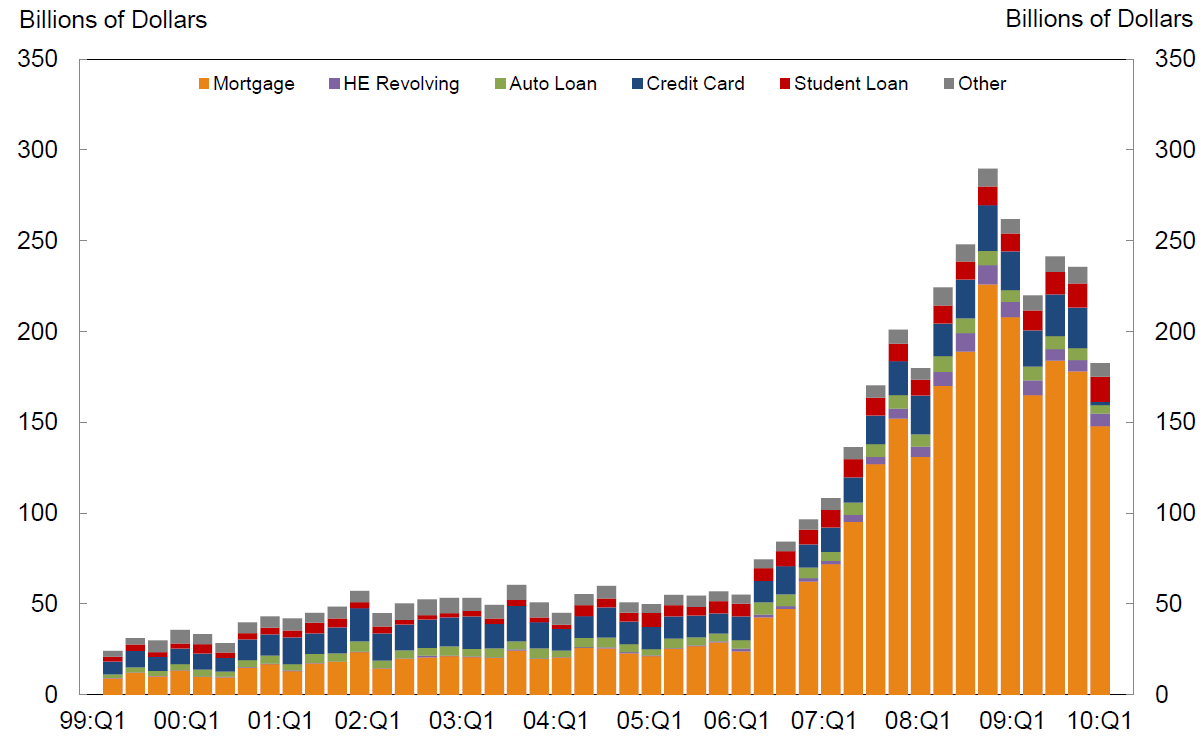
As reported by the Federal Reserve, delinquency rates on commercial real estate loans in 1991 were 12%, leading to major losses among the banks that made those imprudent loans. Amazingly, after the greatest financial collapse in history, delinquency rates on commercial loans supposedly peaked at 8.8% in the 2nd quarter of 2010 and have now miraculously plummeted to pre-collapse levels of 4.9%. This is while residential loan delinquencies have resumed their upward trajectory, the number of employed Americans has fallen by 414,000 in the last two months, 9 million Americans have left the labor force since 2008, and vacancy rates are at or near all-time highs. This doesn’t pass the smell test. The Federal Reserve, owned and controlled by the Wall Street, instructed these banks to extend all commercial real estate loans, pretend they will be paid, and value them on their books at 100% of the original loan amount. Real estate developers pretend they are collecting rent from non-existent tenants, Wall Street banks pretend they are being paid by the developers, and their highly compensated public accounting firm pretends the loans aren’t really delinquent. Again, the purpose of this scam is to shield the Wall Street bankers from accepting the losses from their reckless behavior. Ben rewards them with risk free income on their deposits, propped up by mark to fantasy accounting, while they reward themselves with billions in bonuses for a job well done. The master plan requires an eventual real recovery that isn’t going to happen. Press releases and fake data do not change the reality on the ground.

I have two strip malls within three miles of my house that opened in 1990. When I moved to the area in 1995, they were 100% occupied and a vital part of the community. The closest center has since lost its Genuardi grocery store, Sears Hardware, Blockbuster, Donatos, Sears Optical, Hollywood Tans, hair salon, pizza pub and a local book store. It is essentially a ghost mall, with two banks, a couple chain restaurants and empty parking spaces. The other strip mall lost its grocery store anchor and sporting goods store. This has happened in an outwardly prosperous community. The reality is the apparent prosperity is a sham. The entire tottering edifice of housing, autos, and retail has been sustained by ever increasing levels of debt for the last thirty years and the American consumer has hit the wall. From 1950 through the early 1980s, when the working middle class saw their standard of living rise, personal consumption expenditures accounted for between 60% and 65% of GDP. Over the last thirty years consumption has relentlessly grown as a percentage of GDP to its current level of 71%, higher than before the 2008 collapse.

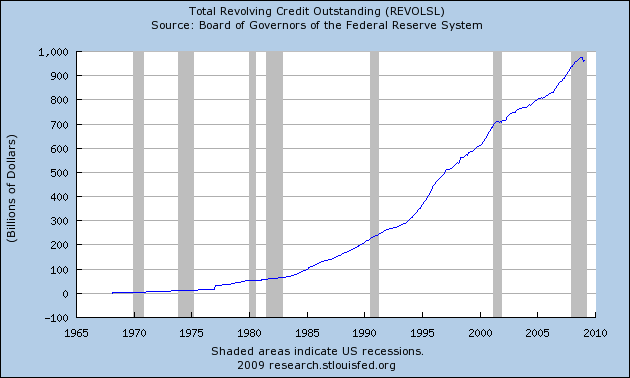
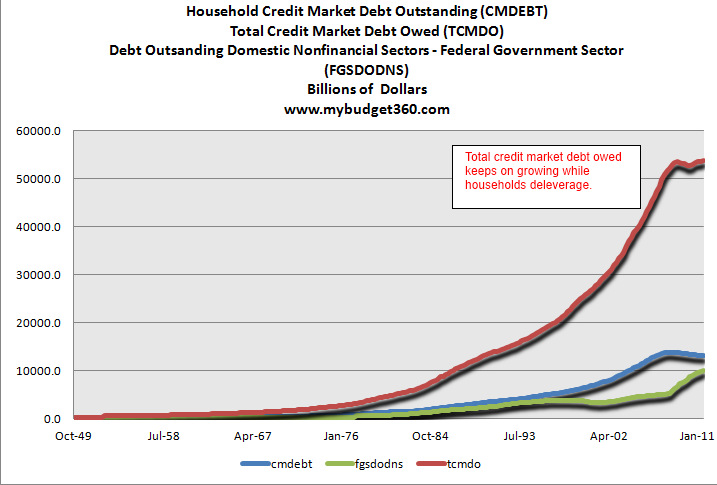
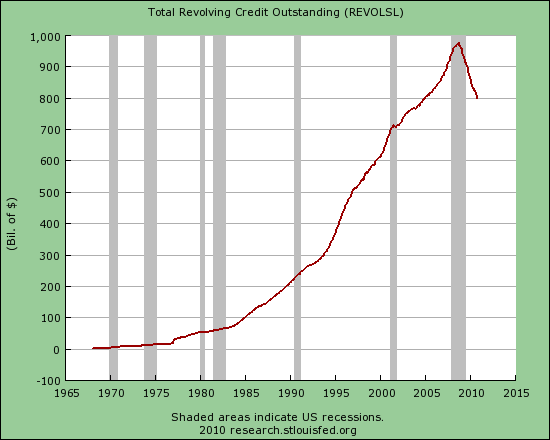
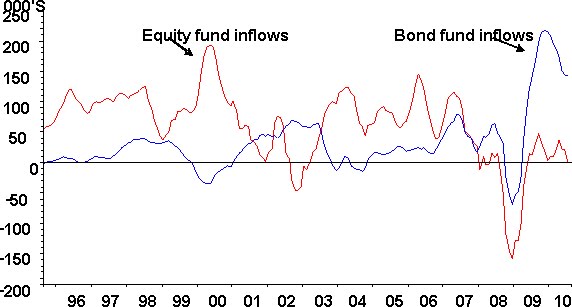
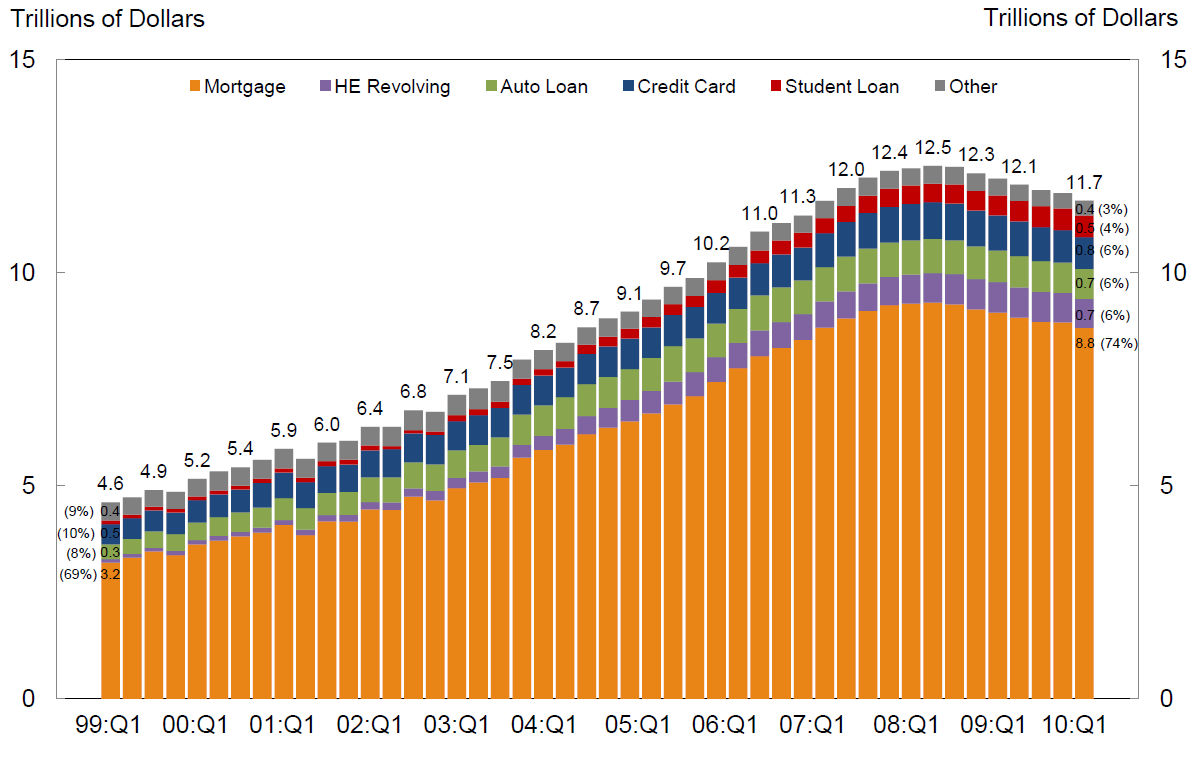
If the consumption had been driven by wage increases, then this trend would not have been a problem. But, we already know real median household income is lower than it was in 1970. The thirty years of delusion were financed with debt – peddled, hawked, marketed, and pushed by the drug dealers on Wall Street. The American people got hooked on debt and still have not kicked the habit. The decline in household debt since 2008 is solely due to the Wall Street banks writing off $800 billion of mortgage, credit card, and auto loan debt and transferring the cost to the already drowning American taxpayer.

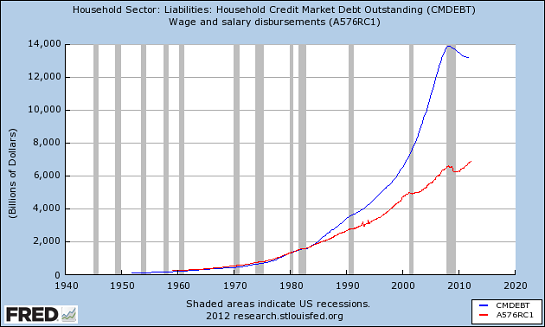
The powers that be are desperately attempting to keep this unsustainable, dysfunctional debt choked scheme from disintegrating by doling out more subprime auto debt, subprime student loan debt, low down payment mortgages, and good old credit card debt. It won’t work. The consumer is tapped out. Last week’s horrific retail sales report for August confirmed this fact. Declining household income and rising costs for energy, food, clothing, tuition, taxes, health insurance, and the other things needed to survive in the real world, have broken the spirit of Middle America. The protracted implosion of our consumer society has only just begun. There are thousands of retail outlets to be closed, hundreds of thousands of jobs to be eliminated, thousands of malls to be demolished, and billions of loan losses to be incurred by the criminal Wall Street banks.

The Faces of Failure & Futility

My fourteen years working in key positions for big box retailer IKEA has made me particularly observant of the hubris and foolishness of the big chain stores that dominate the retail landscape.  There are 1.1 million retail establishments in the United States, but the top 25 mega-store national chains account for 25% of all the retail sales in the country. The top 100 retailers operate 243,000 stores and account for approximately $1.6 trillion in sales, or 36% of all the retail sales in the country. Their misconceived strategic plans assumed 5% same store growth for eternity, economic growth of 3% per year for eternity, a rising market share, and ignorance of the possible plans of their competitors. They believed they could saturate a market without over cannibalizing their existing stores. Wal-Mart, Target, Best Buy, Home Depot and Lowes have all hit the limits of profitable expansion. Each incremental store in a market results in lower profits.

My trip to my local Lowes last weekend gave me a glimpse into a future of failure and futility. Until 2009, I had four choices of Lowes within 15 miles of my house. There was a store 8 miles east, 12 miles west, 15 miles north, and 15 miles south of my house. In an act of supreme hubris, Lowes opened a store smack in the middle of these four stores, four miles from my house. The Hatfield store opened in early 2009 and I wrote an article detailing how Lowes was about to ruin their profitability in Montgomery County. It just so happens that I meet a couple of my old real estate buddies from IKEA at a local pub every few months. In 2009 one of them had a real estate position with Lowes and we had a spirited discussion about the prospects for the Lowes Hatfield store. He assured me it would be a huge success. I insisted it would be a dud and would crush the profitability of the market by cannibalizing the other four stores. We met at that same pub a few months ago. Lowes had laid him off and he admitted to me the Hatfield store was a disaster.

I pulled into the Lowes parking lot at 11:30 am on a Saturday. Big Box retailers do 50% of their business on the weekend. The busiest time frame is from 11:00 am to 2:00 pm on Saturday. Big box retailers build enough parking spots to handle this peak period. The 120,000 square feet Hatfield Lowes has approximately 1,000 parking spaces. I pulled into the spot closest to the entrance during their supposed peak period. There were about 70 cars in the parking lot, with most probably owned by Lowes workers. It is a pleasure to shop in this store, with wide open aisles, and an employee to customer ratio of four to one. The store has 14 checkout lanes and at peak period on a Saturday, there was ONE checkout lane open, with no lines. This is a corporate profit disaster in the making, but the human tragedy far overrides the declining profits of this mega-retailer.

As you walk around this museum of tools and toilets you notice the looks on the faces of the workers. These aren’t the tattooed, face pierced freaks you find in many retail establishments these days. They are my neighbors. They are the beaten down middle class. They are the middle aged professionals who got cast aside by the mega-corporations in the name of efficiency, outsourcing, right sizing, stock buybacks, and executive stock options. The irony of this situation is lost on those who have gutted the American middle class. When you look into the eyes of these people, you see sadness, confusion and embarrassment. They know they can do more. They want to do more. They know they’ve been screwed, but they aren’t sure who to blame. They were once the very customers propelling Lowes’ growth, buying new kitchens, appliances, and power tools. Now they can’t afford a can of paint on their $10 per hour, no benefit retail careers. As depressing as this portrait appears, it is about to get worse.

This Lowes will be shut down and boarded up within the next two years. The parking lot will become a weed infested eyesore occupied by 14 year old skateboarders. One hundred and fifty already down on their luck neighbors will lose their jobs, the township will have a gaping hole in their tax revenue, and the CEO of Lowes will receive a $50 million bonus for his foresight in announcing the closing of 100 stores that he had opened five years before. This exact scenario will play out across suburbia, as our unsustainable system comes undone. Our future path will parallel the course of the labor participation rate. Just as the 9 million Americans who have “left” the labor force since 2008 did not willfully make that choice, the debt burdened American consumer will be dragged kicking and screaming into the new reality of a dramatically reduced standard of living.

Connecting the dots between my anecdotal observations of suburbia and a critical review of the true non-manipulated data bestows me with a not optimistic outlook for the coming decade. Is what I’m seeing just the view of a pessimist, or are you seeing the same thing?

A few powerful men have hijacked our economic, financial and political structure. They aren’t socialists or capitalists. They’re criminals. They created the culture of materialism, greed and debt, sustained by prodigious levels of media propaganda. Our culture has been led to believe that debt financed consumption over morality and justice is the path to success. In reality, we’ve condemned ourselves to a slow painful death spiral of debasement and despair.

“A culture that does not grasp the vital interplay between morality and power, which mistakes management techniques for wisdom, and fails to understand that the measure of a civilization is its compassion, not its speed or ability to consume, condemns itself to death.” – Chris Hedges

order non hybrid seeds

CONSUMER DEBT REACHES NEW ALL-TIME HIGH

The Federal Reserve reported consumer credit outstanding as of the end of May. Great news. Consumers added $17.1 billion of new debt to their balance sheets and now owe a record $2.573 Trillion. Whatever happened to that deleveraging storyline being pushed by the MSM? It was a load of crap from the get go. Here is the link to the Fed report:

http://www.federalreserve.gov/releases/G19/current/

Here are my observations:

  • It seems non-revolving credit for autos and student loans jumped $9.1 billion in one month. It seems 70% of this increase was directly from the Federal government, meaning YOU made the loans to subprime students and subprime auto buyers in West Philly. Based on my observations, they are leaning towards Cadillac Escalades with your money. When the student loan bubble and subprime auto loan bubble burst you’ll be on the hook – AGAIN.
  • The really interesting data point was credit card debt surging by $8 billion to the highest level since 2010. This debt is 70% attributable to the Wall Street criminal cabal. Something doesn’t really add up. Gasoline prices were plunging in May. The consumer should have had more disposable income. But we know for a fact that retail sales sucked in May and June. So, why would credit card debt surge? Here is why:


      • 1.2 million people have fallen off the 99 week unemployment rolls and are now trying to survive on their credit cards.
      • The few jobs that have been added are part-time crap jobs with no benefits and people are using credit cards to try and make up the lost income.
      • The 8 million people that have “voluntarily” left the workforce may have left too soon and are enjoying their leisure time on their credit cards.

We have entered a recession, food prices are rising, real wages are dropping, and job losses are mounting. Surging credit card, student loan, and auto loan debt at the outset of recession is surely a good sign. The Wall Street banks sure look smart having reduced their loan loss reserves for the last two years. No bad debt on the horizon – right Jaime?


THE FRAUD & THEFT WILL CONTINUE UNTIL MORALE IMPROVES

The BEA reported the latest figures for personal income, personal consumption expenditures and the savings rate last week. The government mouthpieces in the mainstream media obediently reported that personal income and expenditures reached an all-time high in March. The chart below shows the ever increasing level of expenditures by consumers since this supposed economic recovery began in the 4th quarter of 2009. All good Keynesian economists know that consumer spending is always good for America, no matter how it is achieved. We must be in a recovery if income and spending are reaching new highs, right? That is the fraudulent storyline being propagandized to the non-questioning lapdog public. A false storyline and data that has been massaged harder than a Secret Service agent by a Columbian hooker will not lead to a happy ending. Some critical thinking, a calculator, and some common sense reveal the depth of the fraud and expose the theft being committed by the avaricious governing elite at the expense of the prudent working middle class.

Digging into the data on the BEA website to arrive at my own conclusions, not those spoon fed to a willfully ignorant public by CNBC and the rest of the fawning Wall Street worshipping corporate media, is quite revealing. It divulges the extent to which Ben Bernanke and the politicians in Washington DC have gone to paint the U.S. economy with the appearance of recovery while wrecking the lives of senior citizens and judicious savers. Only a banker would bask in the glory of absconding with hundreds of billions from senior citizen savers and handing it over to criminal bankers. Only a government bureaucrat would classify trillions in entitlement transfers siphoned from the paychecks of the 58.4% of working age Americans with a job or borrowed from foreigner countries as personal income to the non-producing recipients. How can taking money from one person or borrowing it from future generations and dispensing it to another person be considered personal income? Only in the Delusional States of America.

If you really want to understand what has happened in this country over the last forty years, you need to analyze the data across the decades. This uncovers the trends over time that has led us to this sorry state of affairs. The chart below details the major components of personal income over time as a percentage of total personal income. It tells the story of a nation in decline and on an unsustainable path that will ultimately result in a monetary collapse.

1970

1980

1990

2000

Apr-08

2010

Mar-12

Total Personal Income

100.0%

100.0%

100.0%

100.0%

100.0%

100.0%

100.0%

Wages & Salaries

66.1%

60.2%

56.7%

56.2%

52.7%

51.9%

51.8%

Interest Income

8.3%

12.1%

15.5%

11.6%

11.2%

8.2%

7.4%

Dividend Income

2.9%

2.9%

3.5%

4.5%

6.5%

5.8%

6.2%

Government transfers

8.5%

11.3%

11.7%

12.2%

14.3%

17.9%

17.3%

It is always fascinating to compare data from 1970, prior to Nixon closing the gold window and allowing bankers and politicians to print and spend to their hearts delight, to present day. The chart above paints a picture of a nation of workers and savers descending into a nation of parasites and spenders. Any rational person knows that income comes from one of two methods: working or investing. A country can only grow by working, saving, investing and living within its means.  Money taken from workers and investors and transferred to the non-working and spenders is NOT INCOME. It is just redistribution from producers to non-producers. The key takeaways from the chart are:

  • Working at a job generated two-thirds of personal income in 1970 and barely half today. This explains why only half of Americans pay Federal taxes.
  • One might wonder how we could be in the third year of a supposed economic recovery and wages and salaries as a percentage of total personal income is lower than pre-crisis and still falling.
  • Government transfers have doubled as a proportion of “income” in the last forty years. The increase since 2000 has been accelerating, up 122% in 12 years versus the 55% increase in GDP.  The slight drop since 2010 is the result of millions falling off the 99 week unemployment rolls.
  • Luckily it is increasingly easy to leave unemployment and go on the dole for life. The number of people being added to the SSDI program has surged by 2.2 million since mid-2010, an 8.5% increase to 28.2 million people. Applications are swelling with disabilities like muscle pain, obesity, migraine headaches, mental illness (43% of all claims) and depression. Our leaders have set such a good example of how to commit fraud on such a grand scale that everyone wants to get a piece of the action. It’s like hitting the jackpot, as 99% of those accepted into the SSDI program (costing $132 billion per year) never go back to work. I’ve got a nasty hangnail. I wonder if I qualify. I’d love to get one of those convenient handicapped parking spaces. Once I get into the SSDI program I would automatically qualify for food stamps, a “free” government iPhone, “free” government cable and a 7 year 0% Ally Financial (85% owned by Timmy Geithner) auto loan for a new Cadillac Escalade. The SSDI program is now projected to go broke in 2016. I wonder why?


  • A nation that rewarded and encouraged savings in 1970 degenerated into a country that penalizes savers and encourages consumption. The government, mainstream media, and NYT liberal award winning Ivy League economists encourage borrowing and spending as the way to build a strong nation. Americans have been convinced that borrowing to appear successful is the same as saving and investing to actually achieve economic success.
  • Americans saved 7% to 12% of their income from 1960 through 1980. As Wall Street convinced delusional Boomers that stock and house appreciation would fund their luxurious retirements, savings plunged to below 0% in 2005. Why save when your house doubled in price every three years? Americans rationally began to save again in 2009 but Bernanke’s zero interest rate policy put an end to that silliness. Why save when you are being paid .15%? Buying Apple stock at $560 (can’t miss) and getting in on the Facebook IPO (PE ratio of 99) is a much better bet. The national savings rate of 3.8% is back to early 2008 levels. I wonder what happens next?


  • The proportional distribution between interest and dividends which had been in the 3 to 4 range for decades is now virtually 1 to 1, as Ben Bernanke has devastated the lives of millions of poor senior citizen savers while continuing to subsidize his wealthy stock investors buddies on Wall Street.

Now for the bad news. The Baby Boom generation has just begun to retire en masse. Government transfers will automatically accelerate over the next decade as Social Security and Medicare transfer payments balloon. Government transfer payments have already increased by 3,250% since 1970, while wages and salaries have increased by 1,250%. The non-existent inflation touted by Ben Bernanke accounts for 590% of this increase. We have passed a point of no return. As the number of Americans receiving a government EBT into their bank account grows by the day and the number of working Americans remains stagnant, the chances of a politician showing the courage to address our un-payable entitlement liabilities is near zero. Americans choose to deal with problems in a reactive manner rather than a proactive manner. Until the next inescapable crisis, the fraud and looting will continue until morale improves.

 Billions of $

1970

1980

1990

2000

Apr-08

2010

Mar-12

Total Personal Income

$835

$2,257

$4,852

$8,548

$12,457

$12,361

$13,328

Wages & Salaries

$552

$1,358

$2,750

$4,800

$6,565

$6,413

$6,905

Interest Income

$69

$272

$753

$989

$1,397

$1,012

$984

Dividend Income

$24

$65

$169

$381

$810

$723

$821

Government transfers

$71

$256

$570

$1,041

$1,786

$2,217

$2,312


A Few Evil Men

“Every effort has been made by the Federal Reserve Board to conceal its powers, but the truth is the FED has usurped the government. It controls everything here (in Congress) and controls all our foreign relations. It makes and breaks governments at will… When the FED was passed, the people of the United States did not perceive that a world system was being set up here… A super-state controlled by international bankers, and international industrialists acting together to enslave the world for their own pleasure!” – Rep. Louis T. McFadden


The largest fraud and theft being committed in this country is being perpetrated by the Central Bank of the United States; its Wall Street owners; and the politicians beholden to these evil men. The fraud and theft is being committed through the insidious use of inflation and manipulation of interest rates. The biggest shame of our government run public education system is their inability or unwillingness to teach even the most basic of financial concepts to our children. It’s almost as if they don’t want the average person to understand the truth about inflation and how it has slowly and silently destroyed their livelihood while enriching the few who create it. Converting the chart above into inflation adjusted figures reveals a different picture than the one sold to the general public on a daily basis. Even using the government manipulated CPI figures from the BLS, the ravages of inflation are easy to recognize.

Billions of Real $

1970

1980

1990

2000

Apr-08

2010

Mar-12

Total Personal Income

$4,937

$6,261

$8,569

$11,374

$13,304

$13,007

$13,328

Wages & Salaries

$3,264

$3,767

$4,856

$6,387

$7,011

$6,748

$6,905

Interest Income

$408

$754

$1,330

$1,316

$1,492

$1,065

$984

Dividend Income

$142

$180

$298

$507

$865

$761

$821

Government transfers

$420

$710

$1,007

$1,385

$1,907

$2,333

$2,312

CPI

38.8

82.7

129.9

172.4

214.8

218

229.4

Total wages and salaries have risen by only 112% on an inflation adjusted basis over the last 42 years. This is with U.S. population growth from 203 million in 1970 to 313 million people today, a 54% increase. On a real per capita basis, wages and salaries rose from $16,079 in 1970 to $22,060 today, a mere 37% increase in 42 years. That is horrific and some perspective will reveal how bad it really is:

  • The average new home price in 1970 was $26,600. The average new home price today is $291,200. On an inflation adjusted basis, home prices have risen 85%.
  • The average cost of a new car in 1970 was $3,900. The average price of a new car today is $30,748. On an inflation adjusted basis, car prices have risen 33%.
  • A gallon of gasoline cost 36 cents in 1970. A gallon of gas today costs $3.85. On an inflation adjusted basis, gas prices have risen 81%.
  • The average price of a loaf of bread in 1970 was 25 cents. The average price of a loaf of bread today is $2.60. On an inflation adjusted basis, a loaf of bread has risen 76%.

In most cases, the cost of things we need to live have risen at twice the rate of our income. This data is bad enough on its own, but it is actually far worse. The governing elite, led by Alan Greenspan, realized that accurately reporting inflation would reveal their scheme, so they have been committing fraud since the early 1980s by systematically under-reporting CPI as revealed by John Williams at www.shadowstats.com:

The truth is that real inflation has been running 5% higher than government reported propaganda over the last twenty years. This explains why families were forced to have both parents enter the workforce just to make ends meet, with the expected negative societal consequences clear to anyone with two eyes. The Federal Reserve created inflation also explains why Americans have increased their debt from $124 billion in 1970 to $2.522 trillion today, a 2000% increase. Wages and salaries only rose 1,250% over this same time frame. Living above your means for decades has implications.

The country, its leaders, its banks and the American people should have come to their senses after the 2008-2009 melt-down. Politicians should have used the crisis to address our oncoming long-term fiscal train wreck, the recklessly guilty Wall Street banks should have been liquidated and their shareholders and bondholders wiped out, the bad debt rampant throughout the financial system should have been purged, and American consumers should have reduced their debt induced consumption while saving for an uncertain cloudy future. These actions would have been painful and would have induced a violent agonizing recession. It would be over now. We would be in the midst of a solid economic recovery built upon reality. Iceland told bankers to screw themselves in 2008. They accepted the consequences of their actions and experienced a brutal two year recession.

The debt was purged, banks forced to accept their losses, and the citizens learned a hard lesson. Amazingly, their economy is now growing strongly. This is the lesson. Wall Street is not Main Street. Saving Wall Street banks and wealthy investors did not save the economy. Stealing savings from little old ladies and funneling it to psychopathic bankers is not the way to save our economic system. It’s the way to save bankers who made world destroying bets while committing fraud on an epic scale, and lost.

Despite the assertion by the good doctor Krugman that there are very few Americans living on a fixed income being impacted by Bernanke’s zero interest rate policy, there are actually 40 million people over the age of 65 in this country that might disagree. There are another 60 million people between the ages of 50 and 64 years old rapidly approaching retirement age. We know 36 million people are receiving SS retirement benefits today. We know that 49 million people are already living below the poverty line, with 16% of those over 65 years old living in poverty. Do 0% interest rates benefit these people? Those over 50 years old are most risk averse, and they should be. Despite the propaganda touted by Wall Street shills and their CNBC mouthpieces, the fact is that the S&P 500 on an inflation adjusted basis is at the same level it was in 1996. Stock investors have gotten a 0% return for the last 16 years. The market is currently priced to deliver inflation adjusted returns of 2% over the next ten years, with the high likelihood of a large drop within the next year.

Ben Bernanke’s plan, fully supported by Tim Geithner, Barack Obama and virtually all corrupt politicians in Washington DC, is to force senior citizens and prudent savers into the stock market by manipulating interest rates and offering them no return on their savings. A fixed income senior citizen living off their meager $15,000 per year of Social Security and the $100,000 they’ve saved over their lifetimes was able to earn a risk free 5% in a money market fund in 2007, generating $5,000 or 25% of their annual living income. Today Ben is allowing them to earn $150 per year. From the BEA info in the chart above you can see that Ben’s ZIRP has stolen $400 billion of interest income from senior citizens and prudent savers and dropped it from helicopters on Wall Street. This might explain why old geezers are pouring back into the workforce at a record pace. Maybe Dr. Krugman has an alternative theory.

Another doctor, with a penchant for telling the truth, described in no uncertain terms the depth of the fraud and theft being perpetrated on the American people (aka Muppets) by Ben Bernanke, the Federal Reserve, their masters on Wall Street, and the puppets in Washington DC:

“We are not doing very well. The economy is just coming along at a snail’s pace. The first quarter numbers that we just got last week were not very good at all. The GDP number was 2.2%. That was a disappointment, but you know, it was all automobiles. 1.6 out of the 2.2 was motor vehicle production. So, people were catching up after not being able to buy them the year before. So, this is a very weak economy… I think the real danger is that this is a bubble in the stock market created by low long-term interest rates that the Fed has engineered. The danger is, like all bubbles, it bursts at some point. Remember, Ben Bernanke told us in the summer of 2010 that he was going to do QE2 and then ultimately they did Operation Twist. The purpose of that was to make long-term bonds less attractive so that investors would buy into the stock market. That would raise wealth and higher wealth would lead to more consumption. It helped in the fourth quarter of 2010 and maybe that is what is helping to drive consumption during the first quarter of this year. But the danger is you get a market that is not with the reality of what is happening in the economy, which is, as I said a moment ago, is really not very good at all.” – Martin Feldstein

The entire bogus recovery is again being driven by subprime auto loans being doled out by Ally Financial (85% owned by the U.S. government) and the other criminal Wall Street banks. The Federal Reserve and our government leaders will continue to steer the country on the same course of encouraging rampant speculation, deterring savings and investment, rewarding outrageous criminal behavior, purposefully generating inflation, and lying to the average American. It will work until we reach a tipping point. Dr. Krugman thinks another $4 trillion of debt and a debt to GDP ratio of 130% should get our economy back on track. When this charade is revealed to be the greatest fraud and theft in the history of mankind, Ben and Paul better have a backup plan, because there are going to be a few angry men looking for them.

Henry Ford knew what would happen if the people ever became educated about the true nature of the Federal Reserve:

“It is well enough that people of the nation do not understand our banking and monetary system, for if they did, I believe there would be a revolution before tomorrow morning.”  


GO TO SCHOOL & BUY A CAR

Great news. Consumer credit SURGED in January. We blasted through the $2.5 trillion level. Car loans and student loan skyrocketed by almost $21 billion in just one month. Remember how I was wondering about all the new cars in West Philly? Here’s the answer. Ally Bank (GMAC in disguise) is making car loans of $35,000 to people in West Philly that have an average annual income of $16,000 and live in low income housing so they can buy Ford Expeditions. Imagine how smart all those people studying in their underwear at the University of Phoenix will be in two years when they graduate. Every dime of these $1 trillion in student loans are being covered by you. Obama is handing it out from your stash.  Sounds like a sustainable economic model.

Consumer Credit Outstanding 1

Seasonally adjusted
  Year Quarter Month
  2010 2011 2012
  2007 2008 2009 2010 2011 r Q4 Q1 Q2 r Q3 r Q4 r Nov r Dec r Jan p
Total percent change (annual rate)2 5.8 1.6 -4.4 -1.7 3.6 2.5 2.2 3.6 1.4 6.9 9.8 7.9 8.6
Revolving 8.1 1.7 -9.6 -7.5 0.4 -2.6 -3.7 1.5 -2.0 6.0 9.9 5.5 -4.4
Nonrevolving 3 4.4 1.5 -1.2 1.5 5.1 5.0 5.1 4.6 3.0 7.4 9.7 9.0 14.7
Total amount (billions of dollars) 2522.5 2561.8 2450.1 2408.3 2494.5 2408.3 2421.5 2443.3 2451.9 2494.5 2478.2 2494.5 2512.3
Revolving 941.9 957.5 865.5 800.2 803.8 800.2 792.8 795.9 792.0 803.8 800.1 803.8 800.9
Nonrevolving 3 1580.7 1604.3 1584.6 1608.1 1690.7 1608.1 1628.6 1647.4 1659.9 1690.7 1678.1 1690.7 1711.4
 
Terms of Credit 4

Not seasonally adjusted. Percent except as noted.
Commercial banks
Interest rates
48-mo. new car 7.77 7.02 6.72 6.21 5.75 5.87 5.86 5.79 5.90 5.45 5.45 n.a. n.a.
24-mo. personal 12.38 11.37 11.10 10.87 10.92 10.94 11.01 11.36 10.80 10.52 10.52 n.a. n.a.
Credit card plans
All accounts 13.30 12.08 13.40 13.78 12.74 13.44 13.43 12.89 12.28 12.36 12.36 n.a. n.a.
Accounts assessed interest 14.68 13.57 14.31 14.26 13.09 13.67 13.44 13.06 13.08 12.78 12.78 n.a. n.a.
 
Finance companies 5
Interest rates 4.87 5.52 3.82 4.26 4.73 4.57 4.73 n.a. n.a. n.a. n.a. n.a. n.a.
Maturity (months) 62.0 63.4 62.0 63.0 62.3 62.5 62.3 n.a. n.a. n.a. n.a. n.a. n.a.
Loan-to-value ratio 95 91 90 86 80 82 80 n.a. n.a. n.a. n.a. n.a. n.a.
Amount financed (dollars) 28,287 26,178 28,272 27,959 26,673 27,423 26,673 n.a. n.a. n.a. n.a. n.a. n.a.

Consumer credit surges again in January

By Greg Robb

WASHINGTON (MarketWatch) – U.S. consumers increased their debt in January by a seasonally adjusted $17.8 billion for a third month of sharp gains, the Federal Reserve reported Wednesday. Over the three most recently reported months, consumer debt has gained an average of $18.0 billion, compared with an average monthly gain of $5.3 billion from October 2010 until October 2011. The increase in January was larger than the roughly $10 billion gain expected by Wall Street economists. The increase was powered by non-revolving debt such as auto loans, personal loans and student loans-these three categories combined for a $20.7 billion jump in January, the biggest gain since November 2001. Credit card debt fell by $2.9 billion in the month, the first decline since August.

The credit card was essentially invented at the same time we went off the gold standard in the early 1970s. And look what has happened since. This will surely end well.


CAUSE, EFFECT & THE FALLACY OF A RETURN TO NORMALCY

 “Thousands upon thousands are yearly brought into a state of real poverty by their great anxiety not to be thought of as poor.”Robert Mallett


I hear the term de-leveraging relentlessly from the mainstream media. The storyline that the American consumer has been denying themselves and paying down debt is completely 100% false. The proliferation of this Big Lie has been spread by Wall Street and their mouthpieces in the corporate media. The purpose is to convince the ignorant masses they have deprived themselves long enough and deserve to start spending again. The propaganda being spouted by those who depend on Americans to go further into debt is relentless. The “fantastic” automaker recovery is being driven by 0% financing for seven years peddled to subprime (aka deadbeats) borrowers for mammoth SUVs and pickup trucks that get 15 mpg as gas prices surge past $4.00 a gallon. What could possibly go wrong in that scenario? Furniture merchants are offering no interest, no payment deals for four years on their product lines. Of course, the interest rate from your friends at GE Capital reverts retroactively to 29.99% at the end of four years after the average dolt forgot to save enough to pay off the balance. I’m again receiving two to three credit card offers per day in the mail. According to the Wall Street vampire squids that continue to suck the life blood from what’s left of the American economy, this is a return to normalcy.

The definition of normal is: “The usual, average, or typical state or condition”. The fallacy is calling what we’ve had for the last three decades of illusion – Normal. Nothing could be further from the truth. We’ve experienced abnormal psychotic behavior by the citizens of this country, aided and abetted by Wall Street and their sugar daddies at the Federal Reserve. You would have to be mad to believe the debt financed spending frenzy of the last few decades was not abnormal.

The Age of Illusion

“Illusions commend themselves to us because they save us pain and allow us to enjoy pleasure instead. We must therefore accept it without complaint when they sometimes collide with a bit of reality against which they are dashed to pieces.” – Sigmund Freud

In my last article Extend & Pretend Coming to an End, I addressed the commercial real estate debacle coming down the pike. I briefly touched upon the idiocy of retailers who have based their business and expansion plans upon the unsustainable dynamic of an ever expanding level of consumer debt doled out by Wall Street banks. One only has to examine the facts to understand the fallacy of a return to normalcy. We haven’t come close to experiencing normalcy. When retail sales, consumer spending and consumer debt return to a sustainable level of normalcy, the carcasses of thousands of retailers will litter the highways and malls of America. It will be a sight to see. The chart below details the two decade surge in retail sales, with the first ever decline in 2008. Retail sales grew from $2 trillion in 1992 to $4.5 trillion in 2007. The Wall Street created crisis in 2008/2009 resulted in a decline to $4.1 trillion in 2009, but the resilient and still delusional American consumer, with the support of their credit card drug pushers on Wall Street, set a new record in 2011 of $4.7 trillion.

A two decade increase in retail sales of 135% might seem reasonable and normal if wages and household income had grown at an equal or greater rate. But total wages only grew by 125% over this same time frame. Interestingly, the median household income only grew from $30,600 to $49,500, a 62% increase over twenty years. It seems the majority of the benefits accrued to the top 20%, with their aggregate share of the national income exceeding 50% today, versus 47% in 1992 and 43% in the early 1970s. The top 5% are taking home in excess of 21% of the national income versus less than 19% in 1992 and 16% in the early 1970s. It appears the financialization of America, after Nixon closed the gold window and allowed unlimited money printing by the Federal Reserve, has benefitted the few, at the expense of the many. The bottom 80% of households has seen their share of the national income steadily decrease since the early 1970s. There are 119 million households in the United States and 95 million of these households have seen their wages and income stagnate. One might wonder how the 80% were able to fuel a two decade surge in retail sales with such pathetic wage growth.

Your friendly Wall Street banker stepped into the breach and did their part to aid a vast swath of Americans to enslave themselves in debt. As the chart above reveals, the slave owners on Wall Street have been the chief beneficiary of the decades long debt deluge. It seems that charging 18% interest on hundreds of billions in credit card debt can be extremely profitable for the shyster charging the interest. Decades of mailing millions of credit card offers, inundating financially ignorant Americans with propaganda media messages convincing them they needed a bigger house, fancier car, or latest technological gadget and creating complex derivatives that permitted banks to market debt to people guaranteed not to pay them back but not care since they sold the packages of these toxic AAA rated loans to pension funds and little old ladies, has done wonders for earnings per share, stock option awards, executive salaries and bonus pools. It hasn’t done wonders for the net worth of the average American who has been entrapped in the chains of debt, forged link by link over decades of purposeful deception and willful delusion.

The 135% increase in retail sales over two decades may have been slightly enhanced by the 213% increase in consumer credit outstanding. Consumer revolving credit rose from $800 billion to the current level of $2.5 trillion over the last two decades. Those 15 credit cards in our possession were so easy to use that we financed our trips to Dollywood, Sandals, and Euro-Disney, in addition to financing our 72 inch 3D HDTVs, granite countertops, stainless steel appliances, decks, pools, recliners with a built in fridges, home theatre rooms, Coach pocketbooks, Jimmy Cho shoes, Rolex watches, yachts, bigger and better boobs, and of course our smokes and beer. Much has been made about the great de-leveraging by the American consumer. There’s just one inconvenient fact – it hasn’t happened – yet.

Total consumer credit outstanding peaked at $2.58 trillion in July 2008. Today it stands at $2.50 trillion. Revolving credit card debt peaked at $972 billion in September 2008 and subsequently declined to $790 billion by April 2011. It now stands at $801 billion, as living well beyond our means has resumed its appeal. Meanwhile, non-revolving credit for automobiles, boats, student loans, and mobile homes peaked at $1.61 trillion in July 2008 and “crashed” all the way down to $1.58 trillion in May 2010. Once Bennie fired up the printing presses, the government car companies decided to make subprime auto loans again and the Federal government started doling out student loans like a pez dispenser, all was well in the non-revolving consumer loan world. The debt outstanding has soared to $1.7 trillion, a full $90 billion above the pre-crash peak. So, after three and a half years of “austerity” and supposed deleveraging, consumer debt outstanding has fallen by 3%.

The Big Lie of austerity and consumer deleveraging is unquestioned by the talking heads in the mainstream media. They are incapable or unwilling to examine the actual data which substantiates the fact that Americans have NOT deleveraged and have NOT taken austerity to heart. The most basic facts fly in the face of consumers even having the wherewithal to pay down their debt. Median household income has declined from $50,300 in 2008 to $49,400 today. There are 5 million less people employed today than employed in 2008. Total wages in the country have only grown from $6.6 trillion in 2008 to $6.8 trillion today. This increase was concentrated among the .01%, who do not carry credit card debt. They profit from credit card debt. Real disposable personal income has fallen by 5% since the peak in 2008 as Bernanke’s Wall Street bailout zero interest rate policy has caused prices for everything except our houses to surge. The people carrying most of the credit card debt are the least able to pay it off. These are the same people who have swelled the food stamp rolls from 28 million in 2008 to 46.5 million today.

A CNBC bubble headed arrogant bimbo might sarcastically ask, “If the American consumer isn’t deleveraging, than how did revolving credit card debt drop by $182 billion over three years?” Rather than do the minimal research needed to find the answer, they would rather parrot the company/government line. The chart below, compiled from Federal Reserve data, provides the answer. The Wall Street banks have written off $193.3 billion of bad debt since 2008. Now for some basic math, that will probably be over the head of most Wall Street analysts and CNBC parrots. If you start with $972 billion of credit card debt and you write-off $200 billion (assuming another $7 billion in the 4th Quarter of 2011) and your ending balance is $801 billion, how much debt did the American consumer pay down? It’s a trick question. The American consumer ADDED $29 billion of credit card debt since 2008 to go along with the $90 billion of auto and student loan debt ADDED onto their aching backs. So much for the deleveraging storyline. It’s comforting to convince ourselves we’ve changed, but we haven’t. And the powers that be need you to keep believing, so they can continue to keep you enslaved and under their thumbs.

Consumer Credit Card Debt and Charge-off Data (in Billions):

Outstanding Revolving Consumer Debt Outstanding Credit Card Debt Quarterly Credit Card Charge-Off Rate Quarterly Credit Card Charge-Off in Dollars
Q3 2011 $793.4 $777.5 5.63% $10.9
Q2 2011 $787.4 $771.7 5.58% $10.8
Q1 2011 $779.6 $764.0 6.96% $13.3
2010 $826.7 $810.2 $75.1
Q4 2010 $825.7 $810.2 7.70% $15.6
Q3 2010 $806.9 $790.8 8.55% $16.9
Q2 2010 $817.4 $801.1 10.97% $22.0
Q1 2010 $828.5 $811.9 10.16% $20.6
2009 $894.0 $876.1 $83.2
Q4 2009 $894.0 $876.1 10.12% $22.2
Q3 2009 $893.5 $875.6 10.1% $22.1
Q2 2009 $905.2 $887.1 9.77% $21.6
Q1 2009 $923.3 $904.8 7.62% $17.2
Q4 2008 $989.1 $969.3

(Source: CardHub.com, Federal Reserve)

Loving Our Servitude

“There will be, in the next generation or so, a pharmacological method of making people love their servitude, and producing dictatorship without tears, so to speak, producing a kind of painless concentration camp for entire societies, so that people will in fact have their liberties taken away from them, but will rather enjoy it, because they will be distracted from any desire to rebel by propaganda or brainwashing, or brainwashing enhanced by pharmacological methods. And this seems to be the final revolution.” Aldous Huxley

The American people have come to love their servitude through a combination of self- delusion, corporate mass media propaganda, and an irrational desire to appear successful without making the necessary sacrifices required to become successful. The drug of choice used to corral the masses into their painless concentration camp of debt has been Wall Street peddled financing. Can you think of a better business model than being a Wall Street bank? You hand out 500 million credit cards to 118 million households, even though 60 million of the households make less than $50,000. You then create derivatives where you package billions of subprime credit card debt and convince clueless dupes to buy this toxic debt as if it was AAA credit. When the entire Ponzi scheme implodes, you write-off $200 billion of bad debt and have the American taxpayer pick up the tab by having your Ben puppet at the Federal Reserve seize $450 billion of interest income from senior citizens and re-gift it to you through his zero interest rate policy. You then borrow from the Federal Reserve at 0% and charge an average interest rate of 15% on the $800 billion of credit card debt outstanding, generating $120 billion of interest and charging an additional $22 billion of late fees. Much was made of the closing of credit card accounts after the 2008 financial implosion, but most of the accounts closed were old unused credit lines. Now that the American taxpayer has picked up the tab for the 2008 debacle, the Wall Street banks are again adding new credit card accounts.

With 40% of all credit card users carrying a revolving balance averaging $16,000, they are incurring interest charges of $2,400 per year. Some of the best financial analysts in the blogosphere have been misled by the propaganda spewed by the Wall Street media shills at Bloomberg and CNBC. The following chart, which includes mortgage and home equity debt, gives the false impression households are sensibly deleveraging, as household debt as a percentage of disposable personal income has fallen from 115% in June 2009 to 101% today. As I’ve detailed ad nauseam, $200 billion of the $1.2 trillion of “household deleveraging” was credit card write-offs. The vast majority of the remaining $1 trillion of “deleveraging” could possibly be related to the 5 million completed foreclosures since 2009. Of course, this pales in comparison to the unbelievably foolhardy mortgage equity withdrawal of $3 trillion between 2003 and 2008 by the 1% wannabes.  Bloomberg might be a tad disingenuous by excluding the $1 trillion of student loan from their little chart. If student loan debt is included, household debt outstanding surges to $11.5 trillion.

Based on the Bloomberg chart you would assume wrongly that American consumers are using their rising incomes to pay down debt. Besides not actually reducing their debts, the disposable personal income figure provided by the government drones at the BEA includes government transfer payments for Social Security, Medicare, Medicaid, unemployment compensation, food stamps, veterans benefits, and the all- encompassing “other”. Disposable personal income in the 2nd quarter of 2008 reached $11.2 trillion. It has risen by $500 billion, to $11.7 trillion by the end of 2011. Coincidentally, government social transfers have risen by $400 billion over this same time frame, a 20% increase. Excluding government transfers, disposable personal income has risen by a dreadful 1.1%. For the benefit of the slow witted in the mainstream media, every penny of the social welfare transfers has been borrowed. Only a government bureaucrat could believe that borrowing money from the Chinese, handing it out to unemployed Americans and calling it personal income is proof of deleveraging and austerity.

Household debt as a percentage of wages in 2008 was 185%. Today, after the banks have written off $1.2 trillion of debt, this figure stands at 169%. Meanwhile, total credit market debt in our entire system now stands at an all-time high of $54 trillion, up $3 trillion from 2007. It stands at 360% of GDP. In 1992, total credit market debt of $15.2 trillion equaled 240% of GDP ($6.3 trillion). Was it a sign of a rational balanced economic system that total credit market debt grew by 355% in the last two decades while GDP grew by only 238%? I think it is pretty clear the last two decades have not been normal or built upon a sustainable foundation. In the three decades prior to 1990 household debt as a percentage of disposable personal income stayed in a steady range between 60% and 80%. The current level of 101% is abnormal. In order to achieve a sustainable normal level of 80% will require an additional $2 trillion of debt destruction. No one is prepared for this inevitable end result. The impact of this “real” deleveraging will devastate our consumer dependent society.

The colossal accumulation of debt in the last two decades was the cause and abnormally large retail sales were the effect. The return to normalcy will not be pleasant for consumers, retailers, mall owners, local governments or bankers.

Demographics are a Bitch

In addition to an unsustainable level of debt, the pig in the python (also known as the Baby Boomer generation) will relentlessly impact the future of consumer spending and the approaching mass retail closures. Baby Boomers range in age from 51 to 68 today. The chart below details the retail spending by age bracket. Almost 50% of all retail spending is done by those between 35 years old and 54 years old. This makes total sense as these are the peak earnings years for most people and the period in their lives when they are forming households, raising kids and accumulating stuff. As you enter your twilight years, income declines, medical expenses rise, the kids are gone, and you’ve bought all the stuff you’ll ever need. Spending drops precipitously as you enter your 60’s. The spending wave that began in 1990 and reached its apex in the mid-2000s has crested and is going to crash down on the heads of hubristic retail CEOs that extrapolated unsustainable debt financed spending to infinity into their store expansion plans. The added kicker for retailers is the fact Boomers haven’t saved enough for their retirements, have experienced a twelve year secular bear market with another five or ten years to go, are in debt up to their eyeballs, and have seen the equity in their homes evaporate into thin air in the last seven years. This is not a recipe for a spending up swell.

Demographics cannot be spun by the corporate media or manipulated by BLS government drones. They are factual and unable to be altered. They are also predictable. The four population by age charts below paint a four decade picture of reality that does not bode well for retailers over the coming decade. The population by age data correlates perfectly with the spending spree over the last two decades.

  • 26% of the population in the prime spending years between 35 and 54 years old.
  • Only 14% of the population over 65 years old indicating reduced spending.

  • 31% of the population in the prime spending years between 35 and 54 years old.
  • Only 13% of the population over 65 years old indicating reduced spending.

  • 28% of the population in the prime spending years between 35 and 54 years old.
  • A rising 14% of the population over 65 years old indicating reduced spending.

  • 24% of the population in the prime spending years between 35 and 54 years old.
  • A rising 17% of the population over 65 years old indicating reduced spending.

The irreversible descent in the percentage of our population in the 35 to 54 year old prime spending age bracket will have and is already having a devastating impact on retail sales. In addition, the young people moving into the 25 to 34 year old bracket are now saddled with $1 trillion of student loan debt and worthless degrees from the University of Phoenix and the other for-profit diploma mills, luring millions with their Federal government easy loan programs. The fact that 40% of all 20 to 24 year olds in the country are not employed and 26% of all 25 to 34 year olds in the country are not working may also play a role in holding back spending, as jobs are somewhat helpful in generating money to buy stuff. Even with Obama as President they will have a tough time getting onto the unemployment rolls without ever having a job. The 55 and over crowd, who have lived above their means for three decades, will be lucky if they have the resources to put Alpo on the table in the coming years. The unholy alliance of debt, demographics and delusion will result in a retail debacle of epic proportions, unseen by retail head honchoes and the linear thinkers in the media and government.

We’re Not in Kansas Anymore Toto

“We tell ourselves we’re in an economic recovery, meaning we expect to return to a prior economic state, namely, a turbo-charged “consumer” economy fueled by easy credit and cheap energy. Fuggeddabowdit. That part of our history is over. We’ve entered a contraction that will seem permanent until we reach an economic re-set point that comports with what the planet can actually provide for us. That re-set point is lower than we would like to imagine. Our reality-based assignment is the intelligent management of contraction. We don’t want this assignment. We’d prefer to think that things are still going in the other direction, the direction of more, more, more. But they’re not. Whether we like it or not, they’re going in the direction of less, less, less. Granted, this is not an easy thing to contend with, but it is the hand that circumstance has dealt us. Nobody else is to blame for it.” – Jim Kunstler


The brilliant retail CEOs who doubled and tripled their store counts in the last twenty years and assumed they were geniuses as sales soared are getting a cold hard dose of reality today. What they don’t see is an abrupt end to their dreams of ever expanding profits and the million dollar bonuses they have gotten used to. I’m pretty sure their little financial models are not telling them they will need to close 20% of their stores over the next five years. They will be clubbed over the head like a baby seal by reality as consumers are compelled to stop consuming. As we’ve seen, just a moderation in spending has resulted in a collapse in store profitability. Retail CEOs have failed to grasp that it wasn’t their brilliance that led to the sales growth, but it was the men behind the curtain at the Federal Reserve. The historic spending spree of the last two decades was simply the result of easy to access debt peddled by Wall Street and propagated by the easy money policies of Alan Greenspan and Ben Bernanke. The chickens came home to roost in 2008, but the Wizard of Debt – Bernanke – has attempted to keep the flying monkeys at bay with his QE1, QE2, Operation Twist, and ZIRP. As the economy goes down for the count again in 2012, he will be revealed as a doddering old fool behind the curtain.

There are 1.1 million retail establishments in the United States, but the top 25 mega-store national chains account for 25% of all the retail sales in the country. The top 100 retailers operate 243,000 stores and account for approximately $1.6 trillion in sales, or 36% of all the retail sales in the country. They are led by the retail behemoth Wal-Mart and they dot the suburban landscape from Maine to Florida and New York to California. These super stores anchor every major mall in America. There are power centers with only these household names jammed in one place (example near my home: Best Buy, Target, Petsmart, Dicks, Barnes & Noble, Staples). These national chains had already wiped out the small town local retailers by the early 2000s as they sourced their goods from China and dramatically underpriced the small guys. The remaining local retailers have been closing up shop in record numbers in the last few years as the ability to obtain financing evaporated and customers disappeared. The national chains have more staying power, but their blind hubris and inability to comprehend the future landscape will be their downfall.

Having worked for one of the top 100 retailers for 14 years, I understand every aspect of how these mega-chains operate. They all approach retailing from a very scientific manner. They have regression models to project sales based upon demographics, drive times, education, average income, and the size of the market. They will build any store that achieves a certain ROI, based on their models. The scientific method works well when you don’t make ridiculous growth assumptions and properly take into account what your competitors are doing and how the economy will realistically perform in the future years. This is where it goes wrong as these retail chains get bigger, start believing their press clippings and begin ignoring the warnings of sober realists within their organizations. When the models show that cannibalization of sales from putting stores too close together will result in a decline in profits, the CEO will tweak the model to show greater same store growth and a larger increase in the available market due to higher economic growth. They assume margins will increase based upon nothing. At the same time, they will ignore the fact their competitor is building a store 2 miles away. Eventually, using foolhardy assumptions and ignoring facts leads to declining sales and profitability.

There is no better example of this than Best Buy. They increased their U.S. store count from 500 in 2002 to 1,300 today. That is a 160% increase in store count. For some perspective, national retail sales grew by 42% over this same time frame. Their strategy wiped out thousands of mom and pop stores and drove their chief competitor – Circuit City – into liquidation. But their hubris caught up to them. There sales per store has plummeted from $36 million per store in 2007 to less than $28 million per store today, a 24% decline in just five years. They have cannibalized themselves and have seen a $6 billion increase in revenue lead to $100 million LESS in profits. It appears the 444 stores they have built since 2007 have a net negative ROI. Top management is now in full scramble mode as they refuse to admit their strategic errors. Instead they cut staff and use upselling gimmicks like service plans, technical support and deferred financing to try and regain profitability. They will not admit they have far too many stores until it is too late. They will follow the advice of an earnings per share driven Wall Street crowd and waste their cash buying back stock. We’ve seen this story before and it ends in tears. I was in a Best Buy last week at 6:00 pm and there were at least 50 employees servicing about 10 customers. Tick Tock.

Best Buy - Annual Store Count Growth

Best Buy - Annual Sales per Store

You would have to be blind to not have noticed the decade long battles between the two biggest drug store chains and the two biggest office supply chains. Walgreens and CVS have been in a death struggle as they have each increased their store counts by 80% to 90% in the last 10 years. Both chains have been able to mask poor existing store growth by opening new stores. They are about to hit the wall. I now have six drug stores within five miles of my house all selling the exact same products. Every Wal-Mart and Target has their own pharmacy. At 2:00 pm on a Sunday afternoon I walked into the Walgreens near my house and there were six employees, a pharmacist and myself in the store. This is a common occurrence in this one year old store. It will not reach its 3rd birthday.

Walgreens - Annual Store Count Growth

CVS - Annual Retail Store Growth

Further along on the downward death spiral are Staples and Office Depot. They both increased their store counts by 50% to 60% in the last decade. Despite adding almost 200 stores since 2007, Staples has managed to reduce their profits. Sales per store have declined by 20% since 2006. Office Depot has succeeded in losing almost $2 billion in the last five years. These fools are actually opening new stores again despite overseeing a 36% decrease in sales per store over the last decade. These stores sell paper clips, paper, pens, and generic crap you can purchase at 100,000 other stores across the land or with a click of you mouse. Their business concept is dying and they don’t know it or refuse to acknowledge it.

Staples - Annual Store Count Growth

Office Depot - Annual Store Count Growth

Even well run retailers such as Kohl’s and Bed Bath & Beyond have hit the proverbial wall. Remember that total retail sales have only grown by 42% in the last ten years while Kohl’s has increased their store count by 180% and Bed Bath & Beyond has increased their store count by 175%. Despite opening 200 new stores since 2007, Kohl’s profits are virtually flat. Sales per store have deflated by 26% over the last decade as over-cannibalization has worked its magic. Bed Bath & Beyond has managed to keep profits growing as they drove Linens & Things into bankruptcy, but they risk falling into the Best Buy trap as they continue to open new stores. Their sales per store are well below the levels of 2002. Again, there is very little differentiation between these retailers as they all sell cheap crap from Asia, sold at thousands of other stores across the country. With home formation stagnant, where will the growth come from? Answer: It won’t come at all.

Kohl's - Annual Store Count Growth

Bed Bath & Beyond - Annual Store Count Growth

The stories above can be repeated over and over when analyzing the other mega-retailers that dominate our consumer crazed society. Same store sales growth is stagnant. The major chains have over cannibalized themselves. Their growth plans were based upon a foundation of ever increasing consumer debt and ever more delusional Americans spending money they don’t have. None of these retailers has factored a contraction in consumer spending into their little models. But that is what is headed their way. They saw the tide go out in 2009 but they’ve ventured back out into the surf looking for some trinkets, not realizing a tsunami is on the way. The great contraction began in 2008 and has been proceeding in fits and starts for the last four years. The increase in retail sales over the last two years has been driven by inflation, not increased demand. The efforts of the Federal Reserve and Wall Street to reignite our consumer society by pushing subprime debt once more will ultimately fail – again. The mega-retailers will be forced to come to the realization they have far too many stores to meet a diminishing demand.

The top 100 mega-retailers operate 243,000 stores. Will our contracting civilization really need or be able to sustain 14,000 McDonalds, 17,000 Taco Bells & KFCs, 24,000 Subways, 9,000 Wendys, 7,000 7-11s, 8,000 Walgreens, 7,000 CVS’, 4,000 Sears & Kmarts, 11,000 Starbucks, 4,000 Wal-Marts, 1,700 Lowes and 1,800 Targets in five years?  As our economy contracts and more of our dwindling disposable income is directed towards rising energy and food costs, retailers across the land will shut their doors. Try to picture the impact on this country as these retailers are forced to close 50,000 stores. Where will recent college graduates and broke Baby Boomers work? The most profitable business of the future will be producing Space Available and For Lease signs. Betting on the intelligence of the American consumer has been a losing bet for decades. They will continue to swipe that credit card at the local 7-11 to buy those Funions, jalapeno cheese stuffed pretzels with a side of cheese dipping sauce, cartons of smokes, and 32 ounce Big Gulps of Mountain Dew until the message on the credit card machine comes back DENIED.

There will be crescendo of consequences as these stores are closed down. The rotting hulks of thousands of Sears and Kmarts will slowly decay; blighting the suburban landscape and beckoning criminals and the homeless. Retailers will be forced to lay-off hundreds of thousands of workers. Property taxes paid to local governments will dry up, resulting in worsening budget deficits. Sales taxes paid to state governments will plummet, forcing more government cutbacks and higher taxes. Mall owners and real estate developers will see their rental income dissipate. They will then proceed to default on their loans. Bankers will be stuck with billions in loan losses, at least until they are able to shift them to the American taxpayer – again. No politician, media pundit, Federal Reserve banker, retail CEO, or willfully ignorant mindless consumer wants to admit the truth that the last three decades of debt delusion are coming to a tragic bitter end. The smarmy acolytes of Edward Bernays on Wall Street and in corporate America have successfully used propaganda and misinformation to lure generations of weak minded people into debt servitude. But, at the end of the day, you need cash to service the debt. Mind control doesn’t pay the bills.  We will eventually return to normal, just not the normal many had in mind.

“If we understand the mechanism and motives of the group mind, it is now possible to control and regiment the masses according to our will without them knowing it.” – Edward Bernays


EXTEND & PRETEND COMING TO AN END

The real world revolves around cash flow. Families across the land understand this basic concept. Cash flows in from wages, investments and these days from the government. Cash flows out for food, gasoline, utilities, cable, cell phones, real estate taxes, income taxes, payroll taxes, clothing, mortgage payments, car payments, insurance payments, medical bills, auto repairs, home repairs, appliances, electronic gadgets, education, alcohol (necessary in this economy) and a countless other everyday expenses. If the outflow exceeds the inflow a family may be able to fund the deficit with credit cards for awhile, but ultimately running a cash flow deficit will result in debt default and loss of your home and assets. Ask the millions of Americans that have experienced this exact outcome since 2008 if you believe this is only a theoretical exercise. The Federal government, Federal Reserve, Wall Street banks, regulatory agencies and commercial real estate debtors have colluded since 2008 to pretend cash flow doesn’t matter. Their plan has been to “extend and pretend”, praying for an economic recovery that would save them from their greedy and foolish risk taking during the 2003 – 2007 Caligula-like debauchery.

I wrote an article called Extend and Pretend is Wall Street’s Friend about one year ago where I detailed what I saw as the moneyed interest’s master plan to pretend that hundreds of billions in debt would be repaid, despite the fact that declining developer cash flow and plunging real estate prices would make that impossible. Here are a couple pertinent snippets from that article:

“A systematic plan to create the illusion of stability and provide no-risk profits to the mega-Wall Street banks was implemented in early 2009 and continues today. The plan was developed by Ben Bernanke, Hank Paulson, Tim Geithner and the CEOs of the criminal Wall Street banking syndicate. The plan has been enabled by the FASB, SEC, IRS, FDIC and corrupt politicians in Washington D.C. This master plan has funneled hundreds of billions from taxpayers to the banks that created the greatest financial collapse in world history.

Part two of the master cover-up plan has been the extending of commercial real estate loans and pretending that they will eventually be repaid. In late 2009 it was clear to the Federal Reserve and the Treasury that the $1.2 trillion in commercial loans maturing between 2010 and 2013 would cause thousands of bank failures if the existing regulations were enforced. The Treasury stepped to the plate first. New rules at the IRS weren’t directly related to banking, but allowed commercial loans that were part of investment pools known as Real Estate Mortgage Investment Conduits, or REMICs, to be refinanced without triggering tax penalties for investors.

The Federal Reserve, which is tasked with making sure banks loans are properly valued, instructed banks throughout the country to “extend and pretend” or “amend and pretend,” in which the bank gives a borrower more time to repay a loan. Banks were “encouraged” to modify loans to help cash strapped borrowers. The hope was that by amending the terms to enable the borrower to avoid a refinancing that would have been impossible, the lender would ultimately be able to collect the balance due on the loan. Ben and his boys also pushed banks to do “troubled debt restructurings.” Such restructurings involved modifying an existing loan by changing the terms or breaking the loan into pieces. Bank, thrift and credit-union regulators very quietly gave lenders flexibility in how they classified distressed commercial mortgages. Banks were able to slice distressed loans into performing and non-performing loans, and institutions were able to magically reduce the total reserves set aside for non-performing loans.

If a mall developer has 40% of their mall vacant and the cash flow from the mall is insufficient to service the loan, the bank would normally need to set aside reserves for the entire loan. Under the new guidelines they could carve the loan into two pieces, with 60% that is covered by cash flow as a good loan and the 40% without sufficient cash flow would be classified as non-performing. The truth is that billions in commercial loans are in distress right now because tenants are dropping like flies. Rather than writing down the loans, banks are extending the terms of the debt with more interest reserves included so they can continue to classify the loans as “performing.” The reality is that the values of the property behind these loans have fallen 43%. Banks are extending loans that they would never make now, because borrowers are already grossly upside-down.”

Master Plan Malfunction

You have to admire the resourcefulness of the vested interests in disguising disaster and pretending that time will alleviate the consequences of their insatiable greed, blatant criminality and foolish risk taking. Extending bad loans and pretending they will be repaid does not create the cash flow necessary to actually pay the interest and principal on the debt. The chart below reveals the truth of what happened between 2005 and 2008 in the commercial real estate market. There was an epic feeding frenzy of overbuilding shopping centers, malls, office space, industrial space and apartments. During the sane 1980’s and 1990’s, commercial real estate loan issuance stayed consistently in the $500 billion to $700 billion range. The internet boom led to a surge to $1.1 trillion in 2000, with the resultant pullback to $900 billion by 2004. But thanks to easy Al and helicopter Ben, the bubble was re-inflated with easy money and zero regulatory oversight. Commercial real estate loan issuance skyrocketed to $1.6 trillion per year by 2008. Bankers sure have a knack for doing the exact opposite of what they should be doing at the exact wrong time. They doled out a couple trillion of loans to delusional developers at peak prices just prior to a historic financial cataclysm.

The difference between bad retail mortgage loans and bad commercial loans is about 25 years. Commercial real estate loans usually have five to seven year maturities. This meant that an avalanche of loans began maturing in 2010 and will not peak until 2013. With $1.2 trillion of loans coming due between 2010 and 2013, disaster for the Wall Street Too Big To Fail banks awaited if the properties were valued honestly. A perfect storm of declining property values and plunging cash flows for developers should have resulted in enormous losses for Wall Street banks and their shareholders, resulting in executives losing not only their obscene bonuses but even their jobs. Imagine the horror for the .01%.

The fact is that commercial property prices are currently 42% below the 2007 – 2008 peak. The slight increase in the national index is solely due to strong demand for apartments, as millions of Americans have been kicked out of their homes by Wall Street bankers using fraudulent loan documentation to foreclose on them. The national index has recently resumed its fall. Industrial and retail properties are leading the descent in prices according to Moodys. The master plan of extend and pretend was implemented in 2009 and three years later commercial real estate prices are 10% lower, after the official end of the recession.

Part one of the “extend and pretend” plan has failed. Part two anticipated escalating developer cash flows as the economy recuperated, Americans resumed spending like drunken sailors and retailers began to rake in profits at record levels again. Reality has interfered with their desperate last ditch gamble. Office vacancies remain at 17.3%, close to 20 year highs, as 12.3 million square feet of new space came to market in 2011. Vacancies are higher today than they were at the end of the recession in December 2009. The recovery in cash flow has failed to materialize for commercial developers. Strip mall vacancies at 11% remain stuck at 20 year highs. Regional mall vacancies at 9.2% linger near all-time highs. Vacancies remain elevated, with no sign of decreasing. Despite these figures, an additional 4.9 million square feet of new retail space was opened in 2011. The folly of this continued expansion will be revealed as bricks and mortar retailers are forced to close thousands of stores in the next five years.

It is clear the plan put into place three years ago has failed. Extending and pretending doesn’t service the debt. Only cash flow can service debt.

Now What?

Extending and pretending that hundreds of millions in commercial loans were payable for the last three years is now colliding with a myriad of other factors to create a perfect storm in 2012 and 2013. The extension of maturities has now set up a far more catastrophic scenario as described by Chris Macke, senior real estate strategist at CoStar Group:

“As banks and property owners continue to partake in loan extensions amid a softening economy, commercial banks continue to “delay and pray” that property values will rise. Many loans are piled up and concentrated in this year, and at the same time, the economy is slowing. This dilemma has resulted in the widening of what is commonly termed the “loan maturity cliff,” which is attributed to the so called extend-and-pretend loans. During the market downturn, lenders extended the maturity dates of loans with properties that had current values below their balances. Instead, however the practice has resulted in a race for property values to try to catch up with the loan maturity dates.”

The Federal Reserve, Wall Street banks, Mortgage Bankers Association and the rest of the confederates of collusion will continue the Big Lie for as long as possible. They point to declining commercial default rates as proof of improvement. The chart below details the 4th quarter default rates for real estate loans over the last six years. Default rates in the 4th quarter of 2009 peaked for all real estate loan types. Still, today’s default rate is 450% higher than the rate in 2006. A critical thinker might ask how commercial default rates could fall from 8.75% to 6.12% when commercial vacancies have increased and commercial property values have fallen. It’s amazing how low default rates can fall when a bank doesn’t require payments or collateral to back up the loan and can utilize accounting gimmicks to avoid write-offs.


Real estate loans

All

Booked in domestic offices

Residential 

Commercial 

Farmland

2011:4

8.22

9.86

6.12

3.26

2010:4

9.07

10.11

7.98

3.61

2009:4

9.55

10.45

8.75

3.43

2008:4

6.03

6.64

5.49

2.28

2007:4

2.90

3.07

2.75

1.51

2006:4

1.70

1.95

1.32

1.41

The reality as detailed by honest analysts is much different than the numbers presented by Ben Bernanke and his banker cronies. A recent article from the Urban Land Institute provides some insight into the current state of the market:

 Ann Hambly, who previously ran the commercial servicing departments at Prudential, Bank of New York, Nomura, and Bank of America said a wave of defaults is coming in commercial mortgage–backed securities (CMBS). And Carl Steck, a principal in MountainSeed Appraisal Management, an Atlanta-based firm that deals in the commercial real estate space, said property values are still falling.

Noting that CMBS investors booked $6 billion in real losses in 2011 and have already taken on $2 billion more in losses so far this year, Hambly told reporters in a private briefing that “it’s going to take a miracle” for many borrowers to refinance their deals when they come due between now and 2017.

Carl Steck said that lenders who are taking over the portfolios of failed institutions are finding that the values of the loans “are coming in a lot lower than they ever thought they would.” And as a result, he thinks a “fire sale” of commercial loans is just over the horizon.

Analysts expect 2012 to be a record-setting year for commercial real estate defaults. Last week delinquencies for office and retail loans hit their highest-ever levels, according to Fitch Ratings. The value of all delinquent commercial loans is now $57.7 billion, according to Trepp, LLC. If you think the criminal Wall Street banks limited their robo-signing fraud to just poor homeowners, you would be mistaken. The fraud uncovered in the commercial lending orbit will dwarf the residential swindle. Research by Harbinger Analytics Group shows the widespread use of inaccurate, fraudulent documents for land title underwriting of commercial real estate financing. According to the report:

This fraud is accomplished through inaccurate and incomplete filings of statutorily required records (commercial land title surveys detailing physical boundaries, encumbrances, encroachments, etc.) on commercial properties in California, many other western states and possibly throughout most of the United States. In the cases studied by Harbinger, the problems are because banks accepted the work of land surveyors who “have committed actual and/or constructive fraud by knowingly failing to conduct accurate boundary surveys and/or failing to file the statutorily required documentation in public records.”


Your Ad Here

The Wall Street geniuses bundled commercial real estate mortgages and re-sold them as securities around the world. The suckers holding those securities, already staggering from the overabundance of empty office space, will be devastated if it turns out they have no claim to the properties. They will rightly sue the lenders for falsely representing the properties. Mortgage holders in these cases may also turn to their title insurance to cover any losses. It is unknown if the title insurance companies have the wherewithal to withstand enormous claims on costly commercial properties. It looks like that light at the end of the tunnel is bullet train headed our way.

One of the fingers in the dyke of the “extend and pretend” dam has been removed by the FASB. The new leak threatens to turn into a gusher.


Andy Miller, cofounder of Miller Frishman Group, and one of the few analysts who saw the real estate crash coming two years before it surprised Bernanke and the CNBC cheerleaders sees a flood of defaults on the horizon. In a recent interview with The Casey Report Miller details a dramatic turn for the worse in the commercial real estate market he has witnessed in the last few months. His company deals with distressed commercial real estate. This segment of his business was booming in 2009 and into the middle of 2010. Then magically, there was no more distress as the “extend and pretend” plan was implemented by the governing powers. The distressed market dried up completely until November 2011. Miller describes what happened next:

“All of a sudden, right after Thanksgiving in 2011, the floodgates opened again. In the last six weeks we probably picked up seven or eight receiverships – and we’re now seeing some really big-ticket properties with major loans on them that have gone into distress, and they’re all sharing some characteristics in common. In 2008 and 2009, these borrowers were put on a workout or had a forbearance agreement put into place with their lenders. In 2009, their lenders were thinking, “Let’s do a two- or three-year workout with these guys. I’m sure by 2012 this market is going to get a lot better.” Well, 2012 is here now, and guess what? It’s not any better. In fact I would argue that it’s still deteriorating.”

Why the sudden surge in distressed properties coming to market in late 2011? It seems the FASB finally decided to grow a pair of balls after being neutered by Bernanke and Geithner in 2009 regarding mark to market accounting. They issued an Accounting Standards Update (ASU) that went into effect for all periods after June 15, 2011called Clarifications to Accounting for Troubled Debt Restructurings by Creditors. Essentially, if a lender is involved in a troubled debt restructuring with a debtor, including a forbearance agreement or a workout, the property MUST be marked to market. Andy Miller understands this is the beginning of the end for “extend and pretend”:

“I believe it’s a huge deal because it means you don’t have carte blanche anymore to kick the can down the road. After all, kicking the can down the road was a way to avoid taking a big hit to your capital. Well, you can’t do that anymore. It forces you to cut through the optical illusions by writing this asset to its fair market value.”

Ben Bernanke and the Wall Street banks are running out tricks in their bag of deception. Wall Street banks created billions in profits by using accounting entries to reduce their loan loss reserves. They’ve delayed mortgage foreclosures for two years to avoid taking the losses on their loan portfolios. They’ve pretended their commercial loan portfolios aren’t worth 50% less than their current carrying value. Bernanke has stuffed his Federal Reserve balance sheet with billions in worthless commercial mortgage backed securities. The Illusion of Recovery is being revealed as nothing more than a two bit magician’s trick. In the end it always comes back to cash flow. The debt cannot be serviced and must be written off. Thinking the American consumer will ride to the rescue is a delusional flight of the imagination.

Apocalypse Now – The Future of Retailers & Mall Owners


When I moved to my suburban community in 1995 there were two thriving shopping centers within three miles of my home and a dozen within a ten mile radius. Seventeen years later the population has increased dramatically in this area, and these two shopping centers are in their final death throes. The shopping center closest to my house has a vacant Genuardi grocery store(local chain bought out and destroyed by Safeway), vacant Blockbuster, vacant Sears Hardware, vacant Donatos restaurant, vacant book store, and soon to be vacant Pizza Pub. It’s now anchored by a near bankrupt Rite Aid and a Dollar store. This ghost-like strip mall is in the midst of a fairly thriving community. Anyone with their eyes open as they drive around today would think Space Available is the hot new retailer. According to the ICSC there are 105,000 shopping centers in the U.S., occupying 7.3 billion square feet of space. Total retail square feet in the U.S. tops 14.2 billion, or 46 square feet for every man, woman and child in the country. There are more than 1.1 million retail establishments competing for every discretionary dollar from consumers.

Any retailer, banker, politician, or consumer who thinks we will be heading back to the retail glory days of 2007 is delusional. Retail sales reached a peak of $375 billion per month in mid 2008. Today, retail sales have reached a new “nominal” peak of $400 billion per month. Even using the highly questionable BLS inflation figures, real retail sales are still below the 2008 peak. Using the inflation rate provided by John Williams at Shadowstats, as measured the way it was in 1980, real retail sales are 15% below the 2008 peak. The unvarnished truth is revealed in the declining profitability of major retailers and the bankruptcies and store closings plaguing the industry. National retail statistics and recent retailer earnings reports paint a bleak picture, and it’s about to get bleaker.

Retail sales in 1992 totaled $2.0 trillion. By 2011 they had grown to $4.7 trillion, a 135% increase in nineteen years. A full 64% of this rise is solely due to inflation, as measured by the BLS. In reality, using the true inflation figures, the entire increase can be attributed to inflation. Over this time span the U.S. population has grown from 255 million to 313 million, a 23% increase. Median household income has grown by a mere 8% over this same time frame. The increase in retail sales was completely reliant upon the American consumers willing to become a debt slaves to the Wall Street bank slave masters. It is obvious we have learned to love our slavery. Credit card debt grew from $265 billion in 1992 to a peak of $972 billion in September of 2008, when the financial system collapsed. The 267% increase in debt allowed Americans to live far above their means and enriched the Wall Street banking cabal. The decline to the current level of $800 billion was exclusively due to write-offs by the banks, fully funded by the American taxpayer.

Credit cards are currently being used far less as a way to live beyond your means, and more to survive another day. This can be seen in the details underlying the monthly retail sales figures. On a real basis, with inflation on the things we need to live like energy, food and clothing rising at a 10% clip, retail sales are declining. Gasoline, food and medicine are the drivers of retail today. The surge in automobile sales is just another part of the “extend and pretend” plan, as Bernanke provides free money to banks and finance companies so they can make seven year 0% interest loans to subprime borrowers. Easy credit extended to deadbeats will not create the cash flow needed to repay the debt. The continued penetration of on-line retailers does not bode well for the dying bricks and mortar zombie retailers like Sears, JC Penny, Macys and hundreds of other dead retailers walking. With gas prices soaring, the economy headed back into recession and the Federal Reserve out of ammunition, Andy Miller sums up the situation nicely:

“Well, I think we’re headed into an economy right now where there’s just not a lot of upside. Do we think, for example, in the shopping center business, that retail and consumer spending is going to go way up? Certainly not. I think that as times get tougher and unemployment remains high, it’s going to have a negative impact on consumer spending. In almost in any city in America right now, it doesn’t take a genius to see how much retail space has been constructed and is sitting there empty. Vacancy rates are as high as I’ve seen them in almost every venue that I visit. I’m very concerned about the retail business, and I think it’s extremely dangerous right now.”

The major big box retailers have been reporting their annual results in the last week. The results have been weak and even those whose results are being spun as positive by the mainstream media are performing dreadfully compared to 2007. A few examples are in order:

  • Home Depot was praised for their fantastic 2011 result of $70 billion in sales and $6.7 billion of income. The MSM failed to mention that sales are $7 billion lower than 2007, despite having 18 more stores and profit exceeded $7.2 billion in 2007. Sales per square foot have declined from $335 to $296, a 12% decline in four years.
  • Target made $2.9 billion on revenue of $67 billion in 2011. $953 million of this profit was generated from their credit card this year versus $744 million last year because they reduced their loan loss reserve by $260 million. Target is supposedly a retailer, but 33% of their bottom line comes from a credit card they desperately tried to sell in 2009. They have increased their store count from 1,600 to 1,800 since 2007 and their profit is flat. Sales per square foot have declined from $307 to $280 since 2007.
  • J.C. Penney is a bug in search of a windshield. Their sales have declined from $20 billion in 2007 to $17 billion in 2011 despite increasing their store count from 1,067 to 1,114. Their profits have plunged from $1.1 billion to a loss of $152 million. Their sales per square foot have plunged by 14% since 2007. Turning to a former Apple marketing guru as their new CEO will fail. Everyday low pricing is not going to work on Americans trained like monkeys to salivate at the word SALE.
  • The death spiral of Sears/Kmart is a sight to see. As the anchor in hundreds of dying malls across the land, this retail artifact will be joining Montgomery Ward on the scrap heap of retail history in the next few years. Its eventual bankruptcy and liquidation will leave over 4,000 rotting carcasses to spoil our landscape. The one-time genius and heir to the Warren Buffett mantle – Eddie Lampert – has proven to be as talented at retailing as his buddy Jim Cramer is at picking stocks. He has managed to decrease sales by $10 billion, from $53 billion to $43 billion in the space of four years despite opening 247 new stores. That is not an easy feat to accomplish. At least he was able to reduce profits from $1.5 billion to $133 million and drive the sales per square foot in his stores down by 15%.
  • Widely admired Best Buy has screwed the pooch along with the other foolish retailers that have massively over expanded in the last decade. They have increased their domestic sales from $31 billion to $37 billion, a 19% increase in four years. This increase only required a 444 store expansion, from 873 stores to 1,317 stores. A 51% increase in store count for a 19% increase in sales seems to be a bad trade-off. Their chief competitor – Circuit City – went belly-up during this time frame, making the relative sales increase even more pathetic. The $6 billion increase in sales resulted in a $100 million decline in profits and a 13% decrease in sales per square foot since 2007. It might behoove the geniuses running this company to stop building new stores.
  • The retailer that committed the greatest act of suicide in the last decade is Lowes. Their act of hubris, as Home Depot struggled in the mid 2000’s, is coming home to roost today. They increased their store count from 1,385 to 1,749 over four years. This 26% increase in store count resulted in an increase in sales from $47 billion to $49 billion, a 4% boost. Profitability has plunged from over $3 billion to under $2 billion over this same time frame. They’ve won the efficiency competition by seeing their sales per square feet fall by an astounding 21% over the last four years. I’ve witnessed their ineptitude as they opened four stores within 10 miles of each other in Montgomery County, PA and cannibalized themselves to death. The newest store, three miles from my house, is a pleasure to shop as there is generally more staff than customers even on a Saturday afternoon. This beautiful new store will be vacant rotting hulk within three years.

Do the results of these retail giants jive with the retail recovery stories being spun by the corporate mainstream media? When you see some stock shill on CNBC touting one of these retailers, realize he is blowing smoke up your ass. These six struggling retailers account for over 1.1 billion square feet of retail space in the U.S. One or more of them anchor every mall in America. Wal-Mart (600 million square feet in the U.S.) and Kohl’s (82 million square feet) continue to struggle as their lower middle class customers can barely make ends meet. The perfect storm is developing and very few people see it coming. Extend and pretend has failed. Americans are tapped out. Home prices continue to fall. Energy and food prices continue to rise. Wages are stagnant. Job growth is weak. Middle and lower class Americans are using credit cards just to pay their basic living expenses. The 99% are not about to go on a spending binge.

As consumers reduce consumption, retailers lose profits and will be forced to close stores. It is likely that at least 150,000 retail stores will need to close in the next five years. Less stores means less rent for mall developers. Less rent means the inability to service their debt as the value of their property declines with the outcome of Ghost Malls haunting your community. Maybe good old American ingenuity will come to the rescue as we convert ghost malls into FEMA prison camps for uncharged Ron Paul supporters, Obamacare death panel implementation centers, TSA groping educational facilities, housing for the millions kicked out of their homes by the Wall Street .01%ers, and bomb shelters for the imminent Iranian invasion.

Debt default means huge losses for the Wall Street criminal banks. Of course the banksters will just demand another taxpayer bailout from the puppet politicians. This repeat scenario gives new meaning to the term shop until you drop. Extending and pretending can work for awhile as accounting obfuscation, rolling over bad debts, and praying for a revival of the glory days can put off the day of reckoning for a couple years. Ultimately it comes down to cash flow, whether you’re a household, retailer, developer, bank or government. America is running on empty and extending and pretending is coming to an end.


BERNANKE PLEDGES TO SCREW YOUR GRANDMOTHER FOR AT LEAST TWO MORE YEARS

“A system of capitalism presumes sound money, not fiat money manipulated by a central bank. Capitalism cherishes voluntary contracts and interest rates that are determined by savings, not credit creation by a central bank.” – Ron Paul


I wonder what goes through Ben Bernanke’s mind as he sits in his gold plated boardroom in the majestic Marriner Eccles building in Washington DC and decides to screw grandmothers in order to further enrich Wall Street bankers. He just pledged to keep interest rates at zero percent for two more years. Ben is a supposedly book smart man. Does he have no guilt or shame for what he has wrought? How does he sleep at night knowing he has created bloody revolutions around the globe due to his inflationary zero interest policy? People are dying because he has decided that an elite group of Wall Street bankers who recklessly brought down the worldwide financial system in 2008 deserve to be kept alive and enriched at the expense of the many.

He uses words like transitory to describe inflation. Even as the price of gold reveals his lies he continues to promote policies that will lead to the demise of the USD and our economic system. There is only one way to counter his lies – truth. With a corporate fascist government run by the few for the benefit of the few, telling the truth is treason as stated by Ron Paul:

“Truth is treason in the empire of lies.”

The storyline being sold to you by Bernanke, his Wall Street masters, and their captured puppets in Washington DC is that deflation is the great bogeyman they must slay. They make these statements from their ivory jewel encrusted towers as the real people in the real world deal with reality. The reality since Ben Bernanke announced his QE2 policy in August 2010 is:

  • Unleaded gas prices are up 45%.
  • Heating oil prices are up 46%.
  • Corn prices are up 71%.
  • Soybean prices are up 26%.
  • Rice prices are up 13%.
  • Pork prices are up 31%.
  • Beef prices are up 25%.
  • Coffee prices are up 38%.
  • Sugar prices are up 48%.
  • Cotton prices are up 13%.
  • Gold prices are up 42%.
  • Silver prices are up 115%.
  • Copper prices are up 23%.

These are the facts and they fly in the face of the lies being spouted by Bernanke and his Federal Reserve cronies. Words like transitory, quantitative easing, extended period, and liquidity are used by Professor Bernanke to obscure what he is doing to the average American. He lives in a world of theories and models, while the rest of us live in the real world, where theories kill and impoverish millions. There are 40 million Americans over the age of 65 today. You might even know a few of them. There will be 10,000 people per day joining their ranks for the next nineteen years as the Baby Boomers retire en masse. The vast majority of these senior citizens are risk averse. Some disturbing facts reveal the true picture for seniors today:

  • Most senior citizens do not have a traditional pension plan because they have been going out of style over the past 30 years.  In 1980, some 39% of private-sector workers had a pension that guaranteed a steady payout during retirement. Today that number stands closer to 15%, according to the Employee Benefit Research Institute in Washington, D.C. 
  • 35% of Americans already over the age of 65 rely almost entirely on Social Security payments alone. 
  • Approximately 3 out of 4 Americans start claiming Social Security benefits the moment they are eligible at age 62.  Most are doing this out of necessity. This probably has something to do with the fact that the median retirement savings of households over the age of 65 is less than $45,000.   
  • The median household net worth of all Americans fell from $97,000 in 2005 to $70,000 in 2009. The median household net worth of households over 65 years old fell from $200,000 in 2005 to approximately $150,000 in 2009. Two thirds of seniors’ net worth is the equity in their primary residence, meaning they have $50,000 or less of financial assets (cash, stocks, bonds). 
  • 20% of all the households in the United States have zero or negative net worth.  

This data sets the scene for the crime of the century committed by Ben Bernanke and his co-conspirators on the Federal Reserve Board. The easiest way to understand how Ben has screwed seniors and savers to pay off his Wall Street and K Street benefactors is to use a real life example.

A seventy five year old widow living in her paid off row home, bought in 1955, gets by on her annual social security income of $17,000 and the income generated from the $125,000 in retirement savings left from her husband’s forty years working as a truck driver. She is a child of the Depression, financially unsophisticated and risk averse. This describes most senior citizens. The widow and her late husband were only comfortable investing their money in CDs and money market funds. In 2007, before the Wall Street created financial collapse, savers and risk averse senior citizens could earn 5% in a money market fund, 5.5% in a 2 year CD and 6% in a 5 year CD. The widow could supplement her meager social security income with an additional $6,000 of interest income. This money was used to pay the ever increasing real estate taxes, medical insurance premiums, upkeep on the old house, and necessities like food, fuel, insurance and heating.

Fast forward four years to 2011. Savers and seniors are getting average interest rates on 6-month CDs this week of 0.58% nationwide, according to Bankrate.com. Rates on one-year CDs fell this week to 0.86%, while 5- year CDs fetched 2.04%. Money market funds are paying a pitiful 0.16% on average. The widow that was able to generate a risk free $6,000 only four years ago has only been able to generate less than $500 per year for the last three years. In addition, the government manipulated CPI, as calculated by the drones at the Bureau of Labor Statistics, was used to deny senior citizens an increase in their Social Security payments for the last two years. Meanwhile, the prices of food, fuel, clothing, insurance, medical care, and local taxes have been skyrocketing due to Federal Reserve created inflation. Do you think the number of Americans on food stamps surging from 26.3 million in 2007 to 45.8 million today has anything to do with Bernanke’s zero interest rate, inflationary policies?

This is not a theoretical hypothesis. Ben Bernanke has purposely sacrificed the savers and seniors in this country at the satanic altar of his Wall Street high priests of debt. According to the BEA data on personal income, in the 3rd quarter of 2008 savers and seniors were able to earn $1.42 trillion of interest income. By the 3rd quarter of 2010 these same people were only able to earn $984 billion of interest income due to Ben Bernanke’s zero interest rate policy. Make no mistake about it, the $436 billion difference was taken out of the pockets of senior citizens and Americans trying to save for their futures and deposited into the accounts of the mega-Wall Street banks that destroyed our financial system with their reckless greed induced debt toga party. The beneficiaries of zero interest rates, QE1, QE2, and all future QEs are Wall Street bankers and heavily indebted entities – namely our profligate Federal Government, who make drunken sailors, seem fiscally responsible. The victims of zero interest rates and quantitative easing are savers and risk averse senior citizens as their income has plummeted and inflation has ravaged their everyday existence. Meanwhile, the Wall Street fat cats have paid themselves over $70 billion in bonuses since 2008.

The fantasy world of moderate inflation is a myth created by the Federal Reserve in conjunction with the government bureaucrats in Washington DC. These people have tortured the CPI calculation worse than a Muslim being water boarded at Guantanamo Bay. Alan Greenspan, bubble blower extraordinaire, began the process of systematically screwing grandmothers in the 1980s. As a way to hide and obscure the true level of inflation caused by running endless deficits supporting a welfare/warfare empire, Greenspan and Clinton implemented devious adjustments to the CPI in order to screw senior citizens and allow Big Government to get bigger while stealthily impoverishing the middle class. One man has pulled back the curtain on the Wizards of Inflation to reveal the truth. John Williams at www.shadowstats.com publishes the true rate of inflation as measured in 1980, prior to the fraudulent manipulation of the CPI. The reality is that inflation has not dropped below 5% since 1987 and currently exceeds 10%.


John Williams described the Greenspan/Clinton conspiracy to defraud Americans:

“The Greenspan argument was that when steak got too expensive, the consumer would substitute hamburger for the steak, and that the inflation measure should reflect the costs tied to buying hamburger versus steak, instead of steak versus steak. Of course, replacing hamburger for steak in the calculations would reduce the inflation rate, but it represented the rate of inflation in terms of maintaining a declining standard of living. Cost of living was being replaced by the cost of survival. The old system told you how much you had to increase your income in order to keep buying steak. The new system promised you hamburger, and then dog food, perhaps, after that. Over a period of several years, straight arithmetic weighting of the CPI components was shifted to a geometric weighting. The Greenspan benefit of a geometric weighting was that it automatically gave a lower weighting to CPI components that were rising in price, and a higher weighting to those items dropping in price.” 

Now we hear the latest bipartisan plan to “save” Social Security is to alter the CPI again and further defraud Americans by pretending inflation does not exist. Why address a problem when you can obfuscate, misinform and lie? Anyone with critical thinking skills can clearly see that since 2007 real inflation for our widow has ranged between 5% and 10%, while her subsistence level income has been slashed by 26% due to Ben Bernanke’s zero interest rate policy. The good news is our widow will have the peace of mind knowing the price of steak and hamburger hasn’t really risen as she decides on whether to dine on dog food or cat food tonight.


“Government spending is always a “tax” burden on the American people and is never equally or fairly distributed. The poor and low-middle income workers always suffer the most from the deceitful tax of inflation and borrowing.” – Ron Paul


The Road to Impoverishment & Authoritarianism

There is a direct connection between Federal Reserve policies and the impoverishment of the middle class and seniors. The average American does not appreciate the disastrous consequences of deficit spending and currency devaluation by the Federal Reserve. Ron Paul has been sounding the warning for over a decade, but no one has been listening:

“The greatest threat facing America today is the disastrous fiscal policies of our own government, marked by shameless deficit spending and Federal Reserve currency devaluation. It is this one-two punch– Congress spending more than it can tax or borrow, and the Fed printing money to make up the difference– that threatens to impoverish us by further destroying the value of our dollars.”

It is no longer a threat. It is reality. The chart below tells the story.

The Federal Funds rate was 6.5% when George W. Bush assumed the presidency in 2000. The economy was booming, unemployment was 4.2%, the country was running fiscal surpluses, and the National Debt stood at $5.7 trillion. Alan Greenspan was the Federal Reserve Chairman and had been in that position since 1987. The Federal Funds Rate averaged 5.25% from 1990 through 2000 as the country grew strongly and America came the closest to full employment in its history. In 2001 Greenspan set in motion the creation of a tsunami of debt that swept over the entire country in 2008. The short shallow 2001 recession convinced Greenspan to reduce rates to 1% and keep them below 3% until the middle of 2005. He did this with the full support of his right hand man at the Fed – Ben Bernanke.

“The failure of Chairman Greenspan and other FOMC members to address the fiscal and monetary problems of the United States during his almost two decades at the Fed has left the United States on a trajectory for economic stagnation, hyperinflation, and the attendant political and social costs of such policies.”Chris Whalen Inflated – How Money & Debt Built the American Dream 

Greenspan kept interest rates excessively low three years into an economic recovery, creating the largest bubble in world history. He handed the inflation baton to Bernanke in February 2006 and Ben has been sprinting at top speed for the last five years printing money faster than a Japanese bullet train. With a true rate of inflation running between 5% and 10% during the 2000 through 2011 time frame, market driven interest rates should have been in that same range. But Alan and Ben have kept the Federal Funds rate at an average level of 2.25% over this period. The result has been a consumer debt bubble, housing bubble and now a government debt bubble. Instead of accepting the consequences of excessive liquidity, excessive debt and mal-investment by the Wall Street banks and liquidating the toxic poison from our economic system with the resulting economic depression and losses borne by the stockholders and bondholders of the criminal Wall Street enterprises, Ben Bernanke and Tim Geithner chose to sacrifice the American taxpayer, savers, and seniors to keep their Wall Street masters in their NYC penthouses and Hamptons estates.

The shrieking liberal left blames capitalism and demands more social welfare benefits for their entitled constituents. The fact is we have not had true capitalism in this country since 1913.

“Capitalism should not be condemned, since we haven’t had capitalism. A system of capitalism presumes sound money, not fiat money manipulated by a central bank. Capitalism cherishes voluntary contracts and interest rates that are determined by savings, not credit creation by a central bank.” – Ron Paul


The Day the Dollar Died – August 15, 1971

“With the exception only of the period of the gold standard, practically all governments of history have used their exclusive power to issue money to defraud and plunder the people.” – F.A. von Hayak 

“The road paved with inflation and debt is also the road to authoritarianism.” – Chris Whalen Inflated – How Money & Debt Built the American Dream 

On August 15, 1971, exactly forty years ago this week, Richard Nixon closed the gold window and removed the last vestiges of restraint on politicians and central bankers. Politicians were free to make promises that couldn’t be kept to buy votes and central bankers were free to print fiat dollars and create inflation to support an ever growing warfare/welfare state. On that date the non-manipulated CPI was 40.8. Today, forty years later, the highly manipulated CPI is 225.7, a 553% increase. In reality, true inflation has risen more than 700% since August 1971. Some other facts put this relentless inflation into perspective:

  • GDP has ascended from $1.1 trillion to $15.0 trillion today, a 1,364% increase in forty years.
  • The National Debt has risen from $400 billion to $14.5 trillion, a 3,625% increase in forty years.
  • Total wage income has grown from $588 billion to $6.627 trillion today, a 1,127% increase in forty years.
  • Consumer credit outstanding has accumulated from $141 billion to $2.446 trillion today, a 1,735% increase in forty years.
  • War spending has increased from $95 billion to $966 billion today, a 1,017% increase in forty years. The U.S. was in the midst of the Vietnam War in 1971.
  • Social welfare transfers from the Federal government for Social Security, Medicare, Medicaid, Veterans, and Unemployment increased from $87 billion to $2.305 trillion today, a 2,649% increase in forty years.

These facts prove how twisted and warped our economic system and society have become. Real wages are lower than they were in 1971 as families were forced to put two parents into the workforce forcing children to be raised by strangers, with the resultant social consequences. The corporate media, financial industrial complex and housing industrial complex convinced Americans they had to keep up with the Joneses with new luxury automobiles, extravagant McMansions, and the expensive accoutrements that went along with these representations of fake wealth. The financial plundering of the country by the peddlers of debt on Wall Street could not have happened without the easy money, no regulation policies of the Federal Reserve for the last decade. The National Debt is increasing at a rate of 10% per year while GDP is increasing at a rate of less than 2% per year. Anyone with even the most basic math skills can see this train is going to go off the tracks. Our spending on social welfare benefits has grown at a rate twice as high as our GDP growth for the last forty years and the establishment in Washington has no resolve to address these un-payable promises. The liberals squealed like stuck pigs over the horrific non-cuts in the recent joke debt ceiling compromise. The neo-cons who control the Republican agenda think $1 trillion per year for their war machine is far too little and endangers our very existence. Consumers refuse to accept the reality of their precarious existence balanced on the edge of their 13 credit cards.

Americans of all parties, ages, races, persuasions, education and beliefs have shirked their civic and moral responsibility to future generations. The rampant greed on Wall Street, corruption in Washington DC, shallowness of the American people and cowardice of all in not accepting responsibility for their actions will lead to the end of this country as we know it. There is no courage among the political class in Washington DC to truly take the steps required to save this country from the most predictable cataclysm in history. The politicians and citizens they represent have decided to delegate their civic responsibility to Ben Bernanke. He has tripled the Federal Reserve’s balance sheet by acquiring the toxic mortgage “assets” of the Wall Street banks and buying $600 billion of U.S. Treasuries. The Federal Funds Rate is .07%. His announcement of zero interest rates for two more years proves he has run out of theories and ammo. Jim Rickards, in 2010, pointed out the danger in Bernanke’s reckless policies:

“Fed Chairman Bernanke wakes up every morning and tries to trash the dollar with quantitative easing, zero interest rates and swap lines with the central banks. But it has not been working. The Fed has never taken it to the next step and asked what happens when quantitative easing does not work.”

The utter failure of QE2, hollow Congressional spending “cuts” that will keep the National Debt on track towards $23 trillion by 2021, S&P downgrade and recent plunge in the stock market are the first cracks in the façade of the great American Empire. We have entered a period of institutional crisis and this fiscal spiral will lead us further into the clutches of a more centralized authoritarian form of government unless the people stand up to the junta of mercantilist oligarchs that control this country. Do we want to relinquish our remaining freedoms and liberties for the cloak of corporate fascist authoritarian central planning disguised as safety and security? The Romans chose security over freedom. The time has come to make a choice about what we will become. Ben Franklin stated the obvious two centuries ago:

 Those who would give up Essential Liberty
to purchase a little Temporary Safety,
deserve neither Liberty nor Safety.

– Ben Franklin


PEACOCK SYNDROME – AMERICA’S FATAL DISEASE

“There will be, in the next generation or so, a pharmacological method of making people love their servitude, and producing dictatorship without tears, so to speak, producing a kind of painless concentration camp for entire societies, so that people will in fact have their liberties taken away from them, but will rather enjoy it, because they will be distracted from any desire to rebel by propaganda or brainwashing, or brainwashing enhanced by pharmacological methods. And this seems to be the final revolution.”  – Aldous Huxley


Researchers at the University of Texas recently published a study about why men buy or lease flashy, extravagant, expensive cars like a gold plated Porsche Carrera GT. There conclusion was:

“Although showy spending is often perceived as wasteful, frivolous and even narcissistic, an evolutionary perspective suggests that blatant displays of resources may serve an important function, namely as a communication strategy designed to gain reproductive rewards.”

To put that in laymen’s terms, guys drive flashy expensive cars so they can get laid. Researcher Dr Vladas Griskevicius said: “The studies show that some men are like peacocks.  They’re the ones driving the bright colored sports car.”

Lead author Dr Jill Sundie said: “This research suggests that conspicuous products, such as Porsches, can serve the same function for some men that large and brilliant feathers serve for peacocks.” The male urge to merge with hot women led them to make fiscally irresponsible short term focused decisions. I think the researchers needed to broaden the scope of their study. Millions of Americans, men and women inclusive, have been infected with Peacock Syndrome. Millions of delusional Americans thought owning flashy things, living in the biggest McMansion, and driving a higher series BMW made them more attractive, more successful, and the most dazzling peacock in the zoo.

This is not an attribute specific to Americans, but a failing of all humans throughout history. Charles Mackay captured this human impulse in his 1841 book Extraordinary Popular Delusions and the Madness of Crowds:

“Men, it has been well said, think in herds; it will be seen that they go mad in herds, while they only recover their senses slowly, and one by one.”

The herd has been mad since 1970 and with the post economic collapse of 2008, some people are recovering their senses slowly, and one by one. The country was overrun by flocks of ostentatious peacocks displaying their plumage in an effort to impress their friends, families and work colleagues. What set the flaunting American peacocks apart was the fact they financed their splendid display of plumage with $0 down and 0% interest for seven years.  The lifestyles of the rich and famous miraculously became available to the poor and middle class through the availability of easy abundant credit provided by the friendly kind hearted Wall Street banks and their heroin dealers at the Federal Reserve.

The United States has experienced a four decade long “expenditure cascade”.  An expenditure cascade occurs when the rapid income growth of top earners fuels additional spending by the lower earner wannabes. The cascade begins among top earners, which encourages the middle class to spend more which, in turn, encourages the lower class to spend more. Ultimately, these expenditure cascades reduce the amount that each family saves, as there is less money available to save due to extra spending on frivolous discretionary items. Expenditure cascades are triggered by consumption. The consumption of the wealthy triggers increased spending in the class directly below them and the chain continues down to the bottom. This is a dangerous reaction for those at the bottom who have little disposable income originally and even less after they attempt to keep up with others spending habits.

This cascade of expenditures could not have occurred without cheap easy credit, supplied by Wall Street shysters and abetted by their puppets at the Federal Reserve through their inflationary policies. Real wages are lower today than they were in 1970. Coincidentally, the credit card began its ascendance as the peacock payment of choice in 1970. There are now over 600 million credit cards in circulation in the U.S. in the hands of 177 million fully plumed peacocks and peacock wannabes.

Monthly Payment Nation

“Consumerism re­quires the services of expert salesmen versed in all the arts (including the more insidious arts) of persuasion. Under a free enterprise system commercial propa­ganda by any and every means is absolutely indis­pensable. But the indispensable is not necessarily the desirable. What is demonstrably good in the sphere of economics may be far from good for men and women as voters or even as human beings.”  – Aldous Huxley


The country seemed to do just fine from 1945 through 1970 with no credit card debt and moderate levels of auto loan debt. In fact, this period in U.S. history was marked by strong economic growth created by capital investment, savings, and the American middle class realizing the American dream of a better life based upon their work ethic. Around about 1970, the intersection of Baby Boomers coming of age, the belief that social justice for all was a noble goal, and Nixon’s closing the gold window, opened Pandora’s Box and the evil released has brought the country to the precipice of ruin. Today, consumer credit outstanding totals $2.43 trillion, or $22,000 per household. It peaked at $2.6 trillion in 2008 and the storyline fed to the masses was that Americans had seen the light and embraced frugality by paying off their debts. As with most storylines spouted by the mainstream media, it was completely false. The Wall Street banks wrote off over $200 billion since 2008, while delusional peacocks continued to finance and lease gas guzzling luxury automobiles, while charging their purchase of an iPad2 and Lady Gaga concert tickets on one of their 13 credit cards.

It seems a vast swath of America refuse to shed their peacock feathers. This explains why you see BMWs, Mercedes, Escalades, and Porsches parked in the driveways of $100,000 houses. Automobiles are the truest representation of American peacock syndrome. Very few people look at a car purchase in a rational long term financial sense. It’s about impressing the neighbors, your peers and your family. Driving a brand new luxury car gives you the appearance of success. The neighbors don’t know you are in debt up to your eyeballs. This explains why 30% to 40% of all luxury cars are leased. A man could buy a $20,000 Honda hybrid with 10% down and finance the rest at 0.9% for three years. His monthly payment would be $500. After three years he would own the car outright, with the added benefit of getting 45 mpg. He could then invest the $500 per month for the next seven years in gold and silver or something else that benefits from Federal Reserve created inflation. In today’s society this would be the act of a doo doo bird.


Why drive a putt putt car when you can drive the ultimate peacock machine – a BMW 528i with 24-valve inline 240-horsepower 6-cylinder engine with composite magnesium/aluminum engine block, Valvetronic, and Double-VANOS steplessly variable valve timing, 10-way power-adjustable driver’s and front passenger’s seat with 4-way lumbar support, and memory system for driver’s seat, steering wheel and outside mirrors, along with high-fidelity 12-speaker sound system, including 2 subwoofers under the front seats, and digital 7-channel amplifier with 205 watts of power. Plus it looks really cool. This materialism machine can be leased for the same $500 per month that the doo doo bird pays for his Honda hybrid. Of course, after three years of renting luxury wheels the peacock has to turn in the 528i and lease an equally luxurious auto because driving an economy car would now harm his reputation. Colorful plumage is everything to a peacock.

Sometime over the years Americans lost their bearings and began to ignore a basic truth. The only way to accumulate wealth is to spend less than you make and save the difference. Over a ten year time frame the peacock will have dished out $60,000 renting luxury cars, while the doo doo bird will have expended $21,000 during the first three years and then invested $500 per month for 84 months, leaving him with a net $25,000 asset, based on a modest investment return of 5%. The doo doo bird ends up $85,000 wealthier than the peacock at the end of ten years. If you peruse the car dealer advertisements in your local paper, the price of the car is rarely even printed, only the monthly lease payment or 0% financing offer. There is a reason why the average American lives paycheck to paycheck, has no emergency fund for a rainy day, and has virtually no retirement savings socked away. Status, reputation and the appearance of success became more important to millions of Americans than living within their means and actually sacrificing and doing the hard work required to succeed. Delayed gratification is an unknown concept in America.

In 1970, 37% of households consisted of 4 or more people and we somehow managed to get by with one four door car per household. Today, only 24% of households consist of 4 or more people. There are 113 million households and over 250 million passenger vehicles, or 2.2 per household. So, even though the number of people in our households has shrunk dramatically, we needed 120% more vehicles to transport our vast quantities of stuff. Not only do we have more vehicles, but the size of these symbols of gluttony has doubled and tripled, with fitting names like: Tundra, Navigator, Titan, Yukon, Suburban and Hummer. Every soccer mom with two kids needed a 20 foot long, 6 foot high Yukon with an 8 cylinder engine, getting 12 mpg to shuttle around little Aiden and Chloe to their ten scheduled weekly activities. It wasn’t only automobiles that Americans went gaga over. The average home size in 1970 was 1,400 square feet (we drive cars bigger than that today). By 2009, the average home size reached 2,700 square feet. God knows we need 12 rooms for our 2.4 person households. The expenditure cascade started as a trickle in 1970 but became a raging uncontrollable waterfall by 2008.


Delusional Americans have been slowly lured into the web of debt and living their lives based upon whether they can make the monthly payment on their debt. I can anticipate the outrage from those who declare it wasn’t them, it was the other guy. Everyone has an excuse for why they aren’t to blame, but the facts speak otherwise:

  • Non-revolving (auto & education) debt outstanding is at an all-time high of $1.64 trillion.
  • The average auto loan is now $27,000 with a loan to value ratio of 80% to 90%, down from 95% in 2007.
  • Auto dealers are now offering $0 down and 0% interest for 72 months on many models. Ask yourself how a finance company can make a profit with those terms.
  • There are 54 million households with a revolving credit card balance, proving that approximately 50% of Americans are attempting to live above their means.
  • The average credit card debt per household with credit card debt is $14,687.
  • The average APR on a new credit card is 15%, even though the banks can borrow from the Federal Reserve for 0.25%.
  • In 2009, the United States Census Bureau determined there were nearly 1.5 billion credit cards in use in the U.S. A stack of all those credit cards would reach more than 70 miles into space — and be almost as tall as 13 Mount Everests.
  • 76% of undergraduates have credit cards, and the average undergrad has $2,200 in credit card debt. Additionally, they will amass almost $20,000 in student debt.
  • On average, today’s consumer has a total of 13 credit obligations on record at a credit bureau. These include credit cards (such as department store charge cards, gas cards, and bank cards) and installment loans (auto loans, mortgage loans, student loans, etc.).
  • Over 90 percent of African-American families earning between $10,000 and $24,999 had credit card debt. What bank in their right mind would issue a credit card to someone making $15,000 per year?
  • Discussing credit card debt is highly taboo. The topics at the top of the list of things that people say they are very or somewhat unlikely to talk openly about with someone they just met were: The amount of credit card debt (81%); details of your love life (81%); your salary (77%); the amount you pay for your monthly mortgage or rent (72%); your health problems (62%); your weight (50%). I wonder why?
  • Penalty fees from credit cards added up to about $20.5 billion in 2009, according to R. K. Hammer, a consultant to the credit card industry. Don’t be one day late with that credit card payment. It’s good to be a bank.
  • The average late fee was found to have risen to $28.19, way up from $25.90 in 2008. Consumer Action reported that late fees reached up to $39 per incident.
  • The volume of gasoline purchases placed on credit cards jumped 39% last month from a year earlier, compared with a 21% increase in June 2010. Food shopping increased 5% after falling 7% last year. The value of an average transaction on credit cards outpaced the gain for debit cards, showing consumers are increasingly relying on borrowing to pay for gasoline and other necessities.

After decades of a debt financed contest to display the gaudiest plumage, is the average American happier? Considering more than 10% of all Americans are on anti-depressant drugs, I’d say not. The rat race for status, the appearance of wealth and visible faux displays of success do not increase well-being. If most of our earnings are spent on an empty game of status, we should not expect much improvement in our quality of life. There is something perverse about having more than enough. When we have more, it is never enough. It is always somewhere out there, just out of reach. This is the attitude that drives the criminals on Wall Street and politicians in Washington DC to constantly seek more power and wealth. The more we acquire, the more elusive enough becomes. Much of the debt financed purchases of consumer trinkets, baubles and gadgets is nothing more than an expensive anesthetic to deaden the pain of empty lives.

Based upon the facts, the average American has not benefitted from the decades long materialistic frenzy. They have sacrificed their futures for the fleeting glory of ephemeral riches. In fact, the average American could not have participated in the expenditure cascade had they not been enabled by the financial industry and cheap plentiful money provided by the financial industries’ drug dealer – the Federal Reserve. The financial industry complex used their power and wealth to utilize all means of propaganda and mass media outlets to convince Americans that debt was good and more debt was even better. I’ll address the insidious aspects of the unholy union of debt and propaganda in Part Two – Propaganda Nation Built Upon Delusions of Debt.

Meanwhile, millions of Americans cling to their borrowed peacock feathers as the butcher of reality bears down upon them. The end won’t be pretty. The brave conquerors of strip malls across the land can enjoy their toys, gadgets, and treasures for awhile longer, but they need to remember one thing – Glory is fleeting and death can come suddenly.


“For over a thousand years Roman conquerors returning from the wars enjoyed the honor of triumph, a tumultuous parade. In the procession came trumpeteers, musicians and strange animals from conquered territories, together with carts laden with treasure and captured armaments. The conquerors rode in a triumphal chariot, the dazed prisoners walking in chains before him. Sometimes his children robed in white stood with him in the chariot or rode the trace horses. A slave stood behind the conqueror holding a golden crown and whispering in his ear a warning: that all glory is fleeting.”

Last scene from the movie Patton


LIES ACROSS AMERICA

“Every single empire, in its official discourse, has said that it is not like all the others, that its circumstances are special, that it has a mission to enlighten, civilize, bring order and democracy, and that it uses force only as a last resort.”Edward Said

The increasingly fragile American Empire has been built on a foundation of lies. Lies we tell ourselves and Big lies spread by our government. The shit is so deep you can stir it with a stick. As we enter another holiday season the mainstream corporate mass media will relegate you to the status of consumer. This is a disgusting term that dehumanizes all Americans. You are nothing but a blot to corporations and advertisers selling you electronic doohickeys that they convince you that you must have. Propaganda about consumer spending being essential to an economic recovery is spewed from 52 inch HDTVs across the land, 24 hours per day, by CNBC, Fox, CBS and the other corporate owned media that generate billions in profits from selling advertising to corporations schilling material goods to thoughtless American consumers.  Aldous Huxley had it figured out decades ago:

“Thanks to compulsory education and the rotary press, the propagandist has been able, for many years past, to convey his messages to virtually every adult in every civilized country.”

Americans were given the mental capacity to critically think. Sadly, a vast swath of Americans has chosen ignorance over knowledge. Make no mistake about it, ignorance is a choice. It doesn’t matter whether you are poor or rich. Books are available to everyone in this country. Sob stories about the disadvantaged poor having no access to education are nothing but liberal spin to keep the masses controlled. There are 122,500 libraries in this country. If you want to read a book, you can read a book. The internet puts knowledge at the fingertips of every citizen. Becoming educated requires hard work, sacrifice, curiosity, and a desire to learn. Aldous Huxley  describes the American choice to be ignorant:

 “Most ignorance is vincible ignorance. We don’t know because we don’t want to know.”

It is a choice to play Call of Duty on your PS3 rather than reading Shakespeare. It is a choice to stand on a street corner looking for trouble rather than reading Hemingway. It is a choice to spend Black Friday in malls fighting other robotic consumers for iSomethings, the latest innovative, advanced TVs, flashy Rolexes, and ostentatious Coach bags rather than spending the day reading Guns of August by Barbara Tuchman, a brilliant Pulitzer Prize winning history of the outset of World War I, which would provide insight into what could happen on the Korean Peninsula. It is a choice to watch 6 hours per day of Dancing With the Stars, American Idol, Brainless Housewives of Everywhere, or CSI of Anywhere rather than reading Orwell or Huxley  and discovering that their dystopian warnings have come true.

 Conspicuous Consumption Conquistadors

Americans have chosen to lie to themselves. They have persuaded themselves that buying stuff with plastic cards while paying 19% interest for eternity, driving BMWs while locked into never ending indecipherable lease schemes, and living in permanently underwater McMansions bought with 0% down on an interest only liar loan, is the new American Dream. They think watching the boob tube will make them smart. They soak in the mass media hype, misinformation and lies like lemmings walking off a cliff. Depending on their political predisposition, they watch Fox or MSNBC and unthinkingly believe the propaganda that pours from the mouths of the multi-millionaire talking heads who read Teleprompters with words written by corporate media hacks. They tell themselves that buying stuff on credit, giving them the appearance of success as measured by the media elite, is actually success. This is a bastardized, manipulated, delusional version of accomplishment. Americans have chosen to believe the lies because the truth is too hard to accept.

Becoming educated, thinking critically, working hard, saving money to buy what you need (as opposed to what you want), developing human relationships, and questioning the motivations of government, corporate and religious leaders is hard. It is easy to coast through school and never read a book for the rest of your life. It is easy to not think about the future, your retirement, or the future of unborn generations. It is easy to coast through life at a job (until you lose it) that is unchallenging, with no desire or motivation for advancement. It is easy to make your everyday troubles disappear by whipping out your piece of plastic and acquiring everything you desire today. If your brother-in-law buys a 7,000 sq ft, 7 bedroom, 4 bath, 3 car garage, monolith to decadence for his family of 3, thirty miles from civilization, with no money down and a no doc Option ARM providing the funds, why shouldn’t you get in on the fun. It’s easy. Why sit around the kitchen table and talk with your kids, when you can easily cruise the internet downloading free porn or recording every trivial detail of your shallow life on Facebook so others can waste their time reading about your life. It is easiest to believe your elected leaders, glorified mega-corporation CEOs, and millionaire pastors preaching the word of God for a “small” contribution to their mega-churches.

Americans love authority figures who act as if they have all the answers. It matters not that these egotistical monuments to folly and hubris (Bush, Obama, Paulson, Geithner, Greenspan, Bernanke) have committed the worst atrocities in the history of our Republic, leaving economic carnage and the slaughter of thousands in their wake. The most dangerous man on this earth is an Ivy League educated, arrogant ideologue who believes they are smarter than everyone else. When these men achieve power, they are capable of producing catastrophic consequences. Once they seize the reigns of authority these amoral psychopaths have no problem lying to the American public in order to achieve their objectives. They know that Americans love to be lied to, so the bigger the lie, the more likely it is to be believed.

The current lie proliferating across the land of the free financing and home of the debtor is that austerity has broken out across the land. The mainstream media and the government, aided by various “think tanks” and Federal Reserve propagandists insist that Americans have buckled down, reduced spending, increased savings, and have embraced austerity.

Austerity – Circa 1932

Austerity – Circa 2010

They now proclaim that it is time to spend again. It is the patriotic thing to do, just like defeating terrorists by buying an SUV with 0% down from GM was the patriotic thing to do after 9/11. Defeating terrorists by going further into debt was the brilliant idea of those Ivy League geniuses Bush & Greenspan. Let’s critically examine the facts to determine how austere Americans have become:

  • Consumer credit outstanding is $2.41 trillion, the same level reached in early 2007, and up from $1.5 trillion in 2000. This is a 60% increase in ten years. Personal income has risen from $8.4 trillion to $12.6 trillion over this same time frame, a 50% increase. Americans have substituted debt for income in order to keep up with the Joneses. The mass delusion lives.
  • The MSM declares that the reduction in overall consumer debt from its peak of $2.56 trillion in 2008 to $2.41 trillion today proves that consumers have been cutting back and paying off debt. This is another media lie. Non-revolving debt, which includes car loans, education loans, mobile home loans and boat loans sits at $1.6 trillion, an all-time high matched in 2008. Credit card debt has “plunged” from $957 billion to $814 billion, not because consumers paid down their balances. The mega Wall Street banks have written off $20 billion per quarter since early 2009, accounting for ALL of the reduction in credit card debt. Clueless consumers continue to charge at the same rate as the peak in 2008.
  • Average credit card debt per household with credit card debt: $15,788
  • There are 609.8 million bank credit cards held by U.S. consumers.
  • The U.S. credit card default rate is 13.01%
  • In 2006, the United States Census Bureau determined that there were nearly 1.5 billion credit cards in use in the U.S. A stack of all those credit cards would reach more than 70 miles into space — and be almost as tall as 13 Mount Everests.
  • Penalty fees from credit cards added up to about $20.5 billion in 2009.
  • The national average default rate as January 2010 stood at 27.88% and the mean default rate is 28.99%.
  • Total bankruptcy filings in 2009 reached 1.4 million, up from 1.09 million in 2008. Bankruptcies in 2010 are on pace to exceed 1.6 million.  
  • 26% of Americans, or more than 58 million adults, admit to not paying all of their bills on time. Among African-Americans, this number is at 51%.

           Does This Look Like Austerity? Really?

This data clearly proves that austerity has not broken out across the land of delusion. The billions in consumer loan write-offs by the Wall Street banks that run this country have masked the fact that Americans have not cut back on their spending habits at all. GMAC (taxpayer owned) and Ford Credit continue to dish out car loans to anyone with a pulse and a 600 credit score. The Federal Reserve and the FASB have encouraged, if not insisted, that banks fraudulently value the commercial real estate loans on their books. The Federal Reserve has bought $1.5 trillion of toxic mortgage loans from the criminal Wall Street banks at 100 cents on the dollar. The government’s corporate fascist public relations firms then spread the big lie that the economy is recovering and consumers should join the party and spend, spend, spend.

If Americans were capable or willing to do some critical thinking, they would realize that those in power have created the illusion of a recovery by handing $700 billion of your money to the banks that created the financial meltdown, spending $800 billion on worthless pork barrel projects borrowed from future generations, dropping interest rates to 0% so that the mega-Wall Street banks can earn billions risk free while your grandmother who depended on interest income from her CDs edges closer to eating cat food to get by, and lastly Ben Bernanke’s blatant attempt to enrich Wall Street by buying US Treasury bonds in an effort to make the stock market go up, while the middle and lower classes are crushed under the weight of soaring fuel and food price increases that exceed 30% on an annual basis. The illusion of recovery is not a recovery. With a true unemployment rate of 22%, a true inflation rate of 8% and a real GDP of -1.5% (Shadowstats), we are in the midst of the Greater Depression. You are being lied to, but most of you prefer it.

The Little Lies We Tell Ourselves

“Our ignorance is not so vast as our failure to use what we know.” – M King Hubbert

When Jimmy Carter gave his malaise speech in 1979, Americans were in no mood to listen. Carter’s solutions were too painful, required sacrifice, and sought to benefit future generations. The leading edge of the Baby Boom generation had reached their 30s by 1979, and the most spoiled, pampered, egocentric generation in history could care less about future generations, long term thinking, or sacrifice for the greater good. They were the ME GENERATION. The 1970s had proven to be tumultuous episode in US history. M King Hubbert’s calculation in 1956 that U.S. oil production would peak in the early 1970s proved to be 100% correct.

File:US Oil Production and Imports 1920 to 2005.png


The Arab oil embargo resulted in gas shortages and economic chaos in the U.S. Hubbert used the same method to determine that worldwide oil production would peak in the early 2000s. If long term planning had been initiated in the early 1980s, combining exploration of untapped reserves, greater utilization of natural gas, development of nuclear plants, more stringent fuel efficiency standards, increased taxes on gasoline, and more thoughtful development of housing communities, we would not now face a looming oil crisis within the next few years. Instead of dealing with reality, adapting our behavior and preparing for a more localized society, we put our blinders on, chose ignorance over reason and pushed the pedal to the medal by moving farther away from our jobs, building bigger energy intensive mansions, and insisting on driving tank-like SUVs, Hummers, and good ole boy pickups. Kevin Phillips in American Theocracy explained that hyper-consumerism, fear, and inability to use logic have left our suburban oasis lives in danger of implosion when the reality of peak cheap oil strikes:

Besides the innate thirst of SUVs, some of the last quarter century’s surge in U.S. oil consumption has come from Americans driving more – some twelve thousand miles per motorist per year, up almost one – third from 1980 – because they as a whole live farther from work. In consumption terms, exurbia is the physical result of the latest population redistribution enabled by car culture and the electorate that upholds it.

Family values are central – if by this we mean having families and accepting lengthy commutes to install them in reasonably safe and well churched places. In the 1970’s such households might have been fleeing school busing or central city crime; in the post – September 11 era, many sought distance from “godless” school systems or the random violence and terrorist attacks expected to occur in metropolitan areas.

We willingly believe the lies espoused by the badly informed pundits on CNBC and Fox   that if we just drill in Alaska and off our coasts, we’ll be fine. The ignorant peak cheap oil deniers insist there are billions of barrels of oil to be harvested from the Bakken Shale, even though there is absolutely no method of accessing this supply without expending more energy than we can access. Environmentalists lie about the dangers of nuclear power, while shamelessly promoting the ridiculous notion that solar, wind and ethanol can make a visible impact on our future energy needs. Ideologues on the right and left conveniently ignore the facts and the truth is lost in a blizzard of their lies. Here is an explanation so clear, even a CNBC “drill baby drill” dimwit could understand:

When oil production first began in the mid-nineteenth century, the largest oil fields recovered fifty barrels of oil for every barrel used in the extraction, transportation and refining. This ratio is often referred to as the Energy Return on Energy Investment (EROEI). Currently, between one and five barrels of oil are recovered for each barrel-equivalent of energy used in the recovery process. As the EROEI drops to one, or equivalently the Net Energy Gain falls to zero, the oil production is no longer a net energy source. This happens long before the resource is physically exhausted.

File:Hubbert peak oil plot.svg


After the briefest of lulls when oil reached $145 per barrel, Americans have resumed buying SUVs, pickup trucks, and gas guzzling muscle cars. They have chosen to ignore the imminence of peak cheap oil because driving a leased BMW makes your neighbors think you are a success, while driving a hybrid would make your neighbors think you are a liberal tree hugger. It boggles my mind that so many Americans are so shallow and shortsighted. According to Automotive News, at the start of 2008 leasing comprised 31.2% of luxury vehicle sales and 18.7% of non-luxury sales. This proves that hundreds of thousands of wannabes are driving leased BMWs and Mercedes to fill some void in their superficial lives.

I bought a Honda Insight Hybrid six months ago. It gets 44 mpg and will save me $1,500 per year in gasoline costs. I put 20% down and financed the remainder at 0.9% for three years. My payment is $450 per month. I will own it outright in 2 ½ years. I could have leased a 2010 BMW 328i with moonroof, bluetooth, power seats with driver seat memory, lumbar support, leather interior, iPod adapter, 17″ alloy wheels, heated seats, wood trim, 3.0 Liter 6 Cylinder engine with 230 horsepower for 3 years at $389 per month. At the end of 3 years I’d own nothing. In 2 ½ years I’ll be able to put $450 per month away for my kids’ college education and I’ll be saving more on fuel as gasoline approaches $5 per gallon. The self important egotistical BMW leaser pretending to be successful will need to hand over their sweet ride and move on to the next lease, never saving a dime for the future. I’m sure they’ll make a killing in the market or their McMansion will surely double in price, providing a fantastic retirement.

             Delusional                                   Practical


The delusion that cheap oil is a God given right of all Americans can be seen in the YTD data on vehicle sales. Pickups and SUVs account for 48.5% of all sales, while small fuel efficient cars account for only 16.5% of all sales. Americans will continue to lie to themselves until it is too late, again.

  Oct 2010 % Chg from
Oct’09
YTD 2010 % Chg from
YTD 2009
Cars 448,127 3.9 4,840,525 5.3
   Midsize 220,998 -0.2 2,407,457 9.9
   Small 142,983 9.7 1,616,840 -1.5
   Luxury 78,487 9.7 742,278 7.2
   Large 5,659 -31.9 73,950 -0.8
Light-duty trucks 502,038 23.5 4,730,196 16.7
   Pickup 147,207 16.9 1,334,133 13.9
   Cross-over 195,274 20.0 1,928,191 16.8
   Minivan 55,596 21.0 561,736 15.1
   Midsize SUV 51,494 86.6 443,922 37.9
   Large SUV 23,946 1.5 202,806 12.1
   Small SUV 14,861 53.6 146,000 -3.8
   Luxury SUV 13,660 22.1 113,408 26.2
Total SUV/Cross-over 299,235 27.4 2,834,327 18.3
Total SUV 103,961 44.3 906,136 21.7
Total Cross-over 195,274 20.0 1,928,191 16.8

Americans are so committed to their automobiles, hyper-consumerism, oversized McMansions, and suburban sprawl existence that they will never willingly prepare in advance for a future by scaling back, downsizing, or thinking. Our culture is built upon consumption, debt, cheap oil and illusion. Kevin Phillips in American Theocracy concludes that there are so many Americans tied to our unsustainable economic model that they will choose to lie to themselves and be lied to by their leaders rather than think and adapt:

A large number of voters work in or depend on the energy and automobile industries, and still more are invested in them, not just financially but emotionally and culturally. These secondary cadres included racing fans, hobbyists, collectors, and dedicated readers of automotive magazines, as well as the tens of millions of automobile commuters from suburbs and distant exurbs, plus the high number of drivers whose strong self-identification with vehicle types and models serve as thinly disguised political statements. In the United States more than elsewhere, a preference for conspicuous consumption over energy efficiency and conservation is a signal of a much deeper, central divide.

M King Hubbert was a geophysicist and a practical man. He observed data, made realistic assumptions, and came to logical conclusions. He didn’t deal in unrealistic hope and unwarranted optimism. He knew that our culture had become so dependent upon lies and an unsustainable growth model based on depleting oil and debt based “prosperity”. He knew decades ago that we were incapable of dealing with the truth:

“Our principal constraints are cultural. During the last two centuries we have known nothing but exponential growth and in parallel we have evolved what amounts to an exponential-growth culture, a culture so heavily dependent upon the continuance of exponential growth for its stability that it is incapable of reckoning with problems of non-growth.” M King Hubbert

Our country is at a crucial juncture. It is time for thinkers. It is time for realists. It is time to deal with facts. It is time to drive the ideologues off the stage. Are you tired of lying to yourselves? Are you tired of being lied to by the corporate fascists that run this country? It is time to wake up. Right wing and left wing ideologues will continue to spew lies and misinformation as they are power hungry and care not for the long-term survival of our nation or the unborn generations that depend upon the decisions we make today. It is time to see how we really are.

 “Most of one’s life is one prolonged effort to prevent oneself from thinking. People intoxicate themselves with work so they won’t see how they really are.” –   Aldous Huxley

IS AMERICA ON A BURNING PLATFORM? (Featured Article)

David Walker, the former Comptroller of the United States from 1998 until 2008, has been warning politicians, the media, and the American public for over a decade that we are off course and headed for disaster. In August 2007, before the financial system meltdown of 2008, Mr. Walker declared:

The US government is on a “burning platform” of unsustainable policies and practices with fiscal deficits, chronic healthcare underfunding, immigration and overseas military commitments threatening a crisis if action is not taken soon. There are striking similarities between America’s current situation and the factors that brought down Rome, including declining moral values and political civility at home, an over-confident and over-extended military in foreign lands and fiscal irresponsibility by the central government. The fiscal imbalance meant the US was on a path toward an explosion of debt. With the looming retirement of baby boomers, spiraling healthcare costs, plummeting savings rates and increasing reliance on foreign lenders, we face unprecedented fiscal risks. Current US policy on education, energy, the environment, immigration and Iraq also was on an unsustainable path. Our very prosperity is placing greater demands on our physical infrastructure. Billions of dollars will be needed to modernize everything from highways and airports to water and sewage systems.

Three years have passed since Mr. Walker sounded the alarm and issued his dire warning. The National Debt in August 2007 was $8.9 trillion. Today it stands at $13.6 trillion, a 53% increase in just over 3 years. It took 205 years as a country to accumulate $4.7 trillion of debt. We’ve added $4.7 trillion in the last 38 months. It doesn’t appear that anyone in government heeded Mr. Walker’s warnings.

The perpetually optimistic pundits that occupy the positions of influence on CNBC and the other MSM networks try to paint a rosy picture of the American state of affairs day after day. They urge citizens to spend money they don’t have. They are sure that extending unemployment benefits to 99 weeks will improve the unemployment situation. They declare that Cash for Clunkers and the Home Buyer Tax Credit were successful government programs. They are sure that invading countries in the Middle East will make America safer. Nobel Prize winners in economics declare that the government should undertake another $8 to $10 trillion of money printing because the first $5 trillion wasn’t enough.

The Federal Reserve is pulling out all the stops in attempting to invigorate the American economy. The stock market is surging. Everything is surging. The optimists are crowing that all is well. Deficits don’t matter. We can borrow our way to prosperity. Cutting taxes will not add $4 trillion to the National Debt if not paid for with spending cuts. All is well. So, the question remains. Was David Walker wrong? Are we actually on a perfectly sturdy solid platform? Or, are we on the Deepwater Horizon as it burns and crumbles into the sea? Let’s examine both storylines and decide which is true.

AMERICA ON A STURDY PLATFORM

  • The National Debt of $13.6 trillion is manageable because interest rates remain at historic low levels.
  • The addition of $1.6 trillion in debt per year is necessary because government must step in for the lack of spending in the private sector. This will jump start the economy. This is Keynesianism 101.
  • The debt to GDP ratio of 93% is not dangerous. Japan has a debt to GDP ratio of 200% and they are doing fine. This proves we have plenty of room to grow our debt.
  • The US dollar is the reserve currency for the entire world. We can systematically devalue the USD, which will reduce our foreign debt burden over time. The foreigners who leant us the money are on the hook and they have no way out.
  • A depreciating dollar will help our manufacturing industry by making American exports cheaper in foreign markets.
  • The $700 billion TARP plan saved the American financial system. The American taxpayer will end up making a profit in the long run from this program.
  • Cash for Clunkers was an astounding success. It increased demand for autos dramatically.
  • The Homebuyer Tax Credits resulted in a surge in home sales and stabilization of home prices.
  • The $800 billion Stimulus plan saved America from a 2nd Great Depression. Without it, we would have lost millions of jobs.
  • Consumer spending accounting for 70% of GDP is sustainable and desirable. If we can just get credit flowing again and encourage consumers that it is safe to use their credit cards to spend, the economy will come roaring back.
  • This is not the time to save. Nobel Prize winners in economics urge Americans to spend because of the Paradox of Thrift. It may be smart for one person to save more than they spend, but if everyone does it a consumer society will collapse. We can save later is the recommendation.
  • A QE2 of $8 to $10 trillion would surely increase the animal spirits of the dejected American people. The stock market would soar to 20,000 and everyone would feel rich. Spending would surge. All would be well again.
  • The Social Security Trust Fund is not broke. The money contributed by Americans over the decades is in a lockbox and the fund will be solvent for decades. A few tweaks and it will be solvent forever.
  • Medicare has been one of the best government programs ever conceived. It has sustained our senior citizens and delivered high quality care to all at a reasonable cost.
  • Baby Boomers are rational and realistic. The statistics that show they have not saved enough to sustain them in retirement is overblown. Social Security will suffice. If not, they’ll just work a little longer. No worries.
  • Obamacare will reduce healthcare costs, improve service, cover more people, and reduce the profits of insurance companies and drug companies.
  • We have the best educational system in the entire world. People from all over the world want to get into our best Universities. No Child Left Behind has been a huge success.
  • We are safer today than we were on September 11, 2001. We won the Iraq War and freed the Iraqis from the clutches of a madman. We are fighting them over there so we don’t have to fight them over here. The terrorists are in disarray and retreat.
  • The $1.1 trillion spent on the Middle East Wars, the trillions spent on the Dept of Homeland Security, and the expansion of government ability to protect its citizens through enhanced surveillance techniques and enhanced interrogation techniques on suspected terrorists has been beneficial to the safety and security of the American people.
  • A Defense budget of $900 billion per year is essential to our national security. We are surrounded by potential enemies.
  • It is a net positive for the US to allow illegal immigrants to stay in the country. Who else would we get to work in the fields picking lettuce and cutting our suburban lawns?
  • Gasoline is only $2.70 a gallon. We are awash in supplies of oil. Peak oil is a myth perpetuated by environmental nuts. We have centuries worth of oil in the Bakken Shale. If we would just open up Alaska to drilling, our troubles would be gone. Drill, Baby, Drill.
  • Our crumbling infrastructure is actually a fantastic opportunity. A 2nd Stimulus program to upgrade our infrastructure would create millions of high paying jobs.  

AMERICA ON A BURNING PLATFORM

  • The National Debt is $13.6 trillion today. Interest expense for fiscal 2010 totaled $414 billion. Based upon the current spending path and assuming that the Bush tax cuts are extended, the National Debt will exceed $20 trillion by 2015. A reasonable expectation of 5% interest rates would result in annual interest expense of $1 trillion. The entire budgeted outlays of the US government are $3.5 trillion today.
  • Deficits exceeding $1 trillion per year are baked into the cake for the next decade. Non-Defense discretionary spending totals only $700 billion. Defense spending totals $900 billion. The remaining $1.9 trillion is on automatic pilot for Social Security, Medicare, Medicaid, and other entitlement programs. Politicians declaring they will freeze discretionary spending are treating you like fools. It will solve nothing.
  • Debt as a percentage of GDP will exceed 125% of GDP by 2015. Rogoff & Reinhart in their book This Time is Different point out the dangers once debt surpasses 90% of GDP: The relationship between government debt and real GDP growth is weak for debt/GDP ratios below 90% of GDP. Above the threshold of 90%, median growth rates fall by 1%, and average growth falls considerably more. The chances of bad things happening to a country increase dramatically after the 90% level is surpassed.
  • Japan began their 20 years of tears with a debt to GDP ratio of 52% and a National Savings rate of 15%. The Japanese people bought 90% of the debt that the government issued. Today, the debt to GDP ratio is 200% and the National Savings rate is 2%. The US entered this crisis with a debt to GDP ratio of 80% and a National Savings rate of 1%. We depend on foreigners to buy more than 50% of our new debt. We do not control our own destiny.
  • A depreciating US dollar is already creating inflation in many assets. Gold, silver, oil, and agricultural commodities are increasing in price faster than the stock market. The policy of the US government and Federal Reserve of devaluing the currency is being matched by similar efforts in countries across the globe. The result is a flood of liquidity creating bubbles which will pop. The American middle class will be squeezed harder as their wages stagnate, while their food, energy, and costs at Wal-Mart go higher.
  • TARP, the purchase of $1.5 trillion of Mortgage Backed Securities by the Federal Reserve, 0% interest rates, and accounting rule changes by the FASB have done nothing but paper over the fact that the biggest financial institutions in the US are insolvent. The assets on their books are worth 50% less than they are reporting. They are zombie banks. Their losses on residential real estate, commercial real estate and consumer credit continue to grow. The only beneficiaries of keeping zombie banks alive are the bankers who are receiving billions in compensation while the middle class dies a slow painful death.
  • Cash For Clunkers, Home Buyer Tax Credit and energy efficiency credits did nothing but shift demand forward and cost the American taxpayer $25 billion. The estimated cost to the tax payer per incremental home sold was $100,000. Auto sales and home sales plunged as soon as the credits ran out. Home prices are falling and used car prices have soared due to less supply, hurting the poor.
  • The borrowing of $800 billion from the Chinese to dole out to unions and political hacks all over the country has been a complete disaster. Unemployment has gone up by over 4 million since the stimulus was passed. Government spending has crowded out private spending. The economy hasn’t recovered because it was never allowed to bottom. Why look for a job when the government pays you for two years to watch Oprah in a house where you haven’t made a mortgage payment in 18 months?
  • Consumers’ spending money they don’t have, saving less than 5% of their disposable income, and putting away nothing for their retirement is unsustainable. The average credit card debt per household is about $15,700. In 1968, consumers’ total credit debt was $8 billion (in current dollars). Now the total exceeds $880 billion. Americans currently owe $917 billion on revolving credit lines and $80 billion of it is past due, according to the latest Federal Reserve statistics.
  • A scaling back of consumer spending to a sustainable 64% of GDP would reduce consumer spending by $500 billion per year. This would allow Americans to save and invest in the country. This is considered crazy talk in the Keynesian economic circles.
  • The anticipation of QE2 has already made the dollar drop 10% and gold, silver and oil jump 10%. Ben Bernanke and the Federal Reserve are conducting an experiment on the American people. What they are doing today has never been attempted in human history. It boils down to whether the authorities can cure a disease brought on by too much debt by doubling and tripling the dosage of debt. If this experiment fails, the dollar collapse and possible hyperinflation would lead to anarchy. Ben is confident it might work. Are you?
  • Social Security and Medicare have an unfunded liability exceeding $100 trillion. There is no money in a lockbox. Congress opened the lockbox and spent the money. Baby boomers are turning 50 years old at a rate of 10,000 per day. There is no possibility that the promises made to Americans by politicians can be honored. No politician of either party will tell the truth to the American public. A massive reduction in benefits or a massive increase in taxes would be required to deliver on this promise.
  • The 2,000 page Obamacare bill that no one in Congress read was sold to the American people as a cost saving, care enhancing package of goodies. The reality is that it will increase the national debt by hundreds of billions, ration care, drive more doctors into retirement, strangle small business with onerous regulations and enrich the insurance companies and drug companies. The unintended consequences will be devastating.
  • Total military expenditures for the entire world are $1.9 trillion annually. The US accounts for $900 billion of this expenditure. This is 7 times as much as the next largest spender – China.
  • The wars of choice in the Middle East since 2001 have cost unborn generations of Americans $1.1 trillion so far, with a final cost likely reaching $3 trillion. Just like Donald Rumsfeld estimated.  Over 5,700 Americans have lost their lives and another 39,000 have been wounded. The casualties in the countries that have been invaded number in the hundreds of thousands. Are we better off than we were on September 10, 2001?
  • Defense spending in 2000 was $359 billion or 3.6% of GDP. Today it is $900 billion or 6.1% of GDP. Every dime of these expenditures is borrowed. Are we safer today?
  • The Department of Energy was created in 1979 in order to create an energy policy that would reduce our dependence on foreign oil. The United States, which makes up 4% of the world’s population, consumes 25% of the world’s oil on a daily basis. In 1970 we imported 24% of our oil. Today we import 70% of our oil.
  • Over 50% of our oil imports come from countries whose populations hate the US. Mexico, which accounts for 9% of our current oil supply, will become a net importer by 2015.
  • The US has not built a new nuclear power plant or oil refinery since 1980.
  • The existing energy infrastructure is rusting away. 80% to 90% of the system must be rebuilt. The cost of rebuilding the infrastructure will be $50 – $100 trillion. We have no blueprints, few supplies and fewer trained engineers and construction workers.
  • Peak oil is a fact. World liquid oil production peaked at 86 million barrels per day in 2006. It has not reached that level since, even when prices soared to $145 per barrel. Demand will move relentlessly upward as China and India and the rest of the developing world march forward.
  • The US Military has concluded in a report put out a few months ago that by 2012, surplus oil production capacity could entirely disappear, and as early as 2015, the shortfall in output could reach nearly 10 MBD. A severe energy crunch is inevitable without a massive expansion of production and refining capacity. While it is difficult to predict precisely what economic, political, and strategic effects such a shortfall might produce, it surely would reduce the prospects for growth in both the developing and developed worlds.

THE SHIP OF STATE

David Walker was in a ship well ahead of the US Titanic crossing the Atlantic. He saw the dangerous icebergs floating in the ocean. He sent a message to the Captains (Bush, Obama) and Executive Officers (Greenspan, Bernanke, Paulson, Geithner) of the US Titianic that there was danger ahead. They should have reduced speed and doubled the lookouts. Instead they listened to the Managing Director of the cruise line (Wall Street) and increased speed. The US Titanic was unsinkable. When the inevitable collision with the iceberg occurred, those in command chose to disbelieve the possibility that the mighty ship could sink. The nearest ship was four hours away. If the US Titanic had stopped immediately after striking the iceberg, it would have remained afloat until the rescue ship arrived. Instead, the masters of the ship chose to keep going as the compartments below the surface continued to fill with water. Reputation and hubris drove them to take these actions.

Those in command knew that there was only room on the lifeboats for 1,100 people. There were 2,200 people onboard. It is interesting to note that 60% of the First Class (the ruling elite) passengers survived the sinking, while less than 25% of the Third Class (working middle class) and crew survived.

David Walker has presented a case for inter-generational sacrifice. Are today’s generations willing to keep robbing future generations of Americans by being fiscally irresponsible today? Every borrowed dollar spent today is a tax on future generations. Are we selfish enough to leave our children and grandchildren with an un-payable burden so that we can live well today? Don’t the Wall Street bankers and Washington politicians have children and grandchildren? It is immoral and despicable that American leaders and its citizens aren’t willing or able to make the tough choices needed to save the ship of state. Every great empire withered away due to the accumulation of bad decisions. Ask yourself whether this country has made the right choices in the last 30 years. Are we making the right choices today? If you are honest, the answer is NO. We’ve hit the iceberg. The ending is unavoidable.

Sing us a song of the century
That’s louder than bombs and eternity
The era of static and contraband
That’s leading us into the promised land
Tell us a story that’s by candlelight
Waging a war and losing the fight

They’re playing the song of the century
of panic and promise and prosperity
Tell me a story into that goodnight

Sing us a song for me …

                            Green Day – Song of the Century

THE BASTARD CHILD OF THE MOTHER OF ALL BUBBLES

There is no doubt the home price bubble inflated by Easy Al Greenspan between 2000 and 2006 was the Mother of All Bubbles. Robert Shiller clearly showed that home prices were two standard deviations above expectations. Despite the unequivocal facts that Dr. Shiller put forth, millions of delusional unsuspecting dupes bought houses at the top of the market. These were the greater fools. They actually believed the drivel being spewed forth by the knuckleheaded anchors on CNBC. They actually believed the propaganda being preached by David Lereah from the National Association of Realtors (Always the Best Time to Buy) about home prices never dropping. They actually believed Bennie Bernanke when he said:

“We’ve never had a decline in house prices on a nationwide basis. So, what I think what is more likely is that house prices will slow, maybe stabilize, might slow consumption spending a bit. I don’t think it’s gonna drive the economy too far from its full employment path, though.” – 7/1/2005

“Housing markets are cooling a bit. Our expectation is that the decline in activity or the slowing in activity will be moderate, that house prices will probably continue to rise.” – 2/15/2006

Bennie actually made these statements when the chart below showed home prices at their absolute peak. You should keep this in mind whenever this rocket scientist opens his mouth about anything. And always remember that he is a self proclaimed “expert” on the Great Depression. That should come in handy in the next few years, just like his brilliant analysis of the strong housing market.

Source: Barry Ritholtz

Easy Al Greenspan created the Mother of All Bubbles by keeping interest rates at 1% for a prolonged period of time while encouraging everyone to take out adjustable rate mortgages. His unshakeable faith in the free market policing itself allowed Wall Street criminals, knaves and dirtbags to create fraudulent mortgage products which were then marketed to willing dupes and “retired” internet day traders. Al’s easy money policies and disinterest in enforcing existing banking regulations also birthed the ugly stepsister of the Mother of All Bubbles. Her name is the Consumer Debt Bubble. The chart below is hauntingly similar to the home price chart above. The consumer will be deleveraging for the next ten years. The numbskulls on CNBC and the other mainstream media have been falsely reporting for months that consumers were deleveraging when it was really just debt being written off by banks. Baby Boomers are not prepared for retirement and will be shifting dramatically from consuming to saving. As consumer expenditures decline from 70% of GDP back to 65% of GDP, consumer debt will resemble the home price chart to the downside.


The savings rate has soared all the way to 6% of personal income. This is up dramatically from the delusional boom years of 2004 and 2005 when it bottomed out at 1%. It ain’t even close to being enough to fund the looming retirements of the Baby Boomers. The savings rate averaged 10% from 1959 through 1989. In order for the American economy to revert to a balanced state where savings leads to investment which leads to wage increases, the savings rate will need to be 10% again. With annual personal income of $12.5 trillion, Americans will need to save an additional $500 billion per year. This means $500 billion less spending at the Mall, car dealerships, Home Depot, tanning salons, and strip joints. Don’t count on a consumer led recovery for a long long time.

Graph of Personal Saving Rate

So here we stand, two years after the worldwide financial system came within a few hours of imploding, and nothing has changed. Wall Street is still calling the shots. The political hacks that supposedly run this country have kneeled down before their insolvent Masters of the Universe. Bennie Bernanke has chosen to save his Wall Street masters and throw grandma under the bus. By keeping interest rates at zero, buying up trillions in toxic mortgages, and printing money as fast as his printing presses can operate, Bennie has birthed the bastard child of the mother of all bubbles. The chart below clearly shows the birth of this bastard. It is a distant cousin of the internet bubble bastard. Despite interest rates at or near all-time lows across the yield curve, money has poured into Treasury bonds. This makes no sense, as interest rates can’t go much lower. A small increase in rates will produce large losses for investors at these rates.

http://3.bp.blogspot.com/_1f6XU-Y3qQ0/THzvMnOOq7I/AAAAAAAAAGA/GaeGv5e4l14/s1600/inflows.bmp

Source: Barry Ritholtz

Only a fool would buy a US Ten Year Treasury bond today yielding 2.55%. Of course, only a fool would buy a 1,300 square foot rancher in Riverside, California for $800,000 with 0% down using an Option ARM in 2005 too. But that doesn’t mean there aren’t millions of fools willing to do so. Each “investment” will have the same result – huge losses. As anyone can see from the chart below, the 10 year Treasury has been in a 30 year bull market. At this point you have to ask yourself one question. Do you feel lucky? Well do you, punk? There are a number of analysts who see rates falling further as the economy sinks into Depression part 2. That may happen, but we all know that Bennie and those in power will do anything to avoid a deflationary spiral. That means looser money and more printing.

Chart forCBOE Interest Rate 10-Year T-No (^TNX)

The Federal Reserve does not want a 20 year recession like Japan. They will not get it. They’ll get a hyperinflationary collapse instead. Japan entered their 20 years of stagnation with a population that saved 18% of their income and huge trade surpluses. The Japanese government could count on the Japanese population to buy every bond they issued to pay for worthless stimulus projects. The US has entered this Depression with a population that saved 2% of their income and a trade deficit of $500 billion. John Hussman describes the differences between the US and Japan in his recent newsletter:

The impact of massive deficit spending should not be disregarded simply because Japan, with an enormously high savings rate, was able to pull off huge fiscal imbalances without an inflationary event. We may be following many of the same policies that led to stagnation in Japan, but one feature of Japan that we do not share is our savings rate. It is one thing to expand fiscal deficits in an economy with a very elevated private savings rate. In that event, the economy, though weak, has the ability to absorb the new issuance. It is another to expand fiscal deficits in an economy that does not save enough. Certainly, the past couple of years have seen a surge in the U.S. saving rate, which has absorbed new issuance of government liabilities without pressuring their value. But it is wrong to think that the ability to absorb these fiscal deficits is some sort of happy structural feature of the U.S. economy. It is not. It relies on a soaring savings rate, and without it, our heavy deficits will ultimately lead to inflationary events.

The bastard child of the mother of all bubbles likes to live dangerously. The morons in Congress will surely extend all of the Bush tax cuts without restraining spending in any way. That is what they call compromise in the hallowed halls of the Capitol. By 2020 the National Debt would be $30 Trillion under this scenario. Annual interest on the debt would exceed $2 trillion per year. This is a death spiral scenario, but it is the path we are choosing. Again, I ask you, who in their right mind would buy a 10 Year Treasury bond yielding 2.55% when the US will either have a $30 trillion National Debt or will have already collapsed under the weight of that debt?

Foreigners own approximately 30% of our outstanding debt. But, we have been relying on them to purchase almost 40% of our new issuance. We will need to issue $3 trillion of new debt in the next two years. Foreigners can add. They see that we are on a course that isn’t sustainable. They know that the Fed will attempt to monetize our debt and weaken the USD over time. At 2.5% interest rates, foreigners will accumulate massive losses as the USD depreciates. They will not accept these low rates for much longer. It is a confidence game. As they lose confidence in our ability to confront our debt issues, rates will be forced higher.

The pollyannas that seem to proliferate on CNBC and the rest of the mainstream media declare that since interest rates haven’t spiked and our hyper-debt based financial system is still functioning, then there is nothing wrong. They also didn’t see the internet collapse, housing collapse or financial system collapse coming. They never do and never will. China has actually been selling Treasuries for over a year. Japan is still buying, but their far worse debt/demographic crisis will force them to curtail purchases of Treasuries in the coming years. The purchases being made from the UK are really purchases from Middle Eastern countries with their oil money. I wonder what would happen to these purchases if war with Iran breaks out? It seems we have foreign countries increasingly reluctant to buy our debt when we are about to issue trillions of new debt in the next few years and as far as the eye can see.


The only thing that could possibly keep foreigners buying our debt would be higher interest rates. Our economy is so saturated with debt from top to bottom, that an increase in interest rates of only 2% would have a devastating impact on our economy. John Hussman understates the impact of deficits on our economic future:

Continued deficits will have substantial economic consequences once the savings rate fails to increase in an adequate amount to absorb the new issuance, and particularly if foreign central banks do not pick up the slack. We’re not there for now, but it’s important not to assume that the current period of stable and even deflationary price pressures is some sort of structural feature of the economy that will allow us to run deficits indefinitely.

The Krugmans of the world are not worried about our debt. They say pile it on. We are America. We are the most powerful nation in the history of the world. We can obliterate any enemy with the push of a button. Why do we need to worry about some debt? This is the hubris that has led to the downfall of every great Empire. As Rogoff and Reinhart point out in their recent book, this time is not different:

“As for financial markets, we have come full circle to the concept of financial fragility in economies with massive indebtedness. All too often, periods of heavy borrowing can take place in a bubble and last for a surprisingly long time. But highly leveraged economies, particularly those in which continual rollover of short-term debt is sustained only by confidence in relatively illiquid underlying assets, seldom survive forever, particularly if leverage continues to grow unchecked.

“This time may seem different, but all too often a deeper look shows it is not. Encouragingly, history does point to warning signs that policy makers can look at to assess risk – if only they do not become too drunk with their credit bubble – fueled success and say, as their predecessors have for centuries, “This time is different.”

A tipping point is reached when the government debt exceeds 90% of GDP. US government debt is currently at 93% of GDP. One year from now it will exceed 100% of GDP. The bastard child of the mother of all bubbles has jumped out a window on the hundredth floor of a NYC mega bank. As he passes the 50th floor, Paul Krugman asks him how is he doing? He says great, SO FAR. We all know what happens next. SPLAT!!!!

THE GREAT DELEVERAGING LIE

You can’t open a newspaper or watch a business news network without seeing or hearing that consumers and businesses have been de-leveraging. The storyline as portrayed by the mainstream media is that consumers and corporations have seen the light and are paying off debts and living within their means. Austerity has broken out across the land. Bloomberg peddled this line of bull last week:

US Household Debt Shrank 1.5% in the Second Quarter

American households pared their debts last quarter, closing credit card accounts and taking out fewer mortgages as unemployment persisted near a 26-year high, a survey by the Federal Reserve Bank of New York showed.Consumer indebtedness totaled $11.7 trillion at the end of June, a decline of 1.5 percent from the previous three months and down 6.5 percent from its peak in the third quarter of 2008, according to the New York Fed’s first quarterly report on household debt and credit.The report reinforces forecasts for a slowing economy in the second half of 2010 as consumers hold back on spending and rebuild savings.

One has to wonder whether the mainstream media and the clueless pundits on CNBC actually believe the crap they are peddling or whether this is a concerted effort to convince the masses that they have done enough and should start spending. Consumer spending as a percentage of GDP is still above 70%. This is well above the 64% level that was consistent between 1950 and 1980. Consumer spending was entirely propped up by an ever increasing level of debt. The American economy will never recover until consumer spending drops back to the 64% range that indicates a balanced economic system. For the mathematically challenged on CNBC and in the White House, this means that consumers need to reduce their spending by an additional $850 billion PER YEAR. Great news for the 1.5 million retailers in America.

Below is a chart that shows total credit market debt as a % of GDP. This chart captures all of the debt in the United States carried by households, corporations, and the government. The data can be found here:

http://www.federalreserve.gov/releases/z1/current/accessible/l1.htm

Total credit market debt peaked at $52.9 trillion in the 1st quarter of 2009. It is currently at $52.1 trillion. The GREAT DE-LEVERAGING of the United States has chopped our total debt by 1.5%. Move along. No more to see here. Time to go to the mall. Can anyone in their right mind look at this chart and think this financial crisis is over?

During the Great Depression of the 1930’s Total Credit Market Debt as a % of GDP peaked at 260% of GDP. As of today, it stands at 360% of GDP. The Federal Government is adding $4 billion per day to the National Debt. GDP is stagnant and will likely not grow for the next year. The storyline about corporate America being flush with cash is another lie. Corporations have ADDED $482 billion of debt since 2007. Corporate America has the largest amount of debt on their books in history at $7.2 trillion.

Now we get to the Big Lie about frugal consumers paying off debts, cutting up those credit cards, and eating Raman noodles 5 nights per week. Household and non-profit debt, which includes mortgages, credit card debt, auto loans, home equity loans, and student loans peaked at $13.8 trillion in 2008. After two years of supposed deleveraging, frugality and mass austerity, the balance is $13.5 trillion. Consumers have buckled down and have paid off 2.2% of their debts, it seems. Not exactly going cold turkey, but it is a start.

But wait. Consumer debt outstanding is $300 billion lower. If you hadn’t noticed, the banks in the United States have been taking a few losses on their loans over the last couple years. A simple search of the Federal Reserve website reveals that banks have charged off 5.66% of all their loans in the last two years. The charge off rate in the 2nd quarter of 2010 was 6.66%. To verify for yourself go to the Federal Reserve website:

http://www.federalreserve.gov/releases/chargeoff/chgallsa.htm

So, let’s get down to the nitty gritty. If consumer debt was $13.8 trillion at the end of 2008 and the banks have since written off 5.66% of that debt, total write-offs were $800 billion. If total consumer debt now sits at $13.5 trillion, then consumers have actually taken on $500 billion of additional debt since the end of 2008. The consumer hasn’t cut back at all. They are still spending and borrowing. It is beyond my comprehension that no one on CNBC or in the other mainstream media can do simple math to figure out that the deleveraging story is just a Big Lie.

The truth is that the debt has simply been shifted from criminal Wall Street Banks to the American taxpayer. These consumer debts were created in a private transaction between individuals and these banks. When the loans went bad, the consumer should have lost their home, car, etc., and their credit rating should have been ruined, keeping them out of the credit market for a number of years. If the banks that made these bad loans made too many, they should have failed and had their assets liquidated in bankruptcy. Instead, the Federal Government has inserted the American taxpayer into the equation by using our tax dollars to prop up insolvent Wall Street banks and allowing screw-ups who took on too much debt to live in houses for over two years without making a mortgage payment.

The Big Lie will eventually lose out to the grim truth. America’s economy is built on a debt based foundation of sand and the tide of reality is relentlessly eating away at that foundation of debt. Collapse is just a matter of time. The charts below from the Federal Reserve paint a grim picture of reality.

Total Debt Balance and its Composition

Total Balance by Delinquency Status

New Seriously Delinquent Balances by Loan Type