

I’ve retrieved all of The New York Times‘ 2020 presidential datasets, which have a time-series of voting data from a company called Edison Research. Here, for instance, is Pennsylvania‘s.
What I found is pretty fascinating, especially in Pennsylvania.
An just one example, here is a graph depicting the shifts in votes starting on election day. The X-axis represents the change in votes (positive values represent shifts for Trump, negative values represent shifts for Biden.
May I call your attention to the differences between the left and the right sides of the graph?
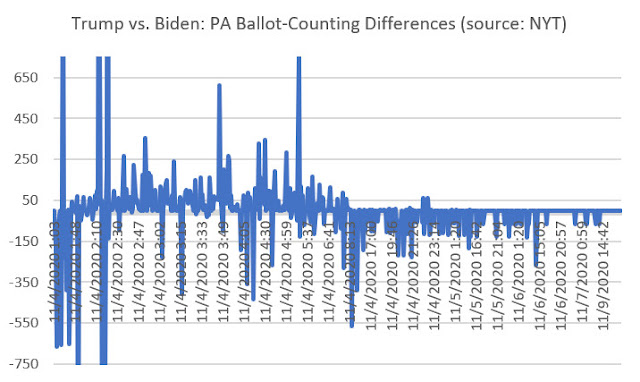
Please note that after about 23:00 hours on 11/4/20 Zulu, that virtually all vote swings went for Biden.
But you need to see the data. Below is a spreadsheet with the running vote counts.
Trump’s vote count is in column C, Biden’s vote count is in column D. The change in Trump’s vote total from the prior count is in column E and Biden’s is in column F. Lastly, column G shows the difference in vote swings between columns E and F.
Do me a favor and scroll down until you start seeing the highlighted cells. Then scroll all the way down and tell me if that looks legit.
You’ll notice that after the 11/4/20 23:00Z cutoff time, only swings of Biden votes (in multiples of 6,000 at a time) seem to have been received.
Statistically, these changes make no sense. They’re not just improbable, they appear to be impossible.
I’ll have more info from other states — that show similar bizarre trends — shortly.
In the mean time, your thoughts are appreciated.


INNUMERATE
in·nu·mer·ate
/iˈn(y)o͞omərət/
adjective
without a basic knowledge of mathematics and arithmetic.
noun
a person lacking basic knowledge of mathematics and arithmetic.
The American public is totally innumerate. They cannot add 2+2 and get 4 every time. Their eyes go foggy when numbers or statistics are even mentioned.
The media is well aware of this and will disappear this story with no effort at all required.
1) would the Supreme Court invalidate a state’s election results because of statistical anomalies? No.
2) Would the Supreme Court mandate a manual recount – and establish recount protocols because of provable statistical anomalies? Maybe. Slight chance.
Slight being the operative word.
It’s looking like there is more than enough evidence piling in to allow cogent arguments to made that will sway justices. Failing that the several state legislatures which are all Republican may be chomping at the bit to take vengeance on their blue shitholes and blue shitbag politicians.
Trump does not even need courts necessarily to win via legislatures and Congress.
Those legislatures are all about 55-45 GOP. So if 11% of the Republicans puss out, that won’t work. And about 75% of Republican politicians seem to be pussies. If the tables were turned and Dems narrowly held the legislative bodies, not a one of them would break ranks.
https://www.theepochtimes.com/trump-lawyer-sidney-powell-were-getting-ready-to-overturn-election-results-in-multiple-states_3579599.html
Polls cannot be run by either party. This just invites corruption and theft.
We need a special investigator to find out what really happened. I hear Mueller is available.
The following “timeseries” JSON fragment was copy/pasted from https://static01.nyt.com/elections-assets/2020/data/api/2020-11-03/race-page/pennsylvania/president.json (with “Raw Data” and “Pretty Print” selected) and corresponds to the above 2020 PA Pres. Analysis; Sheet 1 rows beginning with TrumpDelta transition from 4006 to -42325 and associated BidenDelta transition from 1062 to -196432.
` {
“vote_shares”: {
“bidenj”: 0.641,
“trumpd”: 0.351
},
“votes”: 1111586,
“eevp”: 16,
“eevp_source”: “edison”,
“timestamp”: “2020-11-04T02:13:11Z”
},
{
“vote_shares”: {
“bidenj”: 0.592,
“trumpd”: 0.399
},
“votes”: 871782,
“eevp”: 16,
“eevp_source”: “edison”,
“timestamp”: “2020-11-04T02:14:32Z”
},
{
“vote_shares”: {
“bidenj”: 0.59,
“trumpd”: 0.402
},
“votes”: 877724,
“eevp”: 16,
“eevp_source”: “edison”,
“timestamp”: “2020-11-04T02:14:56Z”
},
{
“vote_shares”: {
“bidenj”: 0.586,
“trumpd”: 0.406
},
“votes”: 888907,
“eevp”: 16,
“eevp_source”: “edison”,
“timestamp”: “2020-11-04T02:16:43Z”
},
{
“vote_shares”: {
“bidenj”: 0.689,
“trumpd”: 0.301
},
“votes”: 774021,
“eevp”: 16,
“eevp_source”: “edison”,
“timestamp”: “2020-11-04T02:17:03Z”
},
{
“vote_shares”: {
“bidenj”: 0.685,
“trumpd”: 0.306
},
“votes”: 781428,
“eevp”: 16,
“eevp_source”: “edison”,
“timestamp”: “2020-11-04T02:17:32Z”
},
{
“vote_shares”: {
“bidenj”: 0.677,
“trumpd”: 0.299
},
“votes”: 1288475,
“eevp”: 18,
“eevp_source”: “edison”,
“timestamp”: “2020-11-04T02:18:59Z”
},
{
“vote_shares”: {
“bidenj”: 0.677,
“trumpd”: 0.299
},
“votes”: 1288604,
“eevp”: 18,
“eevp_source”: “edison”,
“timestamp”: “2020-11-04T02:19:33Z”
},
{
“vote_shares”: {
“bidenj”: 0.664,
“trumpd”: 0.312
},
“votes”: 1325632,
“eevp”: 19,
“eevp_source”: “edison”,
“timestamp”: “2020-11-04T02:21:59Z”
},
{
“vote_shares”: {
“bidenj”: 0.627,
“trumpd”: 0.363
},
“votes”: 739443,
“eevp”: 19,
“eevp_source”: “edison”,
“timestamp”: “2020-11-04T02:22:45Z”
},
Why are vote totals not monotonically increasing with time? Are vote counting “device” clocks not synchronized? Does this raw data provide confidence in the vote tabulation process? Any live feed using this raw data would certainly present anomalous voting results.