16 YEARS AND THIS IS ALL I GOT?

You won’t hear these facts on CNBC. They wouldn’t dare discuss anything in inflation adjusted terms. The Dow is up a measly 7.3% over the last 16 years on an inflation adjusted basis. That’s the good news. In reality, we all know the CPI is understated by at least 3% to 5%. So, in reality, the Dow is significantly negative over the last 16 years. Using a true level of inflation would show the Dow not much higher than it was in 1966 at the onset of the welfare/warfare state and before the unlinking of our fiat currency from gold.

If you were a connected insider or friend of the Fed (aka Wall Street bankers) you’ve done quite well since March 2009. But, it seems that once the QE spigot was turned off in October 2014, the Dow has gone nowhere fast. This faux bull market is dying of old age and lack of Fed injected fiat. It’s a long way down to long term support.


Chart of the Day

The Dow is currently trading 4% below its May 19th all-time record high. For some perspective, today’s chart illustrates the inflation-adjusted Dow since 1900 — there are several points of interest. Take for example an unlucky buy-and-hold investor that invested in the Dow right at the dot-com peak of December 1999. A decade and a half later, the inflation-adjusted Dow is up a mere 7.3%. That is not altogether an impressive performance considering that over 16 years have passed. On the other hand, take the investor who bought right at the end of the financial crisis. The inflation-adjusted Dow is up a significant 119% from its financial crisis lows — not bad for a for a seven year investment. More recently, the inflation-adjusted Dow has broken below support of a trend that has existed since the end of the financial crisis induced bear market.


Selling The Blips

investingworld-stock-prices

If anyone has not noticed, the market has changed from rewarding buying the dips to rewarding selling the blips.

Selling the blips is how smart money leaves markets. Smart money is also big money. There is too much of it to fit through the exit door at the same time. That is why market crashes rarely occur in a day (August of 1987 was an exception) or even short periods like a month. Even the Great Depression took multiple years for the stock market to reach its ultimate bottom.

Why Wall Street Is Always Positive Regarding Markets

Maintaining positive market psychology is always pushed by Wall Street. In good times optimism drives markets where the big money wants them to go — up. In bad times, Wall Street may or may not recognize what is happening but it pays for them to be bullish nevertheless. Optimism tends to keep naive investors in markets which cushions the declines. This optimism also produces upward blips which are used by the smart money to exit with much of their profit intact.

Market Declines

Markets rarely go straight up or straight down. To rise markets need liquidity or additional funds. Quantitative easing provided this need quite nicely. Its sustained use provided the market advance seen in the chart below. Supplementing the liquidity infusion was the financial repression policy employed by the Federal Reserve. While they were flooding the system they were also driving interest rates to near zero, forcing monies into equities because it became the only game in town.

The chart below is SPY, an ETF that mirrors the performance of the S&P 500 index. Each bar represents monthly data. SPY bottomed in April of 2009 at around 67. This drop was from about 157 reached in November of 2007. It took about a year and a half for this decline of about 55% to play out.

Continue reading “Selling The Blips”

Why The Bear Of 2015 Is Different From The Bear Of 2008

Submitted by Charles Hugh-Smith of OfTwoMinds blog,

Are there any conditions now that are actually better than those of 2008?

It’s tempting to see similarities in last week’s global stock market mini-crash and the monumental meltdown that almost took down the Global Financial System in 2008-2009. The dizzying drop invites comparison to the last Bear Market that took the S&P 500 from 1,565 in October 2007 to 667 on March 9, 2009.

But this Bear is beginning in circumstances quite different from 2007-08. Let’s list a few of the differences:

1. Then: Markets and central banks feared inflation, as WTIC oil had hit $133 per barrel in the summer of 2008.

Now: As oil tests the $40/barrel level, markets and central banks fear deflation.

2. Then: China had a relatively modest $7 trillion in total debt, considerably less than 100% of GDP.

now: China’s debt has quadrupled from $7 trillion in 2007 to $28 trillion as of mid-2014, an astonishing 282% of gross domestic product (GDP)

3. Then: Central banks had a full toolbox of unprecedented monetary surprises to unleash on the market: TARP, TARF, BARF (OK, that one is made up) rescue packages and credit guarantees, quantitative easing (QE), zero interest rate policy (ZIRP) and direct purchases of mortgages, to name just the top few.

Continue reading “Why The Bear Of 2015 Is Different From The Bear Of 2008”

CHINA STOCKS DOWN 30% IN THREE WEEKS

The Chinese stock market bubble is imploding. And guess what? Nothing in particular started the plunge. Chinese central bankers have been easing, and it is still collapsing. Chinese politicians are promising new stimulative financial policies, and it is still collapsing. The ignorant Chinese masses who piled into the market in the last six months are roadkill.

The Fed reduced interest rates from 2007 through 2009 and the US stock market still fell 55%. If you think the Fed is all powerful and can stop a stock market collapse, you are badly mistaken. Markets are driven by fear and greed. Greed has been winning for the last six years. It was winning big time in China until three weeks ago. The Chinese stock market was up 60% in six months and the Wall Street investing geniuses paraded on CNBC were telling you to get into Chinese stocks before it was too late. As usual, their advice was worse than worthless.

When the selling begins in the US, with the level of margin debt, the fear will spread rapidly. A 30% drop in the Dow over three weeks would be about 5,500 points. Watching the Wall Street lemmings play follow the leader will be entertaining.

http://market-ticker.org/akcs-www?get_gallerynr=5180

The blood, gore, and cries for relief from the taxpayers will be epic. Bring some popcorn.


HOPE SPRINGS ETERNAL FOR FOOLS

Bear markets become bear markets because people don’t believe they are in a bear market until it is too late. The fast and furious low volume surge last week has the fools cackling and saying “see I told you so”. As Hussman notes, we’ve been here before:

“The Market Climate remains on a Crash Warning… but we have to allow for the possibility of the usual fast, furious bear market rallies that can occur after the market becomes oversold. In short, near term direction is a coin toss, but the next few days could involve a sizeable move one way or another. Overall, our position remains defensive, but we’re managing our risks in a way that accommodates the possibility of a bounce. It’s unfortunate, in my view, that investors have so much faith that a monetary easing can and will bail out the economy and the stock market. My view is fairly simple – the economic boom we’ve enjoyed has been driven by an inordinate amount of leverage, much of it of very poor credit quality, and by capital spending financed through the import of foreign savings. In an environment where demand for new capital investment was strong, easy bank credit and ample foreign savings fed extremely good economic growth rates. But I believe we are past that point here.”

Hussman Weekly Market Comment (link) December 19, 2000

“The market weakness we’ve observed since last year has been fairly tame in the sense that the S&P 500 has to-date suffered a fraction of the loss that we typically observe in a standard, run-of-the-mill bear. It can be dangerous to attempt trading bear market rallies early into a decline – especially when valuations remain rich. It’s useful to remember that the 1929 and 1987 crashes started after the S&P 500 was already down about 14% from its highs. So emerging panic is not enough – there has to be some basis to believe that a positive shift in investor attitudes toward risk would be sustainable. Again, falling interest rates, moderate valuations, and very strong market action early into the rebound are useful in separating sustainable advances (even sustainable bear-market rallies) from the fast, furious, prone-to-failure variety. Presently, we don’t even see emerging panic. What we do observe, however, is that prices are somewhat oversold on a very short-term basis, so it’s reasonable to allow for one of those fast, furious bounces to clear that condition. Not a forecast – particularly because the prevailing Market Climate is unfavorable – but even high-risk markets can produce very strong short-term advances, and investors should not immediately abandon caution when they emerge.”

Hussman Weekly Market Comment (link) June 23, 2008

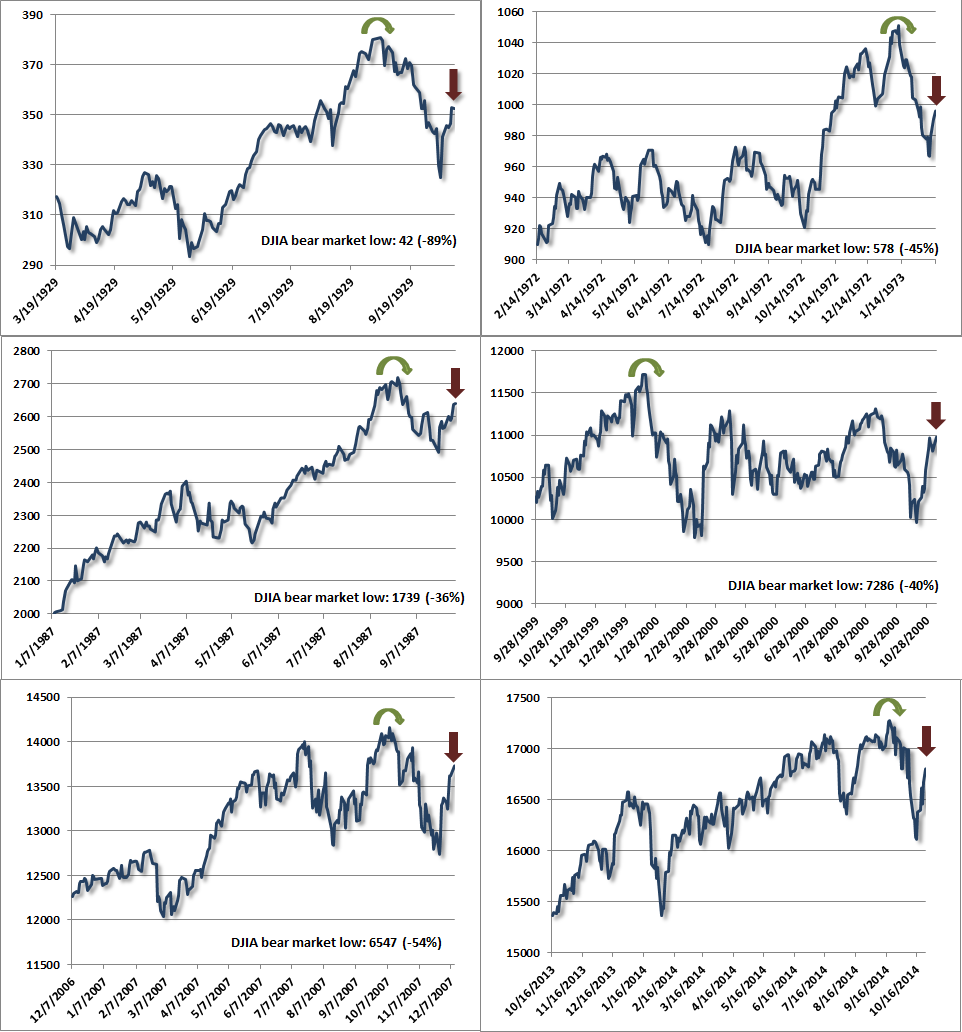
The global economy has turned south. Interest rates are falling sharply, a prelude to recession. The consumer is “debt” in the water. As you can see from these pertinent charts, every major bear market has had dramatic advances that fooled people into believing all was well. Note the similarity. Note the future lows after these dramatic advances.

What characterizes the instances below is not simply a decline from a market peak and a subsequent rally, but the sequence from historically extreme overvalued, overbought, overbullish conditions (see Exit Strategy) to a deterioration in market internals, an initial “air pocket” decline, and a subsequent short-squeeze that fails to restore market internals to a favorable condition.

The fact is the market is extremely overvalued due to the easy money policies of the Federal Reserve. QE is over this week. The economy is deteriorating. Europe is imploding again, led by Germany. China’s real estate bubble is in full collapse mode. Winter is coming. It might even snow. Imagine the devastation to our economy. Based upon historical facts Hussman’s warning has never been more valid:

So allow for any sort of action in the near term, but recognize that from a full-cycle perspective, we continue to view a 40-50% market loss as having very reasonable plausibility over the completion of this market cycle.

Click Here to read Hussman’s Full Letter


NOT THERE YET

So close, yet so far. Even though the pundits crow about new all-time highs, we aren’t there yet on an inflation adjusted basis. Let alone, using true inflation numbers. The powers that be count on the ignorant masses to not realize inflation has ravaged their returns and their daily expenses. Until the S&P 500 breaks out decisively above 2,000, we are still in a secular bear market. We should make t-shirts that say:

All That Money Printing and All I Got Was This Stupid T-shirt


THIS BEAR MARKET IS JUST STARTING TO ROAR

Nice factual reasoned analysis from Comstock Partners on why this bear market has a long way to go. People tend to focus on the day to day fluctuations of the market rather than stepping back and looking at the big picture. The world runs in long term cycles. The stock market also operates in long term cycles going from undervaluation to overvaluation and back. The markets experience alternating secular bull and bear markets that generally last for 15 to 20 years at a time. Investors get fooled by the cyclical bear and bull markets that las one or two years within a secular trend.

We had a secular bear market that lasted from 1966 to 1982. We then had a secular bull market that lasted from 1982 to 2000. We are now 11 years into a secular bear market, with stock prices lower than they were in 1998. We have at least five years left. Valuations are still extremely high. We have just completed a cyclical bull market from the March 2009 lows. The artificial stimulus is wearing off and the economy is headed into the tank. Corporate profits will crash and the stock market will drop at least 30% from here.

Ignore CNBC and concentate on valuations and the long term cycles. 


Bear Market Far From Over

What is currently happening in the market and the economy was predictable and is following the sequence we have long expected.  Households accumulated enormous debts in the past decade, leading to the credit crisis and recession of 2007-2009.  The government stepped in with massive monetary ease and fiscal expansion that produced only a weak recovery and a vast increase in government debt.  The market erroneously assumed that the recovery would follow the pattern of typical post-war expansions and rallied strongly from the early 2009 bottom to the recent highs. 

A similar pattern developed in Europe where sovereign debt of the weaker EU members has become a serious problem that EU leaders have been unable to solve.  Now we are undergoing the aftershocks of the crisis.

As we have repeatedly stated, crisis recoveries are characterized by short sub-par recoveries and numerous recessions as household debt burdens dampen consumer spending for long periods.   We did see the short sub-par recovery and now it seems to be ending at a time when the Fed has already used its best weapons and fiscal policy is due to become more restrictive.  First half GDP was revised down sharply.  Housing has continued to weaken.  Consumer spending has been sluggish.  Initial jobless claims for the latest period jumped back over 400,000.  The ECRI leading index has declined to 127.9 from its April peak of 131.1.

Even more shocking was the plunge in the August Philly Fed Index to minus 30.7 from 3.2 in July.  The drop was the weakest since October 2008.  In addition, the August University of Michigan Consumer Confidence Index dropped to 54.9, lower than any level during the recession and the lowest in 31 years.  These are the types of readings seen only in recessions.  Although the Fed only recently lowered its economic outlook for the second half of this year and 2012 these projections already seem outdated.  Today the New York Fed lowered its outlook while numerous brokerage firms and banks have belatedly been scrambling to cut their forecasts as well.

If anything the situation looks even worse in Europe.  Germany reported second quarter GDP growth of 0.1% and growth in France was zero.  Moreover European banks with exposure to PIIGS debt have been turning to the ECB for emergency loans.  Today the ECB reported that one bank (not named) has borrowed 500 million Euros a day for seven days. 

The remaining areas of the world cannot stop global GDP growth from shrinking.  Japan is in a recession.  China is still tightening to dampen inflation.  China as well as the other emerging nations are export-driven economies that depend heavily on American and European consumers. 

We, therefore, believe that the market has now entered a major downtrend.  It is a mistake to dismiss the slide we’ve seen to date as mindless and devoid of fundamentals as many strategists maintain.  These are not just scary headlines—-they are scary fundamentals.  As usual, there will undoubtedly be some more sharp rallies that will be interpreted as new bull markets.  In our view, however, the bear market has only begun, and has a long way to go.