It’s funny how the truth sometimes leaks out from the government. I’m guessing that Mr. Ted Berg will not be working for the Office of Financial Research much longer. This new agency was created by the Dodd Frank Law and is supposed to protect consumers from the evil Wall Street banks. But we all know the evil Wall Street banks wrote the bill, have gutted the major provisions, have captured all the regulatory agencies, own the Federal Reserve, and control all the politicians in Washington D.C. So, when an honest government analyst writes an honest truthful report that unequivocally proves the stock market is grossly overvalued and headed for a crash, the Wall Street banking cabal will surely call the top government apparatchiks to voice their displeasure. Truth is treason in an empire of lies.
The soon to be fired Mr. Berg’s verbiage is subtle, but pretty clear.
Option-implied volatility is quite low today, but markets can change rapidly and unpredictably, a phenomenon described here as “quicksilver markets.” The volatility spikes in late 2014 and early 2015 may foreshadow more turbulent times ahead. Although no one can predict the timing of market shocks, we can identify periods when asset prices appear abnormally high, and we can address the potential implications for financial stability.
Markets can change rapidly and unpredictably. When these changes occur they are sharpest and most damaging when asset valuations are at extreme highs. High valuations have important implications for expected investment returns and, potentially, for financial stability.
However, quicksilver markets can turn from tranquil to turbulent in short order. It is worth noting that in 2006 volatility was low and companies were generating record profit margins, until the business cycle came to an abrupt halt due to events that many people had not anticipated.
The full report can be found here:
http://financialresearch.gov/briefs/files/OFRbr-2015-02-quicksilver-markets.pdf
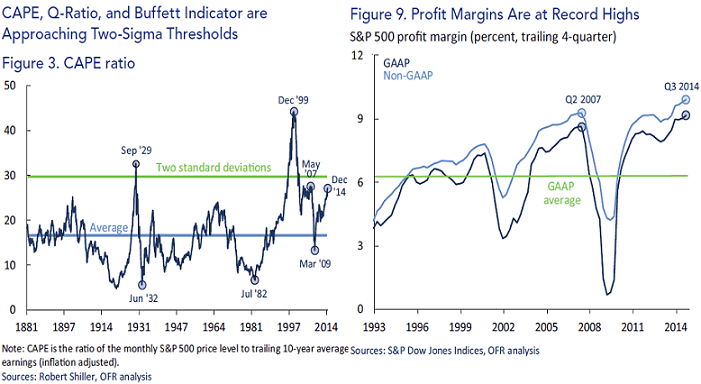
The meat of the report is in the charts. The CAPE Ratio, which has been a highly accurate predictor of market tops is now almost two standard deviations above the long term average and at the same level it was before the 2008 crash. It has only been higher in 1929 and 1999. That should give you a nice warm feeling about the coming bull market. Right?
Profit margins are at all-time record highs as corporations don’t have to pay higher wages, can borrow for virtually free, and continue to outsource to foreign countries. Profit margins are 60% above the long-term average and always revert to the mean. Do you expect them to expand or contract from here?
Continue reading “DANGER WILL ROBINSON”