The Crash Party

Authored by Sven Henrich via NorthmanTrader.com,

Since 1900 markets have had their fair share of crashes. Mind you crashes don’t happen that often, in fact crashes are very rare. You know what’s also very rare? A particular party being in power preceding crashes. Every single time, making them the crash party.

Oh don’t start hating on me. This is not a political post, but I know how tribal politics are these days and you say one thing about anyone or party you get hammered. For the record: I’m not a Republican and I’m not a Democrat. Tribalism, parties, clubs, it’s just not in my DNA. I’m an independent or outsider or whatever label fits.

Continue reading “The Crash Party”

Like Hoover and Dubya, will Trump eat his words about the economy?

Guest Post by Paul Brandus

“The fundamental business of the country, that is the production and distribution of commodities, is on a sound and prosperous basis,” Herbert Hoover said on October 25, 1929.

Oops.

“The basics in the economy are good,” George W. Bush said on Dec. 4, 2007.

Double oops.

Both of these presidents would soon regret their words. Hoover’s comments came after “Black Thursday,” when stocks fell 11% in the morning before clawing back—only to plunge 13% on “Black Monday” (Oct. 28), and another 12% the day after that. It was the beginning of the worst economic downturn the United States had ever seen—the Great Depression, which was made worse by a bone-headed decision to impose tariffs on America’s trade partners.

Continue reading “Like Hoover and Dubya, will Trump eat his words about the economy?”

If This is 1929…

Guest Post by Michael Batnick

Eight days before the market bottomed in July 1932, Ben Graham wrote an article in Forbes, Should Rich But Losing Corporations Be Liquidated? In it he wrote, “More than one industrial company in three selling for less than its net current assets, with a large number quoted at less than their unencumbered cash.” At a time when the CAPE ratio was just above 5, many businesses were worth more dead than alive.

In the ten-years leading up to the crash in 1929, the CAPE ratio went from a low of 5.02 up to 32.56. Today, it’s as close to the 1929 peak as it’s ever been, with the exception of the late 1990s. “The CAPE ratio in the United States has never gotten above 30 without a subsequent market crash” would be a true statement. Perhaps misleading, with a sample size of two, but true nonetheless. So is it possible that today is 1929 redux? Continue reading “If This is 1929…”

50% Correction Is Impossible! Really?

Submitted by Lance Roberts via RealInvestmentAdvice.com,

There is little doubt currently that complacency reigns in the financial markets. Nowhere is that complacency more evident than in the Market Greed/Fear Index which combines the 4-measures of investor sentiment (AAII, INVI, MarketVane, & NAAIM) with the inverse Volatility Index.

The reason I revisit the index above is due to last Thursday’s “3-Things” post in which I presented two arguments concerning the potential for a 50-70% decline in the markets. John Hussman’s view was simply a valuation argument stating:

“To offer some idea of the precipice the market has reached, the median price/revenue ratio of individual S&P 500 component stocks now stands just over 2.45, easily the highest level in history. The longer-term norm for the S&P 500 price/revenue ratio is less than 1.0. Even a retreat to 1.3, which we’ve observed at many points even in recent cycles, would take the stock market to nearly half of present levels.”

Continue reading “50% Correction Is Impossible! Really?”

YOU ARE HERE

“The next Fourth Turning is due to begin shortly after the new millennium, midway through the Oh-Oh decade. Around the year 2005, a sudden spark will catalyze a Crisis mood. Remnants of the old social order will disintegrate. Political and economic trust will implode. Real hardship will beset the land, with severe distress that could involve questions of class, race, nation and empire. The very survival of the nation will feel at stake. Sometime before the year 2025, America will pass through a great gate in history, commensurate with the American Revolution, Civil War, and twin emergencies of the Great Depression and World War II.” – Strauss & Howe The Fourth Turning 

The chart below was posted by Jesse a few weeks ago. It accompanied a post titled Gathering Storm. He doesn’t specifically refer to the chart, but his words reflect the ominous view of the future depicted in the chart.

“When gold and silver finally are able, through price action, to have their say about the state of Western fiscal and monetary policy actions, it may break a few ear drums and shatter a more than a few illusions about the wisdom and honesty of the money masters. Slowly, but surely, a reckoning is coming. And what has been hidden will be revealed.”

The title of the post and the chart both grabbed my attention and provide a glimpse into the reality of our present situation. The Gathering Storm was the title of Winston Churchill’s volume one history of World War II. Churchill documents the tumultuous twenty years leading up to World War II in The Gathering Storm. The years following World War I, through the Great Depression and the rise of Hitler were abysmal, but only a prelude to the approaching horror of 65 million deaths over the next six years. What appeared to be dark days in the 1930’s were only storm clouds gathering before a once in a lifetime tempest. In my view we stand at an equally perilous point in history today.

Continue reading “YOU ARE HERE”

DANGEROUS DIVERGENCE

The chart below would appear to be in conflict with the results of a recent Gallup poll regarding stock ownership by Americans. The ratio of household equities to money market fund assets is near a record high, 60% above the 2007 high and 30% above the 1999 internet bubble high. The chart would appear to prove irrational exuberance among the general populace.

In reality, the lowest percentage of Americans currently own stock over the last two decades. With the stock market within spitting distance of all-time highs, only 52% of Americans own stock, down from 65% in 2007. As the stock market has gone up, average Americans have left the market. They realize it is a rigged game and they are nothing but muppets to the Wall Street shysters.

InvestInStocks1

Continue reading “DANGEROUS DIVERGENCE”

WORST CASE SCENARIO = 73% DOWN FROM HERE

As the stock market gyrates higher and lower in a fairly narrow range, the spokesmodels and talking heads on CNBC breathlessly regurgitate the standard bullish mantra designed to keep the muppets in the market. They are employees of a massive corporation whose bottom line and stock price depend upon advertising revenues reaped from Wall Street and K Street. They aren’t journalists. They are propagandists disguised as journalists. Their job is to keep you confused, misinformed, and ignorant of the true facts.

Based on the never ending happy talk and buy now gibberish spouted by the pundit lackeys, you would think we are experiencing a bull market of epic proportions and anyone who hasn’t been in the market has missed out on tremendous gains. There’s one little problem with that bit of propaganda. It’s completely false. The Fed turned off the QE spigot at the end of October 2014 and the market has gone nowhere ever since.

QE1 began in September 2008, taking the Fed balance sheet from $900 billion to $2.3 trillion by June 2010. This helped halt the stock market crash and drove the S&P 500 up by 50% from its March 2009 lows. QE2 was implemented in November 2010 and increased the Fed balance sheet to $2.9 trillion by the end of 2011. This resulted in an unacceptable 10% increase in the S&P 500, so the Fed cranked up their printing presses to hyper-speed and launched the mother of all quantitative easings, with QE3 pushing their balance sheet to $4.5 trillion by October 2014, when they ceased their “Save a Wall Street Banker” campaign.

As Main Street dies, Wall Street has been paved in gold. The S&P 500 soared to all-time highs, with 40% gains from the September 2012 QE3 launch until its cessation in October 2014. Like a heroine addict, Wall Street has experienced withdrawal symptoms ever since, and begs for more monetary easing injections. Yellen and her gang of central bank drug dealers keep the patient from dying by continuing doses of ZIRP and psychologically comforting dialogue designed to cheer up Wall Street bankers.

Continue reading “WORST CASE SCENARIO = 73% DOWN FROM HERE”

Similarity in Stock Market Charts for 1929, 2008, 2016 May Show This is the Epocalypse

 Guest Post by David Haggith

Is the US stock market a caged bear? [By Philip Timms [Public domain], via Wikimedia Commons]Compare the Great Depression to the Great Recession, and you’ll see a similar pattern in how the Dow Jones Industrial Average graphs out. That pattern appears to be repeating now. The nation’s most notorious stock market crash in 1929 did not occur as a single fall off a cliff, but started with high points that rounded downward as the market bounced off a lowering ceiling; then it experienced a sharp plunge for about a month, then rallied, and then it experienced the huge crash we’ve heard about all our lives. After that, it experienced many more rallies and crashes before it found its absolute bottom.

What people forget is that each of the cliffs was made distinct by brief rallies and sometimes by extended rallies in between. The Great Depression was never a smooth path to the bottom.


Graph of the stock market crash of 1929 – The Great Depression


1929 Stock Market Crash Chart


Here’s a graph of the dailies leading up to the Great Crash of October 1929 — the first big drop of many that constituted the Great Depression. Notice that the stock market in 1929 rounded off at the top, took an initial small plunge that lasted about a month, recovered back to the downward curved trajectory of its highest points, then rounded down more sharply and finally fell off the great cliff that became known as “Black Tuesday” or the “Crash of 1929.” Then it spiked way up over the course of a week, only to fall deeper into the abyss over the next half month. And that was just its first crash on the long road to despair.

Continue reading “Similarity in Stock Market Charts for 1929, 2008, 2016 May Show This is the Epocalypse”

THE WORSE THINGS GET FOR YOU, THE BETTER THEY GET FOR WALL STREET

On October 2 the BLS reported absolutely atrocious employment data, with virtually no job growth other than the phantom jobs added by the fantastically wrong Birth/Death adjustment for all those new businesses springing up around the country. The MSM couldn’t even spin it in a positive manner, as the previous two months of lies were adjusted significantly downward. What a shocker. At the beginning of that day the Dow stood at 16,250 and had been in a downward trend for a couple months as the global economy has been clearly weakening. The immediate rational reaction to the horrible news was a 250 point plunge down to the 16,000 level. But by the end of the day the market had finished up over 200 points, as this terrible news was immediately interpreted as good news for the market, because the Federal Reserve will never ever increase interest rates again.

Over the next three weeks, the economic data has continued to deteriorate, corporate earnings have been crashing, and both Europe and China are experiencing continuing and deepening economic declines. The big swinging dicks on Wall Street have programmed their HFT computers to buy, buy, buy. The worse the data, the bigger the gains. The market has soared by 1,600 points since the low on October 2. A 10% surge based upon lousy economic info, as the economy is either in recession or headed into recession, is irrational, ridiculous, and warped, just like our financial system. This is what happens when crony capitalism takes root like a foul weed and is bankrolled by a central bank that cares only for Wall Street, while throwing Main Street under the bus.

Continue reading “THE WORSE THINGS GET FOR YOU, THE BETTER THEY GET FOR WALL STREET”

TULIPMANIA 2015

“In reading The History of Nations, we find that, like individuals, they have their whims and their peculiarities, their seasons of excitement and recklessness, when they care not what they do. We find that whole communities suddenly fix their minds upon one object and go mad in its pursuit; that millions of people become simultaneously impressed with one delusion, and run after it, till their attention is caught by some new folly more captivating than the first.”Charles Mackay, Extraordinary Popular Delusions and the Madness of Crowds

Human nature doesn’t change. It is the same across the world. We are driven by fear and greed. Overconfidence, lack of reason, poor math skills, herd mentality, and delusional thinking lead to bubbles. When the bubble reaches a tipping point, fear takes over and the herd all try to exit at the same time through a narrow pathway. The Crash ensues.

It happened in the 1600’s.

It happened in the 1700’s.

It happened in the 1800’s.

It happened in the 1920’s.


Continue reading “TULIPMANIA 2015”

DANGER WILL ROBINSON

It’s funny how the truth sometimes leaks out from the government. I’m guessing that Mr. Ted Berg will not be working for the Office of Financial Research much longer. This new agency was created by the Dodd Frank Law and is supposed to protect consumers from the evil Wall Street banks. But we all know the evil Wall Street banks wrote the bill, have gutted the major provisions, have captured all the regulatory agencies, own the Federal Reserve, and control all the politicians in Washington D.C. So, when an honest government analyst writes an honest truthful report that unequivocally proves the stock market is grossly overvalued and headed for a crash, the Wall Street banking cabal will surely call the top government apparatchiks to voice their displeasure. Truth is treason in an empire of lies.

The soon to be fired Mr. Berg’s verbiage is subtle, but pretty clear.

Option-implied volatility is quite low today, but markets can change rapidly and unpredictably, a phenomenon described here as “quicksilver markets.” The volatility spikes in late 2014 and early 2015 may foreshadow more turbulent times ahead. Although no one can predict the timing of market shocks, we can identify periods when asset prices appear abnormally high, and we can address the potential implications for financial stability.

Markets can change rapidly and unpredictably. When these changes occur they are sharpest and most damaging when asset valuations are at extreme highs. High valuations have important implications for expected investment returns and, potentially, for financial stability.

However, quicksilver markets can turn from tranquil to turbulent in short order. It is worth noting that in 2006 volatility was low and companies were generating record profit margins, until the business cycle came to an abrupt halt due to events that many people had not anticipated.

The full report can be found here:

http://financialresearch.gov/briefs/files/OFRbr-2015-02-quicksilver-markets.pdf

The meat of the report is in the charts. The CAPE Ratio, which has been a highly accurate predictor of market tops is now almost two standard deviations above the long term average and at the same level it was before the 2008 crash. It has only been higher in 1929 and 1999. That should give you a nice warm feeling about the coming bull market. Right?

Profit margins are at all-time record highs as corporations don’t have to pay higher wages, can borrow for virtually free, and continue to outsource to foreign countries. Profit margins are 60% above the long-term average and always revert to the mean. Do you expect them to expand or contract from here?

Continue reading “DANGER WILL ROBINSON”

EXIT NOW

The facts speak for themselves. Your choice is to believe in the almighty ability of academic bankers to keep their confidence game going, or exit now before the apocalypse hits. I got no dog in this hunt. I ain’t selling newsletters, gold, or investment ideas. I strictly look at the facts. And they tell me to stay as far away from the financial markets as humanly possible. It isn’t a matter of if, only a matter of when. Here are the pertinent snippets from Hussman’s Weekly Letter:

Unless we observe a rather swift improvement in market internals and a further, material easing in credit spreads – neither which would relieve the present overvaluation of the market, but both which would defer our immediate concerns about downside risk – the present moment likely represents the best opportunity to reduce exposure to stock market risk that investors are likely to encounter in the coming 8 years.

Last week, the cyclically-adjusted P/E of the S&P 500 Index surpassed 27, versus a historical norm of just 15 prior to the late-1990’s market bubble. The S&P 500 price/revenue ratio surpassed 1.8, versus a pre-bubble norm of just 0.8. On a wide range of historically reliable measures (having a nearly 90% correlation with actual subsequent S&P 500 total returns), we estimate current valuations to be fully 118% above levels associated with historically normal subsequent returns in stocks. Advisory bullishness (Investors Intelligence) shot to 59.5%, compared with only 14.1% bears – one of the most lopsided sentiment extremes on record. The S&P 500 registered a record high after an advancing half-cycle since 2009 that is historically long-in-the-tooth and already exceeds the valuation peaks set at every cyclical extreme in history but 2000 on the S&P 500 (across all stocks, current median price/earnings, price/revenue and enterprise value/EBITDA multiples already exceed the 2000 extreme). Equally important, our measures of market internals and credit spreads, despite moderate improvement in recent weeks, continue to suggest a shift toward risk-aversion among investors. An environment of compressed risk premiums coupled with increasing risk-aversion is without question the most hostile set of features one can identify in the historical record.

Short term interest rates remain near zero, 10-year bond yields have declined below 2%, and our estimate of 10-year S&P 500 total returns has declined to just 1.4% (see Ockham’s Razor and the Market Cycle for the arithmetic behind these historically-reliable estimates). Recent weeks mark the first time in history that our estimates of prospective 10-year returns on all conventional asset classes have simultaneously declined below 2% annually. We don’t expect a portfolio mix of stocks, bonds and cash to achieve any meaningful return over the coming 8-year period. The fact that the financial markets feel wonderful right now is precisely because yield-seeking speculation and monetary distortions have raised security prices today to levels where they are likely to stand years from today – with steep roller-coaster rides in the interim.

Continue reading “EXIT NOW”

1929 – 2000 – 2015

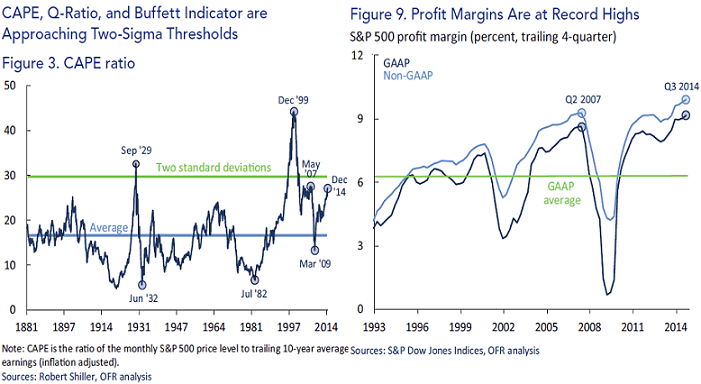
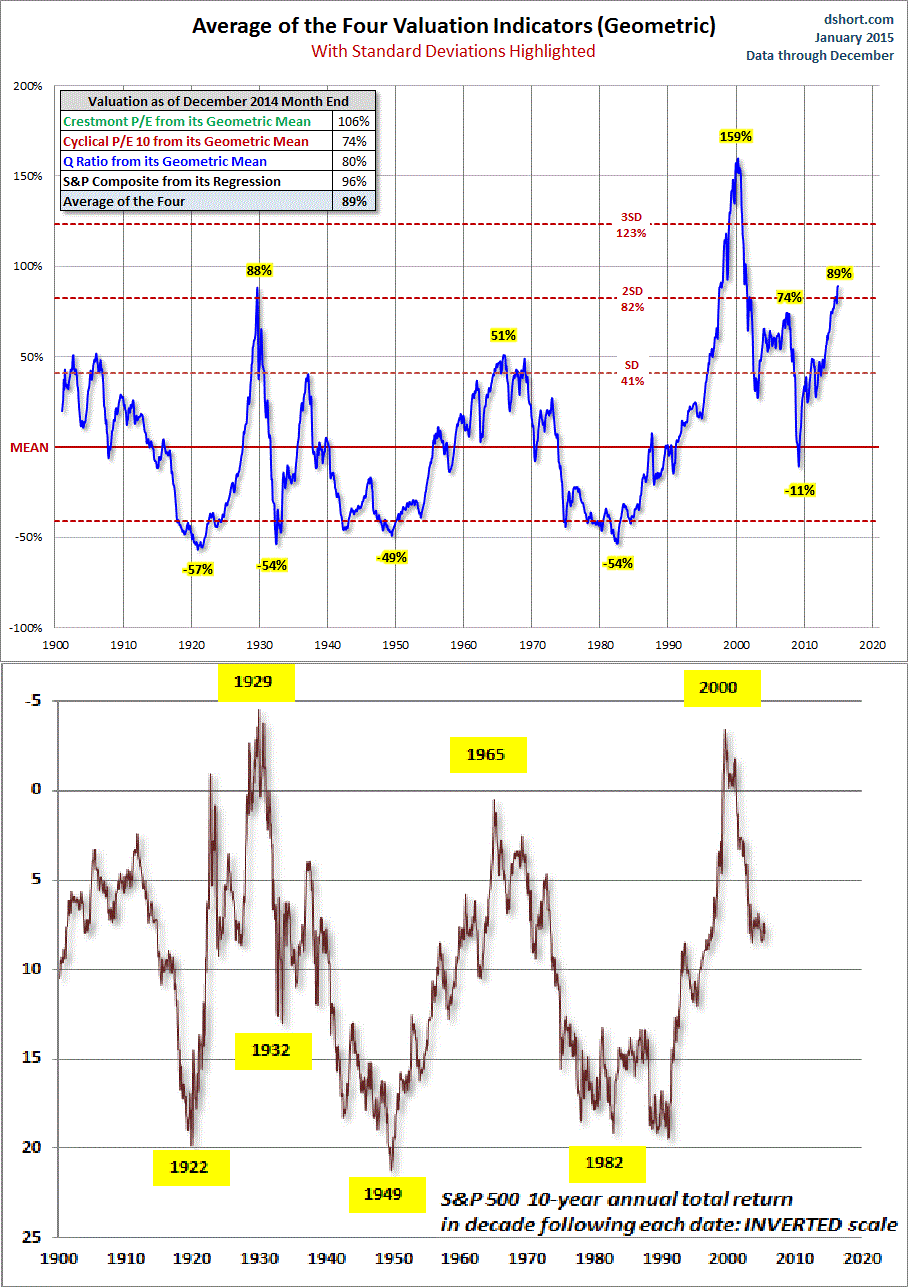
Based on the average of four separate valuation models that have been accurate in assessing whether the stock market is overvalued or undervalued over the last century, the stock market is currently over valued by 89%. The stock market was overvalued by 88% before the 1929 Crash. It was “only” overvalued by 74% in 2007 before the last Crash. It has only been more overvalued once in market history – 2000. I wonder what happened after that?

If you were paying attention in Statistics class in college, you know that when something reaches 2 standard deviations from the mean, you’ve reached EXTREME levels. The market valuation is now past 2 standard deviations. Anyone staying in the market or buying today is betting on the market to reach 2000 internet bubble proportions. I’ll pass. You will be lucky to “achieve” a negative 2% nominal return over the next ten years. After taking inflation into account you will likely end up with a -5% to -10% annual return, with a crash thrown in for good measure.

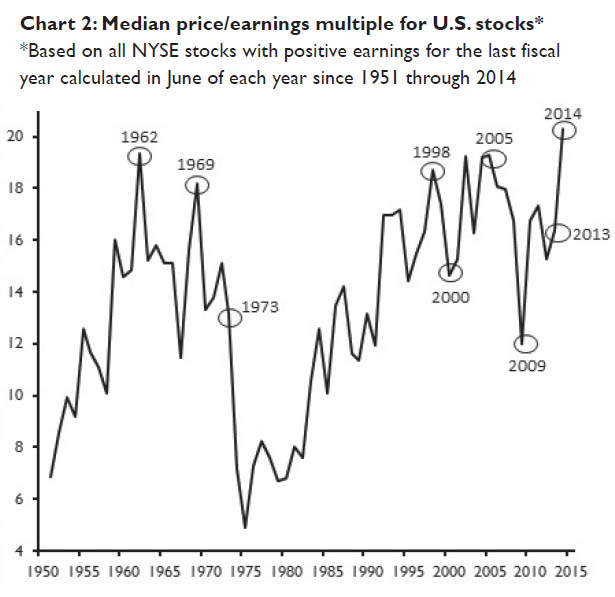
Betting on a 2000 level of overvaluation is even more foolish when you take into account the fact the overvaluation was centered solely on tech and internet stocks. Large cap value stocks were significantly undervalued in 2000. The chart below from former perma-bull Jim Paulson at Wells Fargo reveals the foreboding truth. The median price/earnings ratio is now the highest in U.S. history. It is 45% higher than it was in 2000. It is 15% higher than it was in 2007.

John Hussman answers a few pertinent questions below. But the gist of the situation is simple. The stock market is overvalued equal to or more than it was in 1929, 2000, and 2007. The reason it has gotten this far is the $3.5 trillion of Federal Reserve fiat handed to the Wall Street banks and the ridiculous faith in these Ivy League educated puppets to engineer never ending stock market gains.

Greed has been winning for the last five years. Fear has been creeping in, especially since QE3 ended in October. The increased volatility is a warning signal. Fear will be reasserting itself, and it will happen suddenly. Buying the dip will stop working. Faith in central bankers will dissipate and reality will be a bitch. This episode of delusion will end just as all the previous episodes of delusion ended. See the chart above. What goes way up, eventually goes way down.

Q: Doesn’t QE, zero interest rate policy and (insert your excuse for ignoring history here) mean that this time is different?
A: Not really. The main thing that has been legitimately “different” in the half-cycle since 2009 is that QE loosened the overlap and increased the delay between the emergence of extremely overvalued, overbought, overbullish syndromes and the onset of risk aversion among investors. The fact that QE-induced yield-seeking could induce such a sustained gap between these two was clearly a surprise to us. However, it remains true that once market internals and credit spreads indicate a shift in investor risk preferences, stocks are prone to abrupt losses – particularly when overvalued, overbought, overbullish conditions have recently been in place. This has been true even in instances since 2009.

Q: Why are market internals and credit spreads deteriorating?
A: Historically, the “catalysts” that provoke a shift in risk aversion typically become clear only after the fact. Our impression is that the plunge in oil prices and safe-haven Treasury yields, coupled with the rise in yields on default-sensitive assets such as junk debt is most consistent with an abrupt slowing in global economic activity.

Q: Is the market likely to crash?
A: We certainly wouldn’t rely on a crash, but frankly, we currently observe nothing that would prevent something that might feel like an “air pocket” or “free fall.” Crashes represent points where many investors simultaneously shift toward risk-aversion and too few investors are on the other side to buy the stock offered for sale – except at a sharp discount. They have tended to unfold after the market has already lost 10-14% and the recovery from that low fails. We would allow for that possibility, but our discipline is firmly centered on responding to observable market conditions as they emerge, and shifting as those conditions shift.

Read all of John Hussman’s Weekly Letter
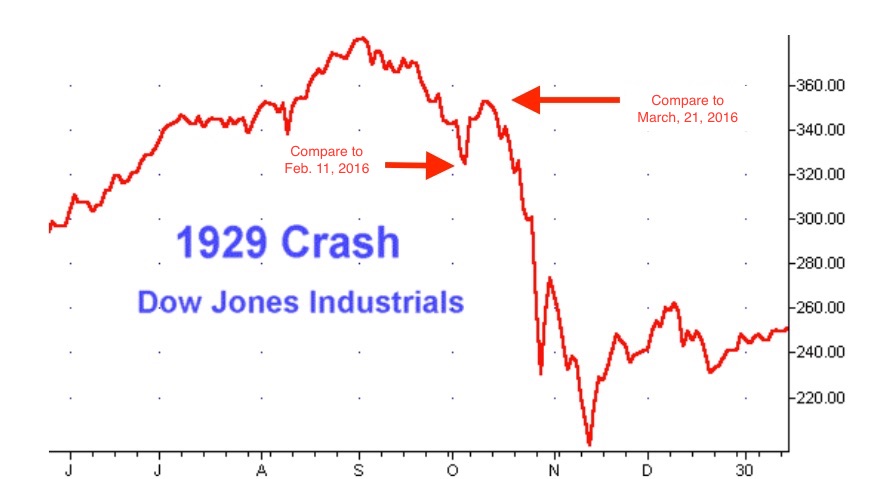
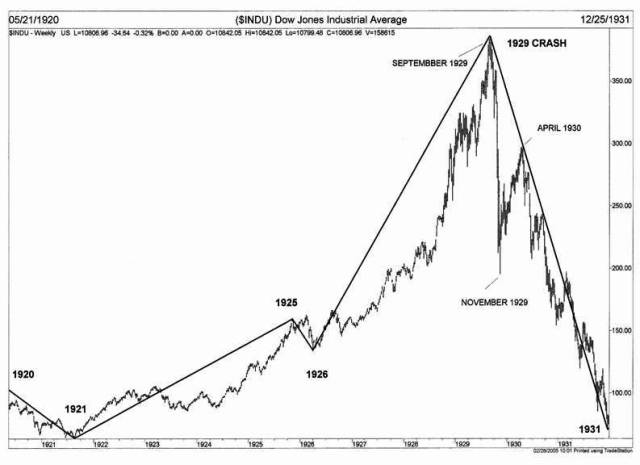
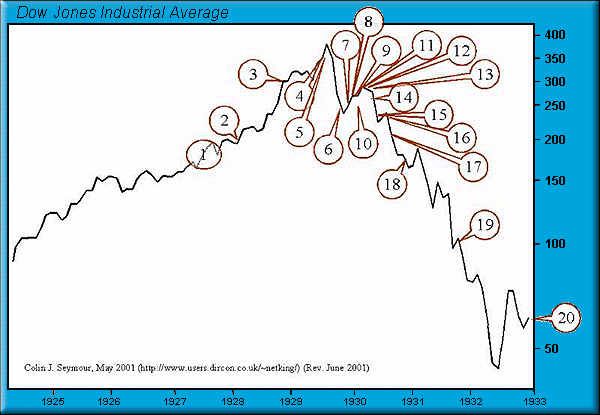
WATERFALL AHEAD

It’s just a coincidence.

Margin debt at all-time highs. Corporate profits at all-time highs and now falling. Bullish investor sentiment at all-time highs. Valuations at highs seen in 1929, 2000, and 2007. QE is done. Issuance of subprime debt at record levels. High yield rates soaring. Japan in a depression. Europe in a recession. China slowing rapidly. Middle East crumbling as oil revenues evaporate and chaos ensues. Russia headed into recession. Consumer driven American economy only sustained by rapid expansion of auto and student loan debt. The similarities to the 1928-1929 boom and bust are just a coincidence. Right?

No Need to Worry.

HAPPY DAYS ARE HERE AGAIN – FOR THE 0.1%

They won. You lost. They don’t care. They are daring you to stop them.

The Roaring 20’s are back again.

The top 0.1% (consisting of 160,000 families worth $73m on average) hold 22% of America’s wealth, just shy of the 1929 peak—and almost the same share as the bottom 90% of the population.

I wonder what happens next.

PERMANENTLY HIGH PLATEAU

The talking heads will be rolled out on CNBC to assure the masses that all is well. The economy is strong. Corporate profits are awesome. The stock market will go higher. Op-eds will be written by Wall Street CEOs telling you it’s the best time to invest. Federal Reserve presidents will give speeches saying there are clear skies ahead. Obama will hold a press conference to tell you how many jobs he’s added and how low the budget deficit has gone.

We couldn’t possibly be entering phase two of our Greater Depression after a temporary lull provided by the $8 trillion pumped into the veins of Wall Street by the Fed and Obama. Could we?

1927-1933 Chart of Pompous Prognosticators

Chart locations are an approximate indication only

  1. “We will not have any more crashes in our time.”
    – John Maynard Keynes in 1927
  2. “I cannot help but raise a dissenting voice to statements that we are living in a fool’s paradise, and that prosperity in this country must necessarily diminish and recede in the near future.”
    – E. H. H. Simmons, President, New York Stock Exchange, January 12, 1928
    “There will be no interruption of our permanent prosperity.”
    – Myron E. Forbes, President, Pierce Arrow Motor Car Co., January 12, 1928
  3. “No Congress of the United States ever assembled, on surveying the state of the Union, has met with a more pleasing prospect than that which appears at the present time. In the domestic field there is tranquility and contentment…and the highest record of years of prosperity. In the foreign field there is peace, the goodwill which comes from mutual understanding.”
    – Calvin Coolidge December 4, 1928
  4. “There may be a recession in stock prices, but not anything in the nature of a crash.”
    – Irving Fisher, leading U.S. economist , New York Times, Sept. 5, 1929
  5. “Stock prices have reached what looks like a permanently high plateau. I do not feel there will be soon if ever a 50 or 60 point break from present levels, such as (bears) have predicted. I expect to see the stock market a good deal higher within a few months.”
    – Irving Fisher, Ph.D. in economics, Oct. 17, 1929
    “This crash is not going to have much effect on business.”
    – Arthur Reynolds, Chairman of Continental Illinois Bank of Chicago, October 24, 1929
    “There will be no repetition of the break of yesterday… I have no fear of another comparable decline.”
    – Arthur W. Loasby (President of the Equitable Trust Company), quoted in NYT, Friday, October 25, 1929

    “We feel that fundamentally Wall Street is sound, and that for people who can afford to pay for them outright, good stocks are cheap at these prices.”
    – Goodbody and Company market-letter quoted in The New York Times, Friday, October 25, 1929

  6. “This is the time to buy stocks. This is the time to recall the words of the late J. P. Morgan… that any man who is bearish on America will go broke. Within a few days there is likely to be a bear panic rather than a bull panic. Many of the low prices as a result of this hysterical selling are not likely to be reached again in many years.”
    – R. W. McNeel, market analyst, as quoted in the New York Herald Tribune, October 30, 1929
    “Buying of sound, seasoned issues now will not be regretted”
    – E. A. Pearce market letter quoted in the New York Herald Tribune, October 30, 1929
    “Some pretty intelligent people are now buying stocks… Unless we are to have a panic — which no one seriously believes, stocks have hit bottom.”
    – R. W. McNeal, financial analyst in October 1929
  7. “The decline is in paper values, not in tangible goods and services…America is now in the eighth year of prosperity as commercially defined. The former great periods of prosperity in America averaged eleven years. On this basis we now have three more years to go before the tailspin.”
    – Stuart Chase (American economist and author), NY Herald Tribune, November 1, 1929
    “Hysteria has now disappeared from Wall Street.”
    – The Times of London, November 2, 1929
    “The Wall Street crash doesn’t mean that there will be any general or serious business depression… For six years American business has been diverting a substantial part of its attention, its energies and its resources on the speculative game… Now that irrelevant, alien and hazardous adventure is over. Business has come home again, back to its job, providentially unscathed, sound in wind and limb, financially stronger than ever before.”
    – Business Week, November 2, 1929

    “…despite its severity, we believe that the slump in stock prices will prove an intermediate movement and not the precursor of a business depression such as would entail prolonged further liquidation…”
    – Harvard Economic Society (HES), November 2, 1929

  8. “… a serious depression seems improbable; [we expect] recovery of business next spring, with further improvement in the fall.”
    – HES, November 10, 1929
    “The end of the decline of the Stock Market will probably not be long, only a few more days at most.”
    – Irving Fisher, Professor of Economics at Yale University, November 14, 1929
    “In most of the cities and towns of this country, this Wall Street panic will have no effect.”
    – Paul Block (President of the Block newspaper chain), editorial, November 15, 1929

    “Financial storm definitely passed.”
    – Bernard Baruch, cablegram to Winston Churchill, November 15, 1929

  9. “I see nothing in the present situation that is either menacing or warrants pessimism… I have every confidence that there will be a revival of activity in the spring, and that during this coming year the country will make steady progress.”
    – Andrew W. Mellon, U.S. Secretary of the Treasury December 31, 1929
    “I am convinced that through these measures we have reestablished confidence.”
    – Herbert Hoover, December 1929
    “[1930 will be] a splendid employment year.”
    – U.S. Dept. of Labor, New Year’s Forecast, December 1929
  10. “For the immediate future, at least, the outlook (stocks) is bright.”
    – Irving Fisher, Ph.D. in Economics, in early 1930
  11. “…there are indications that the severest phase of the recession is over…”
    – Harvard Economic Society (HES) Jan 18, 1930
  12. “There is nothing in the situation to be disturbed about.”
    – Secretary of the Treasury Andrew Mellon, Feb 1930
  13. “The spring of 1930 marks the end of a period of grave concern…American business is steadily coming back to a normal level of prosperity.”
    – Julius Barnes, head of Hoover’s National Business Survey Conference, Mar 16, 1930
    “… the outlook continues favorable…”
    – HES Mar 29, 1930
  14. “… the outlook is favorable…”
    – HES Apr 19, 1930
  15. “While the crash only took place six months ago, I am convinced we have now passed through the worst — and with continued unity of effort we shall rapidly recover. There has been no significant bank or industrial failure. That danger, too, is safely behind us.”
    – Herbert Hoover, President of the United States, May 1, 1930
    “…by May or June the spring recovery forecast in our letters of last December and November should clearly be apparent…”
    – HES May 17, 1930
    “Gentleman, you have come sixty days too late. The depression is over.”
    – Herbert Hoover, responding to a delegation requesting a public works program to help speed the recovery, June 1930
  16. “… irregular and conflicting movements of business should soon give way to a sustained recovery…”
    – HES June 28, 1930
  17. “… the present depression has about spent its force…”
    – HES, Aug 30, 1930
  18. “We are now near the end of the declining phase of the depression.”
    – HES Nov 15, 1930
  19. “Stabilization at [present] levels is clearly possible.”
    – HES Oct 31, 1931
  20. “All safe deposit boxes in banks or financial institutions have been sealed… and may only be opened in the presence of an agent of the I.R.S.”
    – President F.D. Roosevelt, 1933