

Submitted by Lance Roberts via RealInvestmentAdvice.com,
There is little doubt currently that complacency reigns in the financial markets. Nowhere is that complacency more evident than in the Market Greed/Fear Index which combines the 4-measures of investor sentiment (AAII, INVI, MarketVane, & NAAIM) with the inverse Volatility Index.
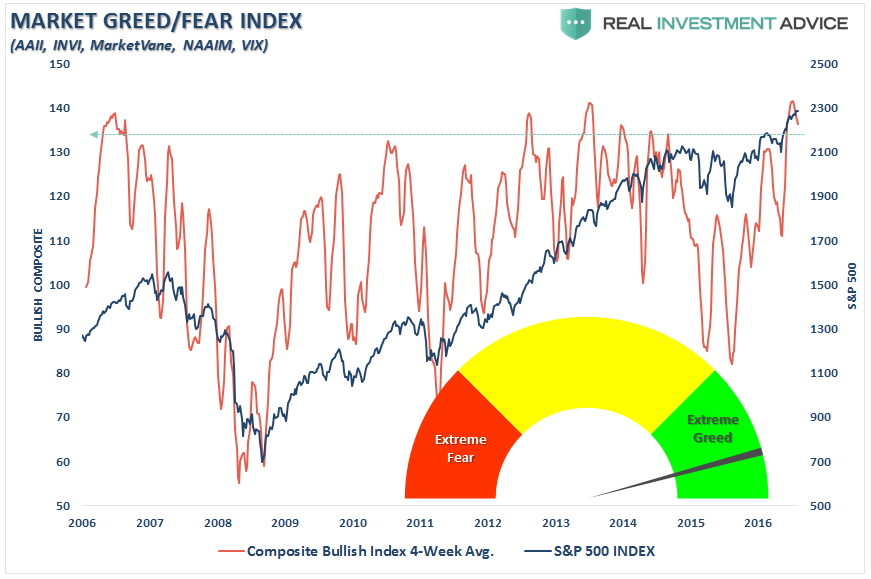
The reason I revisit the index above is due to last Thursday’s “3-Things” post in which I presented two arguments concerning the potential for a 50-70% decline in the markets. John Hussman’s view was simply a valuation argument stating:
“To offer some idea of the precipice the market has reached, the median price/revenue ratio of individual S&P 500 component stocks now stands just over 2.45, easily the highest level in history. The longer-term norm for the S&P 500 price/revenue ratio is less than 1.0. Even a retreat to 1.3, which we’ve observed at many points even in recent cycles, would take the stock market to nearly half of present levels.”
It is my sincere desire to provide readers of this site with the best unbiased information available, and a forum where it can be discussed openly, as our Founders intended. But it is not easy nor inexpensive to do so, especially when those who wish to prevent us from making the truth known, attack us without mercy on all fronts on a daily basis. So each time you visit the site, I would ask that you consider the value that you receive and have received from The Burning Platform and the community of which you are a vital part. I can't do it all alone, and I need your help and support to keep it alive. Please consider contributing an amount commensurate to the value that you receive from this site and community, or even by becoming a sustaining supporter through periodic contributions. [Burning Platform LLC - PO Box 1520 Kulpsville, PA 19443] or Paypal
-----------------------------------------------------
To donate via Stripe, click here.
-----------------------------------------------------
Use promo code ILMF2, and save up to 66% on all MyPillow purchases. (The Burning Platform benefits when you use this promo code.)
The second argument was from Harry Dent based on demographic trends within the economy as the mass wave of “baby boomers” become net-distributors from the financial markets (most importantly draining underfunded pension funds) in the future. To wit:
“At heart, I’m a cycle guy. Demographics just happens to be the most important cycle in this modern era since the middle class only formed recently — its only been since World War 2 that the everyday person mattered so much; because now they have $50,000-$60,000 in income and can buy homes over 30 years and borrow a lot of money. This was not the case before the Great Depression and World War 2.
And based on demographics, we predicted that the U.S. Baby Boom wouldn’t peak until 2007, and then our economy will weaken — as both did in 2008. We’ve lived off of QE every since.”
Not surprisingly, those two comments drew a lot of fire from readers such as this one:
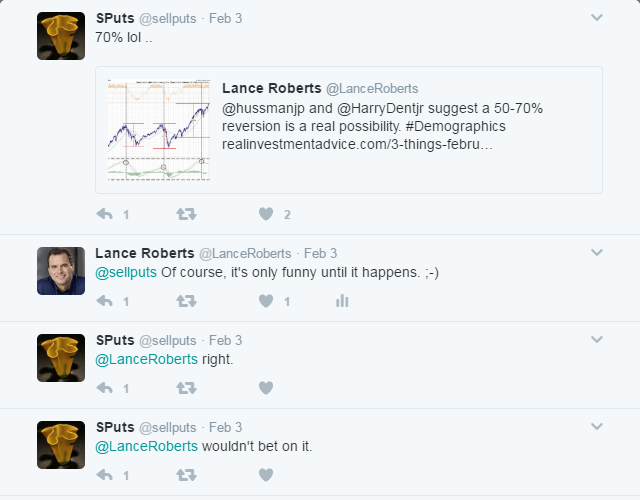
Or this one…
Hmmm….where have I heard this before.
“Stock prices have reached what looks like a permanently high plateau. I do not feel there will be soon if ever a 50 or 60 point break from present levels, such as they have predicted. I expect to see the stock market a good deal higher within a few months.”
– Dr. Irving Fisher, Economist at Yale University 1929
This Utopian belief of now infinite stability within the financial markets due to ongoing Central Bank interventions is a most dangerous concept. This is particularly the case given the structural and economic shifts in the economy due to the rise in debt which has derailed the efficient allocation of capital. As shown below the economy is currently mired at the lowest average annual growth rate since 1790. (Data courtesy of Measuring Worth)
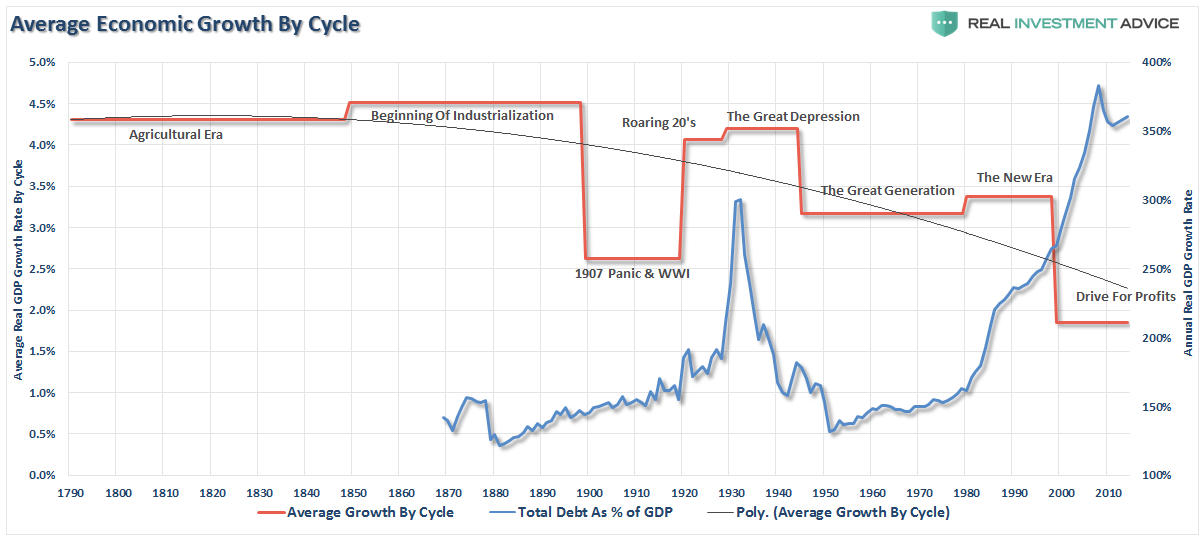
Furthermore, a quick analysis of past history suggests the regularity of corrections which have run the gamut of devastating blows to investor capital. (Monthly data courtesy of Dr. Robert Shiller)

If you look at the chart above you will notice the longest economic expansions in history have also been followed by declines of 30% or more. With the current economic expansion now the 3rd longest in history at 92-months, a subsequent correction of 30% or more should not be surprising.
Of course, what fuels corrections is not just a change in investor sentiment, but an ignition of the leverage that exists through the extension of debt. Currently, leverage is near the highest levels on record which is the equivalent of a tank of gasoline waiting on a match.

And…corporate leverage. The chart below shows the total liabilities and equity of non-financial businesses in the U.S. divided by the Gross Value Added. I have overlaid the S&P 500 for relevance.
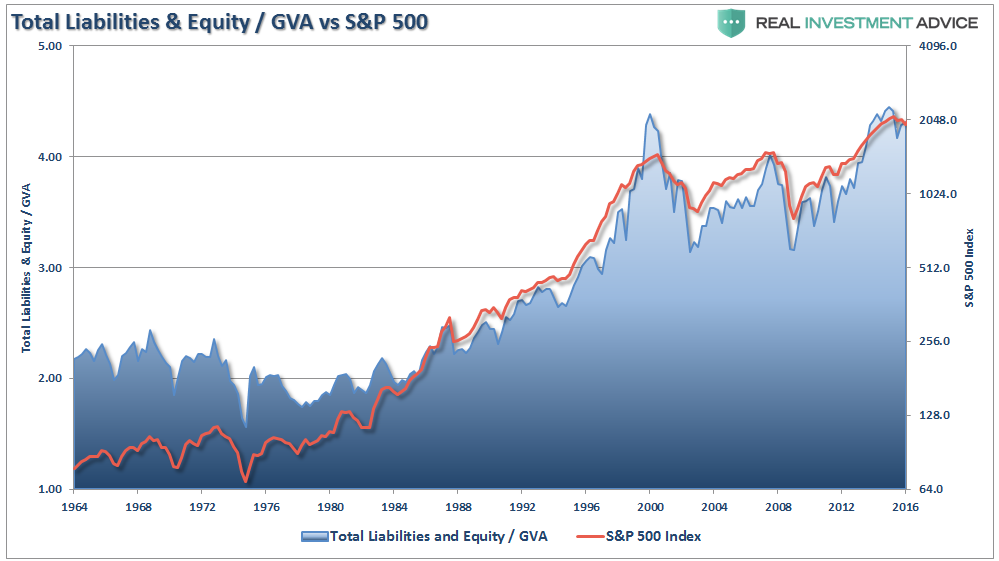
As can be clearly seen, leverage fuels both halves of the full market cycle. On the way up, increases in leverage provide the capital necessary for accelerated share buybacks and increased speculation in the markets. Leverage, like gasoline, is inert until a catalyst is applied. It is the unwinding of that leverage that accelerates the liquidation of assets in the markets causes prices to plunge faster and further than most can possibly imagine.
It has only happened twice already since the turn of the century. Yet, less than a decade from the last crash, investors have once again fallen prey to excessive exuberance and the belief that somehow this time will most assuredly be different.
Measuring The Size Of The Next Correction
As a portfolio strategist, there is little question the markets are still confined to a bullish uptrend. Currently, portfolio allocation models remain near fully invested. Therefore, what concerns me most is NOT what could cause the markets rise, as I am already invested, but what could lead to a sharp decline that would negatively impact investment capital.
[Important Note: It is worth remembering that winning the long-term investment game has more to do with avoidance of losses than the capturing of gains. It is a function of math.]
What causes the next correction of magnitude is unknown. It always is until after the fact. There are many factors that can, and will, contribute to the eventual correction which will “feed” on the unwinding of excessive exuberance, valuations, leverage, and deviations from long-term averages.
The chart below shows the deviation from the long-term trend line. I have calculated an advance to 2400 for the S&P 500 which, as I published in “2400 or Bust”, is a reasonable target for the current “melt-up” phase of the market.
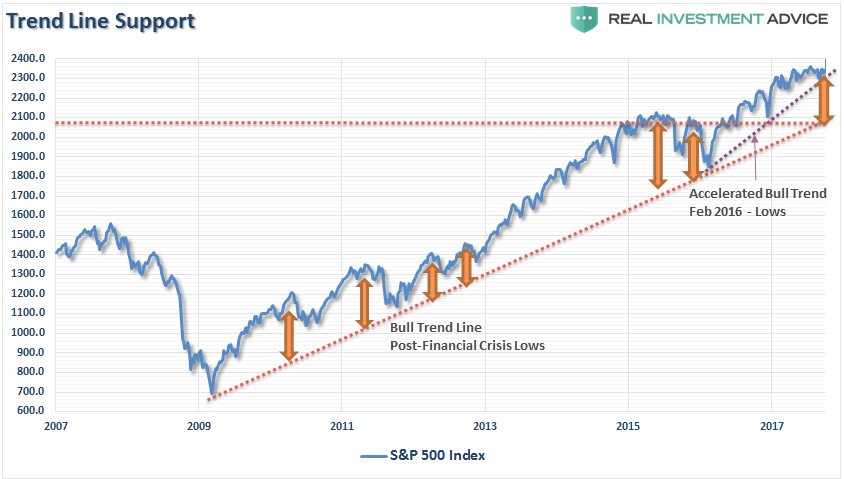
As stated above, the bull market trend which began in 2009 remains currently intact (dashed blue line). A correction from 2400 back to that bullish uptrend line, which occurred in both 2011 and 2012, would entail a decline to 2100. That would be a 14.2% decline and while not technically a “bear” market, for many investors it will certainly “feel” like one.
But what if a simple correction accelerates? To analyze how a market accelerates to a 50% correction, we can use a “Fibonacci Retracement” analysis as shown in the chart below. As defined by Investopedia:
“The Fibonacci retracement is the potential retracement of a financial asset’s original move in price. Fibonacci retracements use horizontal lines to indicate areas of support or resistance at the key Fibonacci levels before it continues in the original direction. These levels are created by drawing a trendline between two extreme points and then dividing the vertical distance by the key Fibonacci ratios of 23.6%, 38.2%, 50%, 61.8% and 100%.”
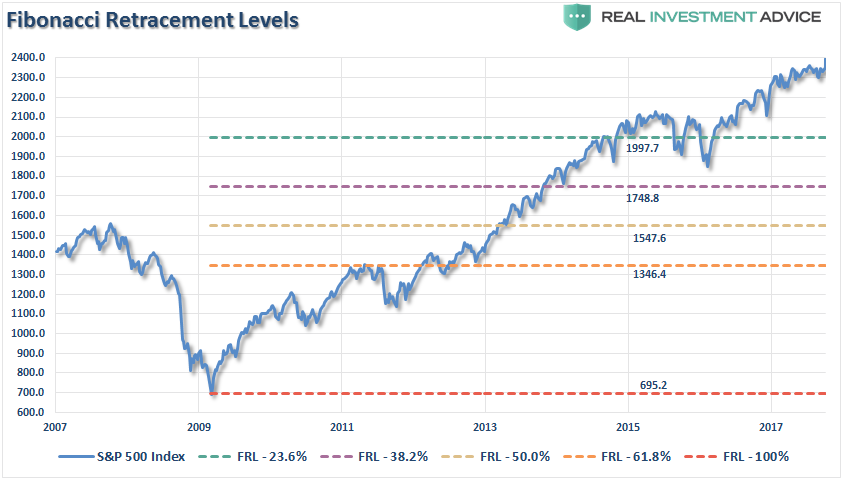
So, a 50% retracement from the 2400 level would push the markets back towards 1547. As identified in the chart, a 23.6% retracement from the 2009 lows would violate the bullish trend line. Such a violation would set up a change in trend, from bullish to bearish, thereby bringing more selling into the market.
If the next wave of selling starts to trigger “margin calls,” the next three levels of retracement become much more viable. The market would initially seek out support at the 38.2% retracement level of 1748 which would be a decline of 27.16% and would push the markets into an “official” bear market. As margin calls accelerate, so does the forced liquidation which then bleeds over into psychological panic selling as investors reach the point of capitulation.
This is where “buy and hold” quickly becomes “get me the $*@# out.”
That can’t happen you say? As shown in the chart below, corrections of 50% to 61.8% of the previous advance are common with corrections even eclipsing 100% as well.
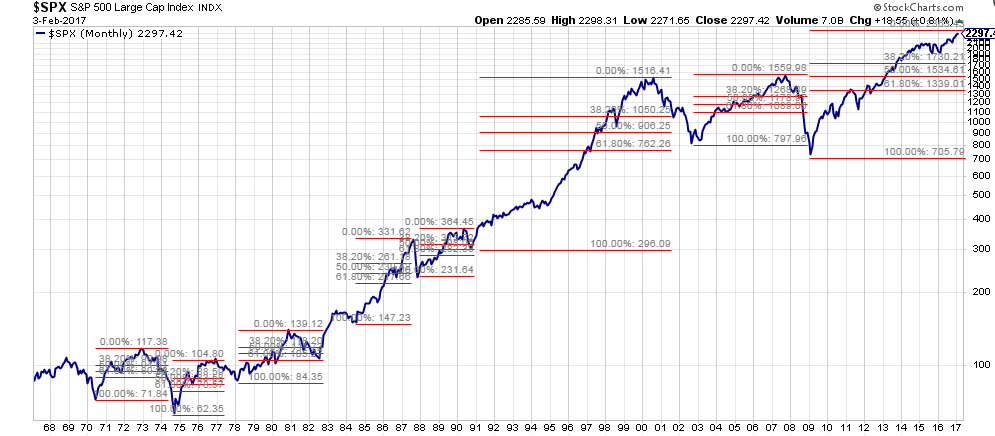
It is unlikely that a 50-61.8% correction would happen outside of the onset of a recession. But considering we are already 91-months into the current cycle and extremely levered, there is a rising level of risk that should not be ignored.
By the way, a 50% retracement would register a 35.5% decline in investor portfolios. A 61.8% retracement would destroy 43.9% of investor capital.
And that is how you get a 50% decline.
However, while I show that the greater levels of a potential correction will likely be coincident with a recession, as they have historically been, it does NOT mean that a recession is required. A sharp rise in interest rates or inflation, a downturn in economic growth, deflationary pressures from the Eurozone, or a credit related issue in the “junk bond” market could all do the trick.
No one will know, until in hindsight, what the catalyst will be that ignites a “panic” in the market. This is why we do analysis to understand the potential risks in the market as compared to expected reward. What is abundantly clear is that the potential “upside” in the market is currently outweighed by the “downside” risk. It is important to remember that our job as investors is to “sell high” and “buy low.”
Unfortunately, for most, they are already doing exactly the opposite.
There is one important truth that is indisputable, irrefutable, and absolutely undeniable: “mean reversions” are the only constant in the financial markets over time. The problem is that the next “mean reverting” event will remove most, if not all, of the gains investors have made over the last five years.
Don’t think it can happen?
You might want to reconsider.


Sounds about right. When people realize that the factories returning to the US will be manned by robots and corporations are continuing to shed lots of excess baggage, i.e., employees and corporate profits don’t justify stock valuations, etc., etc., everyone will go: “Oh shit, time to put my money under the mattress”. But it will be too late because your money will be GONE.
But I’m a pessimist so you can dismiss me.
The only way we EVER get a correction of ANY significance will be because they will want/make it happen.
And just who is THEY you ask? The Joos man, the JOOS!!
I have an idea that a 50% correction IS impossible…once the ball really gets rolling there is no way it stops at only 50%.
With the current DOW P/E at 20.4 I’d think a correction of about a max of 30% if things go really bad is likely.
A 50% correction wouldn’t be a correction, it would be a part of a much larger economic collapse. This is possible, but less likely than a significant economic setback with a correction to more realistic market levels as a result.
FWIW, the markets reflect very little of what is happening in the real world of the average productive wage earners economic life.
Exactly my point. A “correction” would imply that the stock market bottoms and comes back up. I think that is possible if the system is able to pull the same trick they did in 2008. At 50% it would no longer be a correction, it would be a full on bloodbath with nothing to stop it. Who knows where that bottom would be…but does anyone contemplate a world in the near future where there IS no stock market? It’s more than a little terrifying.
A 50% correction impossible?? Ya I’d say that would be some what right….
More like a 80 – 90% correction is more likely!
Dear February 2017 DOW Investor
All this talk about an imminent Market correction or collapse is pure hogwash and fear mongering. The same can be said about the bursting of a Market bubble. A bubble doesn’t burst until it’s at its biggest point. There is still a lot of inflating to be done. With such low interests rates big Corporations will be able to continue buying back their own stock and the Market will continue to soar. Nobel prize economists, Politicians and the Federal Reserve are also seeing to it that the party is far from over. They are really smart fellas, they are! They have your back. They would never lie to you. Oh and whatever you do, for goodness sakes, don’t buy any precious metals. That stuff isn’t real money and quite worthless. Party on and keep buying those stock shares!!
Sincerely,
September 1929 -DOW investor
What a boring article.
We know the market is rigged.
The market is an illusion.
Our $ is worthless, some event soon,
and it will be confirmed. Or gamble,
your choice. Bet on face book?
I think the stock market should be about 112 thousand !!! the dollar is almost worthless …
Fercryinoutloud people! At some point a 50% correction is not only possible, it is damned likely! And no, it won’t be the end of the world.
Do people already forget that the S&P 500 bottomed out in March 2009 when it was down 53% from its 2007 high?
but then the great one flashed his nobel economic prize & all was right with the world-
trump just doesn’t know business like obama does–