EVERY HOME DEPOT STORE IN THE COUNTRY HAS BEEN HACKED

Sounds of silence from the mainstream media and the scumbags at the mega-retailer. The Target breach was over 40 million credit cards. This breach looks much larger.

Via Brian Krebs

Data: Nearly All U.S. Home Depot Stores Hit

New data gathered from the cybercrime underground suggests that the apparent credit and debit card breach at Home Depot involves nearly all of the company’s stores across the nation.

Evidence that a major U.S. retailer had been hacked and was leaking card data first surfaced Monday on the cybercrime store rescator[dot]cc, the shop that was principally responsible for selling cards stolen in the Target, Sally Beauty, P.F. Chang’s and Harbor Freight credit card breaches.

As with cards put up for sale in the wake of those breaches, Rescator’s shop lists each card according to the city, state and ZIP code of the store from which each card was stolen. See this story for examples of this dynamic in the case of Sally Beauty, and this piece that features the same analysis on the stolen card data from the Target breach.

Stolen credit cards for sale on Rescator's site index each card by the city, state and ZIP of the retail store from which each card was stolen.

The ZIP code data allows crooks who buy these cards to create counterfeit copies of the credit and debit cards, and use them to buy gift cards and high-priced merchandise from big box retail stores. This information is extremely valuable to the crooks who are purchasing the stolen cards, for one simple reason: Banks will often block in-store card transactions on purchases that occur outside of the legitimate cardholder’s geographic region (particularly in the wake of a major breach).

Thus, experienced crooks prefer to purchase cards that were stolen from stores near them, because they know that using the cards for fraudulent purchases in the same geographic area as the legitimate cardholder is less likely to trigger alerts about suspicious transactions — alerts that could render the stolen card data worthless for the thieves.

This morning, KrebsOnSecurity pulled down all of the unique ZIP codes in the card data currently for sale from the two batches of cards that at least four banks have now mapped back to previous transactions at Home Depot. KrebsOnSecurity also obtained a commercial marketing list showing the location and ZIP code of every Home Depot store across the country.

Here’s the kicker:

A comparison of the ZIP code data between the unique ZIPs represented on Rescator’s site, and those of the Home Depot stores shows a staggering 99.4 percent overlap.

A comparison of the ZIP code data between the unique ZIPs represented on Rescator’s site, and those of the Home Depot stores shows a staggering 99.4 percent overlap.

Home Depot has not yet said for certain whether it has in fact experienced a store-wide card breach; rather, the most that the company is saying so far is that it is investigating “unusual activity” and that it is working with law enforcement on an investigation. Here is the page that Home Depot has set up for further notices about this investigation.

I double checked the data with several sources, including with Nicholas Weaver, a researcher at the International Computer Science Institute (ICSI) and at the University California, Berkeley. Weaver said the data suggests a very strong correlation.

“A a 99+ percent overlap in ZIP codes strongly suggests that this source is from Home Depot,” Weaver said.

Here is a list of all unique ZIP codes represented in more than 3,000 debit and credit cards currently for sale on Rescator’s site (Rescator limits the number of cards one can view to the first 33 pages of results, 50 cards per page). Here is a list of all unique Home Depot ZIP codes, in case anyone wants to double check my work.

In all, there were 1,822 ZIP codes represented in the card data for sale on Rescator’s site, and 1,939 unique ZIPs corresponding to Home Depot store locations (while Home Depot says it has ~2,200 stores, it is safe to assume that some ZIP codes have more than one Home Depot store). Between those two lists of ZIP codes, there are 10 ZIP codes in Rescator’s card data that do not correspond to actual Home Depot stores.

Finally, there were 127 ZIP codes for Home Depot stores that were not in the list of ZIPs represented in Rescator’s card data. However, it’s important to note that the data pulled from Rescator’s site is almost certainly a tiny fraction of the cards that his shop will put up for sale in the coming days and weeks.

What does all this mean? Well, assuming Home Depot does confirm a breach, it could give us one way to determine the likely size of this breach. The banks I spoke with in reporting this story say the data they’re looking at suggests that the breach probably started in late April or early May. To put that in perspective, the Target breach impacted just shy of 1,800 stores, lasted for approximately three weeks, and resulted in the theft of roughly 40 million debit and credit card numbers. If a breach at Home Depot is confirmed, and if this analysis is correct, this breach could be much, much bigger than Target.

How does this affect you, dear reader? It’s important for Americans to remember that you have zero fraud liability on your credit card. If the card is compromised in a data breach and fraud occurs, any fraudulent charges will be reversed. BUT, not all fraudulent charges may be detected by the bank that issued your card, so it’s important to monitor your account for any unauthorized transactions and report those bogus charges immediately.

HOME DEPOT COVERING UP MASSIVE CREDIT CARD DATA BREACH

How come an independent security blogger has to reveal massive retail credit card breaches? Brian Krebs also blew the lid off the Target debacle. He thinks this could be much bigger than the Target breach. What you get from the mega-retailers is stonewalling and canned PR messaging. They are clueless fucks who are busy spending their money on stock buybacks and executive stock options, rather than IT security.

DO NOT SHOP AT HOME DEPOT. Your data is not safe.

Via Brian Krebs

Banks: Credit Card Breach at Home Depot

Multiple banks say they are seeing evidence that Home Depot stores may be the source of a massive new batch of stolen credit and debit cards that went on sale this morning in the cybercrime underground. Home Depot says that it is working with banks and law enforcement agencies to investigate reports of suspicious activity.

Contacted by this reporter about information shared from several financial institutions, Home Depot spokesperson Paula Drake confirmed that the company is investigating.

“I can confirm we are looking into some unusual activity and we are working with our banking partners and law enforcement to investigate,” Drake said, reading from a prepared statement. “Protecting our customers’ information is something we take extremely seriously, and we are aggressively gathering facts at this point while working to protect customers. If we confirm that a breach has a occurred, we will make sure customers are notified immediately. Right now, for security reasons, it would be inappropriate for us to speculate further – but we will provide further information as soon as possible.”

There are signs that the perpetrators of this apparent breach may be the same group of Russian and Ukrainian hackers responsible for the data breaches at Target, Sally Beauty and P.F. Chang’s, among others. The banks contacted by this reporter all purchased their customers’ cards from the same underground store – rescator[dot]cc — which on Sept. 2 moved two massive new batches of stolen cards onto the market.

A massive new batch of cards labeled "American Sanctions" and "European Sanctions" went on sale Tuesday, Sept. 2, 2014.

In what can only be interpreted as intended retribution for U.S. and European sanctions against Russia for its aggressive actions in Ukraine, this crime shop has named its newest batch of cards “American Sanctions.” Stolen cards issued by European banks that were used in compromised US store locations are being sold under a new batch of cards labled “European Sanctions.”

It is not clear at this time how many stores may be impacted, but preliminary analysis indicates the breach may extend across all 2,200 Home Depot stores in the United States. Home Depot also operates some 287 stores outside the U.S. including in Canada, Guam, Mexico, and Puerto Rico.

This is likely to be a fast-moving story with several updates as more information becomes available. Stay tuned.

Update: 1:50 p.m. ET: Several banks contacted by this reporter said they believe this breach may extend back to late April or early May 2014. If that is accurate — and if even a majority of Home Depot stores were compromised — this breach could be many times larger than Target, which had 40 million credit and debit cards stolen over a three-week period.

TARGET & LOWES REFLECT OUR DYING WARPED ECONOMY

Target and Lowes reported their quarterly results today. Target’s results were atrocious and Lowes’ results were lackluster, to say the least. When you dig into the numbers for two of the largest retailers in the world, you can see our dying warped society clearly.

Target’s annual sales exceed $72 billion.

Lowes’ annual sales exceed $53 billion.

There are a couple data points that reveal the death of retail on the horizon. Target operates 1,925 stores. Lowes operates 1,835 stores. Prior to the 2008 financial collapse these two behemoths were opening hundreds of stores per year. Their scientific financial models spit out ever higher sales as they dominated their markets. It seems their assumptions were slightly optimistic. They’ve had their come to Jesus moment and now realize their expansion days are done.

Target has opened a grand total of 7 stores in the last year. Lowes will open 10 new stores this year.

Target is the poster child for awful management over the last seven years. Of their 1,925 stores, 1,795 of them are in the U.S. Their dreadful foray into Canada accounts for the other 130 stores. They had 1,719 U.S. stores in 2009. It costs approximately $25 million to construct and open a Target store.

In the last five years they have spent approximately $1.9 billion building new stores. Over this same time frame they spent $10.9 billion buying back their own stock. Think about that for a moment. Rather than investing in their business or giving the money back to shareholders through dividends, they bought their own stock in order to boost EPS for Wall Street and drive their stock price higher. They borrowed $2 billion to buy back the stock. With $13.9 billion of debt, maybe their cash could have been used to pay it down rather than buying their overpriced stock. Their stock price is exactly where it was in 2010, and 20% below its 2013 high.

Guess who received a huge chunk of the shares bought back? That’s right. Top management received massive multi-million dollar compensation packages in stock. It was in their best interest to drive the stock price higher. Maybe that is why they didn’t invest in information technology security. The unprecedented breach and loss of millions of credit card data to criminals has destroyed their credibility as a retailer.

The chickens came home to roost today. Their profit plunged by $377 million to a pitiful $234 million. For comparison purposes, they made $686 million in the 2nd quarter of 2007. Their comparable store sales continue to stagnate. Comparable store sales were flat, but the number of customer transactions declined by 1.3%. Price increases of 3.0% offset the traffic decline. Nothing like a little non-existent inflation to help out.

Target is a disaster. Their expansion days are over. They haven’t admitted it yet, but they will be closing hundreds of stores as our consumer society runs out of money to buy their Chinese made crap.

Lowes is a few years behind Target in the downward spiral phase, but they are employing the exact same warped strategy. Their profit was up 10.4%, while comparable sales were up only 4.4%. They didn’t report their traffic counts, but you can assume they had the same price inflation as Target, so store traffic increases were probably in the range of 1% to 2%. They lowered their profit guidance, as the fake housing recovery is not boosting sales.

But, they are implementing the Target strategy of buying back their stock to boost EPS. Their reported EPS was up 18%, as they bought back $1.1 billion for the quarter and $2.0 billion for the first six months. Since 2009 these bozos have bought back $14.1 billion of their own stock, enriching their executives at the expense of employees and stockholders. And they didn’t do it with excess cash flow. They borrowed $5.6 billion to buy back that stock. Over this same time frame they only spent $3 billion on new stores.

The managements of the mega-retailers know the glory days are over. The American consumer is tapped out and Boomers will not be spending what they don’t have. The CEO’s have chosen to enrich themselves on the downside, rather than return cash to stockholders. This is now the American way. It has been aided and abetted by the Federal Reserve. The excessively low interest rates have allowed corporations to borrow and buy back their stock in order to boost their stock price. Actual profit growth not required. When “high yield” junk bonds issued by dodgy companies across the land yield less than 5%, you’ve got yourself a bond market bubble.

According to the Federal Reserve, corporate debt has risen 27% over the past five years to an all-time record of $9.6 trillion. Close to $2 trillion was used to buy back stock, with $500 billion used last year alone. These companies then turned around and issued $180 billion of the shares to top management. This is the circle of life at the top. Meanwhile real wages for the real workers continue to decline. The Fed has created another bubble in corporate stock buybacks, and it isn’t just retailers.

The iconic manufacturing giant Caterpillar just announced its 20th month in a row of negative year over year sales. If manufacturing hasn’t recovered and retail hasn’t recovered, what is left? The stock market is reaching new highs solely on the bubble blowing abilities of Ben and Janet.

Caterpillar has it all figured out. Increasing revenue and profits is old school. Investing in your business is for suckers. You can push your stock to all-time highs with new paradigm thinking. Just buy back $2.1 billion of your own stock and redistribute it back to your top executives. Then it will trickle down to the working class eventually.

I wonder if historians will look back on this period in U.S. history and wonder WTF were those idiots thinking. They will rightly wonder how  a country could believe that layering trillions in debt upon trillions of debt, in order to consume our way to prosperity, while waging endless wars, making entitlement promises that couldn’t possibly be kept, and funneling the vast majority of the nation’s wealth to .1% of the population, would possibly end well.

This dying, warped, delusional empire is a wonder to behold. We surely won’t go out with a whimper.

RETAIL DEATH RATTLE GROWS LOUDER

The definition of death rattle is a sound often produced by someone who is near death when fluids such as saliva and bronchial secretions accumulate in the throat and upper chest. The person can’t swallow and emits a deepening wheezing sound as they gasp for breath. This can go on for two or three days before death relieves them of their misery. The American retail industry is emitting an unmistakable wheezing sound as a long slow painful death approaches.

It was exactly four months ago when I wrote THE RETAIL DEATH RATTLE. Here are a few terse anecdotes from that article:

The absolute collapse in retail visitor counts is the warning siren that this country is about to collide with the reality Americans have run out of time, money, jobs, and illusions. The exponential growth model, built upon a never ending flow of consumer credit and an endless supply of cheap fuel, has reached its limit of growth. The titans of Wall Street and their puppets in Washington D.C. have wrung every drop of faux wealth from the dying middle class. There are nothing left but withering carcasses and bleached bones.

Once the Wall Street created fraud collapsed and the waves of delusion subsided, retailers have been revealed to be swimming naked. Their relentless expansion, based on exponential growth, cannibalized itself, new store construction ground to a halt, sales and profits have declined, and the inevitable closing of thousands of stores has begun.

The implications of this long and winding road to ruin are far reaching. Store closings so far have only been a ripple compared to the tsunami coming to right size the industry for a future of declining spending. Over the next five to ten years, tens of thousands of stores will be shuttered. Companies like JC Penney, Sears and Radio Shack will go bankrupt and become historical footnotes. Considering retail employment is lower today than it was in 2002 before the massive retail expansion, the future will see in excess of 1 million retail workers lose their jobs. Bernanke and the Feds have allowed real estate mall owners to roll over non-performing loans and pretend they are generating enough rental income to cover their loan obligations. As more stores go dark, this little game of extend and pretend will come to an end.

Retail store results for the 1st quarter of 2014 have been rolling in over the last week. It seems the hideous government reported retail sales results over the last six months are being confirmed by the dying bricks and mortar mega-chains. In case you missed the corporate mainstream media not reporting the facts and doing their usual positive spin, here are the absolutely dreadful headlines:

Wal-Mart Profit Plunges By $220 Million as US Store Traffic Declines by 1.4%

Target Profit Plunges by $80 Million, 16% Lower Than 2013, as Store Traffic Declines by 2.3%

Sears Loses $358 Million in First Quarter as Comparable Store Sales at Sears Plunge by 7.8% and Sales at Kmart Plunge by 5.1%

JC Penney Thrilled With Loss of Only $358 Million For the Quarter

Kohl’s Operating Income Plunges by 17% as Comparable Sales Decline by 3.4%

Costco Profit Declines by $84 Million as Comp Store Sales Only Increase by 2%

Staples Profit Plunges by 44% as Sales Collapse and Closing Hundreds of Stores

Gap Income Drops 22% as Same Store Sales Fall

Ann Taylor Profit Crashes by 75% as Same Store Sales Fall

American Eagle Profits Tumble 86%, Will Close 150 Stores

Aeropostale Losses $77 Million as Sales Collapse by 12%

Big Lots Profit Tumbles by 90% as Sales Flat & Exiting Canadian Market

Best Buy Sales Decline by $300 Million as Margins Decline and Comparable Store Sales Decline by 1.3%

Macy’s Profit Flat as Comparable Store Sales decline by 1.4%

Dollar General Profit Plummets by 40% as Comp Store Sales Decline by 3.8%

Urban Outfitters Earnings Collapse by 20% as Sales Stagnate

McDonalds Earnings Fall by $66 Million as US Comp Sales Fall by 1.7%

Darden Profit Collapses by 30% as Same Restaurant Sales Plunge by 5.6% and Company Selling Red Lobster

TJX Misses Earnings Expectations as Sales & Earnings Flat

Dick’s Misses Earnings Expectations as Golf Store Sales Plummet

Home Depot Misses Earnings Expectations as Customer Traffic Only Rises by 2.2%

Lowes Misses Earnings Expectations as Customer Traffic was Flat

Of course, those headlines were never reported. I went to each earnings report and gathered the info that should have been reported by the CNBC bimbos and hacks. Anything you heard surely had a Wall Street spin attached, like the standard BETTER THAN EXPECTED. I love that one. At the start of the quarter the Wall Street shysters post earnings expectations. As the quarter progresses, the company whispers the bad news to Wall Street and the earnings expectations are lowered. Then the company beats the lowered earnings expectation by a penny and the Wall Street scum hail it as a great achievement.  The muppets must be sacrificed to sustain the Wall Street bonus pool. Wall Street investment bank geniuses rated JC Penney a buy from $85 per share in 2007 all the way down to $5 a share in 2013. No more needs to be said about Wall Street “analysis”.

It seems even the lowered expectation scam hasn’t worked this time. U.S. retailer profits have missed lowered expectations by the most in 13 years. They generally “beat” expectations by 3% when the game is being played properly. They’ve missed expectations in the 1st quarter by 3.2%, the worst miss since the fourth quarter of 2000. If my memory serves me right, I believe the economy entered recession shortly thereafter. The brilliant Ivy League trained Wall Street MBAs, earning high six digit salaries on Wall Street, predicted a 13% increase in retailer profits for the first quarter. A monkey with a magic 8 ball could do a better job than these Wall Street big swinging dicks.

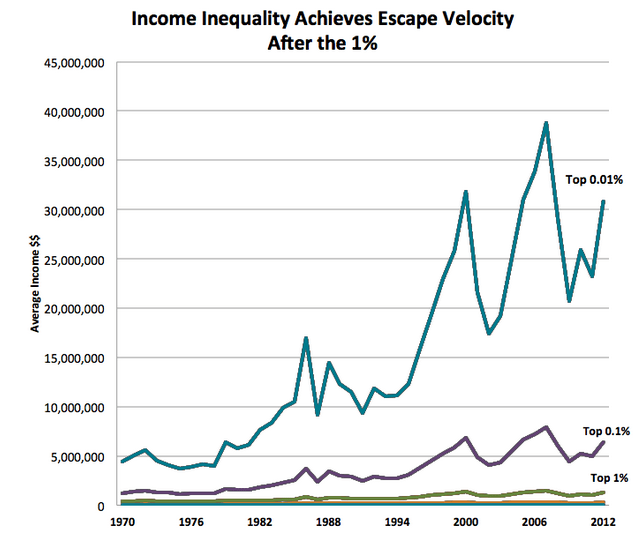
The highly compensated flunkies who sit in the corner CEO office of the mega-retail chains trotted out the usual drivel about cold and snowy winter weather and looking forward to tremendous success over the remainder of the year. How do these excuse machine CEO’s explain the success of many high end retailers during the first quarter? Doesn’t weather impact stores that cater to the .01%? The continued unrelenting decline in profits of retailers, dependent upon the working class, couldn’t have anything to do with this chart? It seems only the oligarchs have made much progress over the last four decades.

Screen-Shot-2014-03-29-at-9.23.25-PM.png

Retail CEO gurus all think they have a master plan to revive sales. I’ll let you in on a secret. They don’t really have a plan. They have no idea why they experienced tremendous success from 2000 through 2007, and why their businesses have not revived since the 2008 financial collapse. Retail CEOs are not the sharpest tools in the shed. They were born on third base and thought they hit a triple. Now they are stranded there, with no hope of getting home. They should be figuring out how to position themselves for the multi-year contraction in sales, but their egos and hubris will keep them from taking the actions necessary to keep their companies afloat in the next decade. Bankruptcy awaits. The front line workers will be shit canned and the CEO will get a golden parachute. It’s the American way.

The secret to retail success before 2007 was: create or copy a successful concept; get Wall Street financing and go public ASAP; source all your inventory from Far East slave labor factories; hire thousands of minimum wage level workers to process transactions; build hundreds of new stores every year to cover up the fact the existing stores had deteriorating performance; convince millions of gullible dupes to buy cheap Chinese shit they didn’t need with money they didn’t have; and pretend this didn’t solely rely upon cheap easy debt pumped into the veins of American consumers by the Federal Reserve and their Wall Street bank owners. The financial crisis in 2008 revealed everyone was swimming naked, when the tide of easy credit subsided.

The pundits, politicians and delusional retail CEOs continue to await the revival of retail sales as if reality doesn’t exist. The 1 million retail stores, 109,000 shopping centers, and nearly 15 billion square feet of retail space for an aging, increasingly impoverished, and savings poor populace might be a tad too much and will require a slight downsizing – say 3 or 4 billion square feet. Considering the debt fueled frenzy from 2000 through 2008 added 2.7 billion square feet to our suburban sprawl concrete landscape, a divestiture of that foolish investment will be the floor. If you think there are a lot of SPACE AVAILABLE signs dotting the countryside, you ain’t seen nothing yet. The mega-chains have already halted all expansion. That was the first step. The weaker players like Radio Shack, Sears, Family Dollar, Coldwater Creek, Staples, Barnes & Noble, Blockbuster and dozens of others are already closing stores by the hundreds. Thousands more will follow.

This isn’t some doom and gloom prediction based on nothing but my opinion. This is the inevitable result of demographic certainties, unequivocal data, and the consequences of a retailer herd mentality and lemming like behavior of consumers. The open and shut case for further shuttering of 3 to 4 billion square feet of retail is as follows:

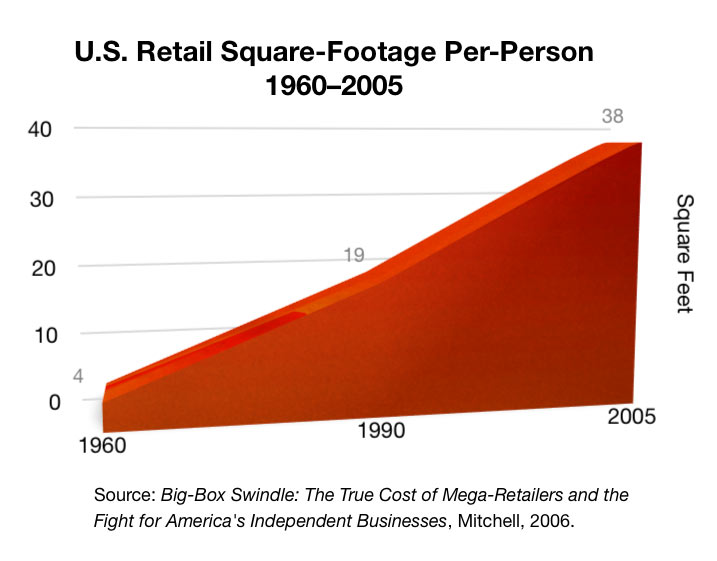
  • There is 47 square feet of retail space per person in America. This is 8 times as much as any other country on earth. This is up from 38 square feet in 2005; 30 square feet in 2000; 19 square feet in 1990; and 4 square feet in 1960. If we just revert to 2005 levels, 3 billion square feet would need to go dark. Does that sound outrageous?

  • Annual consumer expenditures by those over 65 years old drop by 40% from their highest spending years from 45 to 54 years old. The number of Americans turning 65 will increase by 10,000 per day for the next 16 years. There were 35 million Americans over 65 in 2000, accounting for 12% of the total population. By 2030 there will be 70 million Americans over 65, accounting for 20% of the total population. Do you think that bodes well for retailers?

  • Half of Americans between the ages of 50 and 64 have no retirement savings. The other half has accumulated $52,000 or less. It seems the debt financed consumer product orgy of the last two decades has left most people nearly penniless. More than 50% of workers aged 25 to 44 report they have less than $10,000 of total savings.

  • The lack of retirement and general savings is reflected in the historically low personal savings rate of a miniscule 3.8%. Before the materialistic frenzy of the last couple decades, rational Americans used to save 10% or more of their personal income. With virtually no savings as they approach their retirement years and an already extremely low savings rate, do retail CEOs really see a spending revival on the horizon?

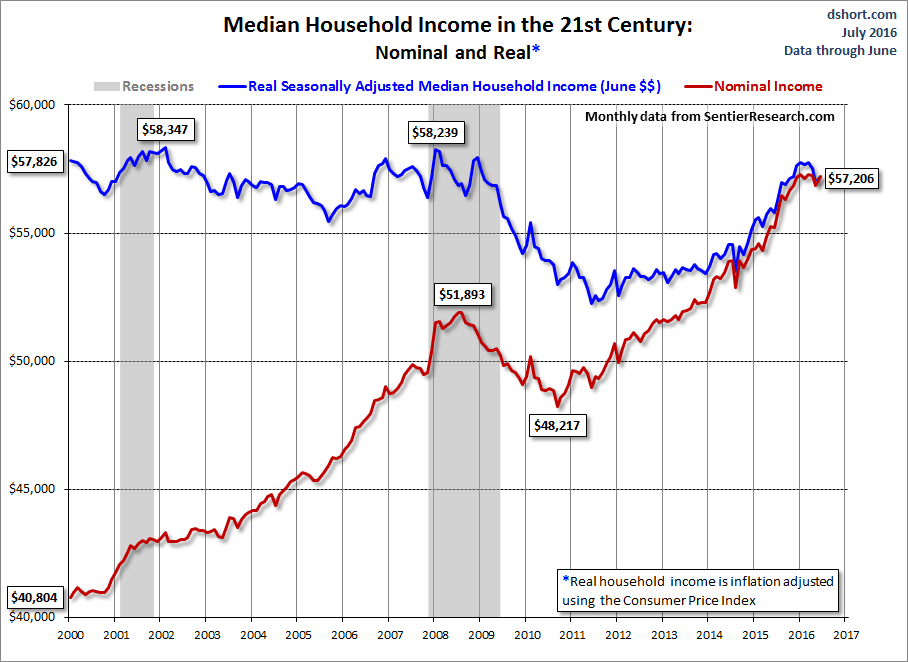
  • If you thought the savings rate was so low because consumers are flush with cash and so optimistic about their job prospects they are unconcerned about the need to save for a rainy day, you would be wrong. It has been raining for the last 14 years. Real median household income is 7.5% lower today than it was in 2001. Retailers added 2.7 billion square feet of retail space as real household income fell. Sounds rational.

  • This decline in household income may have something to do with the labor participation rate plummeting to the lowest level since 1978. There are 247.4 million working age Americans and only 145.7 million of them employed (19 million part-time; 9 million self-employed; 20 million employed by the government). There are 92 million Americans, who according to the government have willingly left the workforce, up by 13.3 million since 2007 when over 146 million Americans were employed. You’d have to be a brainless twit to believe the unemployment rate is really 6.3% today. Retail sales would be booming if the unemployment rate was really that low.

  • With a 16.5% increase in working age Americans since 2000 and only a 6.5% increase in employed Americans, along with declining real household income, an inquisitive person might wonder how retail sales were able to grow from $3.3 trillion in 2000 to $5.1 trillion in 2013 – a 55% increase. You need to look no further than your friendly Too Big To Trust Wall Street banks for the answer. In the olden days of the 1970s and early 1980s Americans put 10% to 20% down to buy a house and then systematically built up equity by making their monthly payments. The Ivy League financial engineers created “exotic” (toxic) mortgage products requiring no money down, no principal payments, and no proof you could make a payment, in their control fraud scheme to fleece the American sheeple. Their propaganda machine convinced millions more to use their homes as an ATM, because home prices never drop. Just ask Ben Bernanke. Even after the Bernanke/Blackrock fake housing recovery (actual mortgage originations now at 1978 levels) household real estate percent equity is barely above 50%, well below the 70% levels before the Wall Street induced debt debacle. With the housing market about to head south again, the home equity ATM will have an Out of Order sign on it.

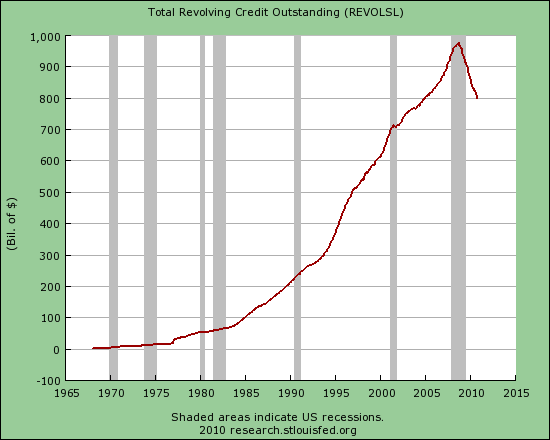
  • We hear the endless drivel from disingenuous Keynesian nitwits about government and consumer austerity being the cause of our stagnating economy. My definition of austerity would be an actual reduction in spending and debt accumulation. It seems during this time of austerity total credit market debt has RISEN from $53.5 trillion in 2009 to $59 trillion today. Not exactly austere, as the Federal government adds $2.2 billion PER DAY to the national debt, saddling future generations with the bill for our inability to confront reality. The American consumer has not retrenched, as the CNBC bimbos and bozos would have you believe. Consumer credit reached an all-time high of $3.14 trillion in March, up from $2.52 trillion in 2010. That doesn’t sound too austere to me. Of course, this increase is solely due to Obamanomics and Bernanke’s $3 trillion gift to his Wall Street owners. The doling out of $645 billion to subprime college “students” and subprime auto “buyers” since 2010 accounts for more than 100% of the increase. The losses on these asinine loans will be epic. Credit card debt has actually fallen as people realize it is their last lifeline. They are using credit cards to pay income taxes, real estate taxes, higher energy costs, higher food costs, and the other necessities of life.

The entire engineered “recovery” since 2009 has been nothing but a Federal Reserve/U.S. Treasury conceived, debt manufactured scam. These highly educated lackeys for the establishment have been tasked with keeping the U.S. Titanic afloat until the oligarchs can safely depart on the lifeboats with all the ship’s jewels safely stowed in their pockets. There has been no housing recovery. There has been no jobs recovery. There has been no auto sales recovery. Giving a vehicle to someone with a 580 credit score with a 0% seven year loan is not a sale. It’s a repossession in waiting. The government supplied student loans are going to functional illiterates who are majoring in texting, facebooking and twittering. Do you think these indebted University of Phoenix dropouts living in their parents’ basements are going to spur a housing and retail sales recovery? This Keynesian “solution” was designed to produce the appearance of recovery, convince the masses to resume their debt based consumption, and add more treasure into the vaults of the Wall Street banks.

The master plan has failed miserably in reviving the economy. Savings, capital investment, and debt reduction are the necessary ingredients for a sustained healthy economic system. Debt based personal consumption of cheap foreign produced baubles & gadgets, $1 trillion government deficits to sustain the warfare/welfare state, along with a corrupt political and rigged financial system are the explosive concoction which will blow our economic system sky high. Facts can be ignored. Media propaganda can convince the willfully ignorant to remain so. The Federal Reserve can buy every Treasury bond issued to fund an out of control government. But eventually reality will shatter the delusions of millions as the debt based Ponzi scheme will run out of dupes and collapse in a flaming heap.

The inevitable shuttering of at least 3 billion square feet of retail space is a certainty. The aging demographics of the U.S. population, dire economic situation of both young and old, and sheer lunacy of the retail expansion since 2000, guarantee a future of ghost malls, decaying weed infested empty parking lots, retailer bankruptcies, real estate developer bankruptcies, massive loan losses for the banking industry, and the loss of millions of retail jobs. Since I always look for a silver lining in a black cloud, I predict a bright future for the SPACE AVAILABLE and GOING OUT OF BUSINESS sign making companies.

TARGET PROFIT PLUNGES BY 46% – STOCK SOARS HIGHER

Here are the facts:

  • Target profit plunged by $441 million in the 4th quarter, 46% lower than last year.
  • Revenue plunged by $1.2 billion in the 4th quarter, 5.3% lower than last year.
  • US revenue plunged by $1.5 billion or 6.6% in the 4th quarter.
  • Comp store sales declined by 2.5%.
  • The CEO should be fired for gross negligence and incompetence.

The Wall Street Shysters are driving the stock 5% higher based on bullshit public relations crappola being spewed by the idiot CEO about 2014 being a much better year. Target is a joke. Don’t shop there. Fuck em.


Feb. 26, 2014, 7:32 a.m. EST

Target Reports Fourth Quarter and Full-Year 2013 Earnings

Fourth quarter Adjusted EPS of $1.30; full-year Adjusted EPS of $4.38Fourth quarter GAAP EPS of $0.81; full-year GAAP EPS of $3.07

MINNEAPOLIS, Feb 26, 2014 (BUSINESS WIRE) — Target Corporation /quotes/zigman/253872/delayed/quotes/nls/tgtTGT+4.96%:

Target Corporation /quotes/zigman/253872/delayed/quotes/nls/tgtTGT+4.96% today reported fourth quarter net earnings of $520 million, or $0.81 per share, and full-year net earnings of $1,971 million, or $3.07 per share. Dilution related to the Canadian Segment affected fourth quarter and full-year GAAP EPS by (40) cents and $(1.13), respectively. Adjusted earnings per share1 were $1.30 in fourth quarter 2013, down 21.2 percent from $1.65 in 2012. Full-year 2013 Adjusted EPS of $4.38 was down 8.0 percent from $4.76 in 2012. The tables attached to this press release provide a reconciliation of non-GAAP to GAAP measures. All earnings per share figures refer to diluted earnings per share.

“For more than 50 years Target has succeeded by focusing on our guests,” said Gregg Steinhafel, chairman, president and chief executive officer of Target Corporation. “During the first half of the fourth quarter, our guest-focused holiday merchandising and marketing plans drove better-than-expected sales. However, results softened meaningfully following our December announcement of a data breach. As we plan for the new fiscal year, we will continue to work tirelessly to win back the confidence of our guests and deliver irresistible merchandise and offers, and we are encouraged that sales trends have improved in recent weeks.”

1 Adjusted diluted earnings per share (“Adjusted EPS”), a non-GAAP financial measure, excludes the impact of certain matters not related to our routine retail operations, such as expenses related to the data breach and the reduction in the beneficial interest asset.

Fiscal 2014 Earnings Guidance

Fiscal 2014 will be Target’s first full year of operating stores in Canada. As a result, beginning with first quarter 2014, the company will no longer exclude Canadian Segment results from Adjusted EPS. For comparison purposes, prior year Adjusted EPS will also include Canadian Segment results.

In first quarter 2014, the Company expects Adjusted EPS of 60 cents to 75 cents, reflecting operating results in our U.S. and Canadian Segments. This measure excludes approximately (2) cents related to the expected reduction of the beneficial interest asset2, as well as any net expenses related to the data breach. For full-year 2014, Target expects Adjusted EPS of $3.85 to $4.15, reflecting operating results in our U.S. and Canadian Segments. This measure excludes approximately (7) cents related to the expected reduction of the beneficial interest asset2, as well as any net expenses related to the data breach.

At this time, the Company is not able to estimate future expenses related to the data breach. Expenses may include payments associated with potential claims by the payment card networks for alleged counterfeit fraud losses and non-ordinary course operating expenses (such as card re-issuance costs), REDcard fraud and card re-issuance expense, payments associated with civil litigation, governmental investigations and enforcement proceedings, expenses for legal, investigative and consulting fees, and incremental expenses and capital investments for remediation activities. These costs may have a material adverse effect on Target’s results of operations in first quarter and full-year 2014 and future periods.

2 See the “Accounting Considerations” section of this release for more information related to the beneficial interest asset.

U.S. Segment Results3

As a reminder, following the sale of the U.S. credit card portfolio in March 2013, Target’s historical U.S. Retail Segment and U.S. Credit Card Segment results were combined to form a new U.S. Segment. Selling, General and Administrative (SG&A) expenses in the new U.S. Segment include income from the profit-sharing arrangement with TD Bank Group, net of servicing expenses. The company classified historical U.S. Credit Card Segment revenues and expenses within U.S. Segment SG&A expenses.4

In fourth quarter 2013, sales decreased 6.6 percent to $20.9 billion from $22.4 billion last year, reflecting the impact of an additional accounting week in 20125 and a 2.5 percent decrease in comparable sales, partially offset by the contribution from new stores. Segment earnings before interest expense and income taxes (EBIT) were $1,413 million in fourth quarter 2013, a decrease of 22.4 percent from $1,821 million in 2012.

Fourth quarter EBITDA and EBIT margin rates were 9.2 percent and 6.8 percent, respectively, compared with 10.4 percent and 8.1 percent in the revised U.S. Segment in 2012. Fourth quarter gross margin rate was 27.6 percent compared with 27.8 percent in 2012, reflecting the impact of clearance markdowns combined with Target’s integrated growth strategies, partially offset by a 0.2 percentage-point benefit from changes to certain vendor agreements. Fourth quarter SG&A expense rate was 18.4 percent in 2013 compared with 17.3 percent in the revised U.S. Segment in 2012. This increase was driven by a smaller contribution from the credit card portfolio, which raised the SG&A rate by approximately 0.5 percentage points, the change to certain vendor agreements and the de-leveraging impact of softer-than-expected sales.

Full-year 2013 sales decreased 0.9 percent to $71.3 billion from $72.0 billion last year, reflecting the impact of an additional accounting week in 20125 and a 0.4 percent decrease in comparable sales, partially offset by the contribution from new stores. Full-year EBIT was $4,959 million in 2013, a decrease of 11.3 percent from $5,589 million in 2012.

Full-year 2013 EBITDA and EBIT margin rates were 9.8 percent and 7.0 percent, respectively, compared with 10.6 percent and 7.8 percent in the revised U.S. Segment in 2012. Full-year gross margin rate increased to 29.8 percent from 29.7 percent in 2012, reflecting category-level rate improvements and approximately 0.2 percentage-points of benefit from changes to certain vendor agreements, partially offset by incremental clearance markdowns and the impact of Target’s integrated growth strategies. Full-year 2013 SG&A expense rate was 20.0 percent, compared with 19.1 percent in the revised U.S. Segment in 2012. This increase was driven by a smaller contribution from the credit card portfolio, which raised the SG&A rate by approximately 0.5 percentage points, investments in technology and supply chain in support of multichannel initiatives and the change to certain vendor agreements.

3 See the “Non-Segment Impacts to Consolidated GAAP Earnings per Share” section of this release for information about certain expenses that were included in our Consolidated Statements of Operations as SG&A, but were not part of our U.S. Segment results.
4 Quarterly and full-year historical information for the three most recently completed years reflecting the impact of the reclassification, and the results for our two segments, U.S. and Canadian, are attached as Exhibit (99) to our current report on Form 8-K filed April 16, 2013.
5 The three- and twelve-month periods ended February 1, 2014 were 13- and 52-week periods, respectively, compared with 14- and 53- week periods ended February 2, 2013. The extra week is excluded from the comparable-sales calculation.

Canadian Segment Results

In fourth quarter 2013, the Canadian Segment generated sales of $623 million and EBIT of $(329) million. The fourth quarter gross margin rate of 4.4 percent reflects continued efforts to clear excess inventory. Canadian operations reduced fourth quarter GAAP EPS by (40) cents6.

During fiscal 2013, Target’s Canadian Segment generated sales of $1.3 billion at a gross margin rate of 14.9 percent and EBIT of $(941) million. Canadian operations reduced Target’s full-year 2013 GAAP EPS by $(1.13)6.

6 This amount includes interest expense and tax expense that are not included in the segment measure of profit. A reconciliation of non-GAAP financial measures is included in the tables attached to this release.

Non-Segment Impacts to Consolidated GAAP Earnings per Share

Target incurred charges in fourth quarter 2013 related to part-time team member health benefit changes, land impairments and workforce reductions. The combined effect of these charges increased fourth quarter Consolidated SG&A expense by approximately $64 million.

During fourth quarter 2013, Target experienced a data breach in which an intruder gained unauthorized access to our network and stole certain payment card and other guest information. The Company incurred $17 million of net expense in the fourth quarter, reflecting $61 million of total expenses partially offset by the recognition of a $44 million insurance receivable. These expenses include costs related to investigating the data breach, offering credit-monitoring and identity-theft protection services to our guests, increased staffing in our call centers, procurement of legal and other professional services, REDcard fraud losses and card replacement costs, and an accrual for a probable loss on payment card networks’ anticipated claims for operating expenses incurred as a result of the data breach. This accrual was based on an expectation of reaching negotiated settlements of the payment card networks’ potential claims for alleged non-ordinary course operating expenses associated with the data breach, and not on any determination that it is probable we would be found liable on these claims were they to be litigated. It does not include any amounts for the potential claims by the payment card networks for counterfeit fraud losses. At this time we are not able to reasonably estimate a range of possible losses on the payment card networks’ potential claims in excess of the amount accrued.

Interest Expense and Taxes

Target’s fourth quarter 2013 net interest expense decreased 21.2 percent to $161 million from $204 million in 2012, benefiting from debt retirement in first quarter 2013 resulting from the use of proceeds from the sale of the credit card portfolio. Full-year interest expense in 2013 increased to $1,126 million from $762 million in 2012, reflecting a $445 million charge related to the early retirement of debt in first quarter 2013, partially offset by the benefit from debt retirement resulting from the use of proceeds from the sale of the credit card portfolio.

The Company’s effective income tax rate was 37.0 percent in the fourth quarter, compared with 34.3 percent in fourth quarter 2012. The increase of 2.7 percentage points was driven by the net effect of increased losses related to Canadian operations partially offset by a higher year-over-year benefit from the favorable resolution of various income tax matters. Target’s full-year 2013 effective income tax rate was 36.5 percent, an increase of 1.6 percentage points from 34.9 percent in 2012, which was driven by the net effect of increased losses related to Canadian operations combined with a lower year-over-year benefit from the favorable resolution of various income tax matters.

Capital Returned to Shareholders

In fourth quarter 2013, the Company paid dividends of $272 million. Target did not repurchase any shares of its common stock during the quarter, reflecting current performance and the Company’s commitment to maintain its strong investment-grade credit ratings.

For full year 2013, Target returned more than 125 percent of net earnings to shareholders. In 2013, the company repurchased approximately 21.9 million shares of its common stock at an average price of $67.41 for a total investment of $1.47 billion, and paid dividends of $1.0 billion.

Accounting Considerations

At the close of the sale of its entire U.S. consumer credit card receivables portfolio to TD Bank Group in first quarter 2013, Target recognized a $225 million beneficial interest asset, which effectively represented a receivable for the present value of future profit-sharing Target expected to receive on the receivables sold. The Company estimates the asset will be reduced over the four-year period following the close of the transaction, with larger reductions in the early years. The beneficial interest asset was reduced in fourth quarter 2013 by $16 million and $98 million for the full year.

The Company’s fourth quarter and full-year 2012 GAAP earnings included pre-tax gains of $5 million and $161 million, respectively, associated with the agreement to sell the entire U.S. consumer credit card receivables portfolio to TD Bank Group. These gains are related to the accounting treatment of the consumer credit receivables as “held for sale” assets.

Miscellaneous

Target Corporation will webcast its fourth quarter earnings conference call at 9:30 a.m. CST today. Investors and the media are invited to listen to the call through the Company’s website at www.target.com/investors (click on “events & presentations”). A telephone replay of the call will be available beginning at approximately 11:30 a.m. CST today through the end of business on February 28, 2014. The replay number is (855) 859-2056 (passcode:78423307).

Statements in this release regarding first quarter and full-year 2014 earnings guidance and the impact of the data breach on the Company’s results of operations are forward-looking statements within the meaning of the Private Securities Litigation Reform Act of 1995. Such statements speak only as of the date they are made and are subject to risks and uncertainties which could cause the Company’s actual results to differ materially. The most important risks and uncertainties are described in Item 8.01 of the Company’s Form 8-K filed on February 26, 2014.

In addition to the GAAP results provided in this release, the Company provides Adjusted diluted earnings per share for the three- and twelve-month periods ended February 1, 2014 and February 2, 2013, respectively. This measure is not in accordance with, or an alternative for, generally accepted accounting principles in the United States. The most comparable GAAP measure is diluted earnings per share. Management believes Adjusted EPS is useful in providing period-to-period comparisons of the results of the Company’s U.S. operations. Adjusted EPS should not be considered in isolation or as a substitution for analysis of the Company’s results as reported under GAAP. Other companies may calculate Adjusted EPS differently than the Company does, limiting the usefulness of the measure for comparisons with other companies.

About Target

Minneapolis-based Target Corporation /quotes/zigman/253872/delayed/quotes/nls/tgtTGT+4.96% serves guests at 1,917 stores – 1,793 in the United States and 124 in Canada – and at Target.com. Since 1946, Target has given 5 percent of its profit through community grants and programs; today, that giving equals more than $4 million a week. For more information about Target’s commitment to corporate responsibility, visit target.com/corporateresponsibility.

TARGET CORPORATION
Consolidated Statements of Operations
Three Months Ended (a) Twelve Months Ended (a)
(millions, except per share data) (unaudited) February 1, 2014 February 2, 2013 Change February 1, 2014 February 2, 2013 Change
Sales $ 21,516 $ 22,370 (3.8 )% $ 72,596 $ 71,960 0.9 %
Credit card revenues 356 (100.0 ) 1,341 (100.0 )
Total revenues 21,516 22,726 (5.3 ) 72,596 73,301 (1.0 )
Cost of sales 15,719 16,160 (2.7 ) 51,160 50,568 1.2
Selling, general and administrative expenses 4,235 4,229 0.1 15,375 14,914 3.1
Credit card expenses 135 (100.0 ) 467 (100.0 )
Depreciation and amortization 576 539 6.8 2,223 2,142 3.8
Gain on receivables transaction (5 ) (100.0 ) (391 ) (161 ) 142.0
Earnings before interest expense and income taxes 986 1,668 (40.9 ) 4,229 5,371 (21.3 )
Net interest expense 161 204 (21.2 ) 1,126 762 47.7
Earnings before income taxes 825 1,464 (43.6 ) 3,103 4,609 (32.7 )
Provision for income taxes 305 503 (39.2 ) 1,132 1,610 (29.6 )
Net earnings $ 520 $ 961 (46.0 )% $ 1,971 $ 2,999 (34.3 )%
Basic earnings per share $ 0.82 $ 1.48 (44.5 )% $ 3.10 $ 4.57 (32.1 )%
Diluted earnings per share $ 0.81 $ 1.47 (44.5 )% $ 3.07 $ 4.52 (32.1 )%
Weighted average common shares outstanding
Basic 632.3 648.8 (2.6 )% 635.1 656.7 (3.3 )%
Dilutive impact of share-based awards(b) 5.8 7.0 6.7 6.6
Diluted 638.1 655.8 (2.7 )% 641.8 663.3 (3.3 )%
(a) The three and twelve months ended February 1, 2014 consisted of 13 weeks and 52 weeks, respectively, compared with 14 weeks and 53 weeks in the comparable prior-year periods.
(b) Excludes 2.5 million and 2.3 million share-based awards for the three and twelve months ended February 1, 2014, respectively, and 1.9 million and 5.0 million share-based awards for the three and twelve months ended February 2, 2013, respectively, because their effects were antidilutive.
Subject to reclassification
TARGET CORPORATION
Consolidated Statements of Financial Position
(millions) February 1, 2014 February 2, 2013
(unaudited)
Assets
Cash and cash equivalents, including short-term investments of $3 and $130 $ 695 $ 784
Inventory 8,766 7,903
Other current assets 2,112 1,860
Credit card receivables, held for sale 5,841
Total current assets 11,573 16,388
Property and equipment
Land 6,234 6,206
Buildings and improvements 30,356 28,653
Fixtures and equipment 5,583 5,362
Computer hardware and software 2,764 2,567
Construction-in-progress 843 1,176
Accumulated depreciation (14,402 ) (13,311 )
Property and equipment, net 31,378 30,653
Other noncurrent assets 1,602 1,122
Total assets $ 44,553 $ 48,163
Liabilities and shareholders’ investment
Accounts payable $ 7,683 $ 7,056
Accrued and other current liabilities 3,934 3,981
Current portion of long-term debt and other borrowings 1,160 2,994
Total current liabilities 12,777 14,031
Long-term debt and other borrowings 12,622 14,654
Deferred income taxes 1,433 1,311
Other noncurrent liabilities 1,490 1,609
Total noncurrent liabilities 15,545 17,574
Shareholders’ investment
Common stock 53 54
Additional paid-in capital 4,470 3,925
Retained earnings 12,599 13,155
Accumulated other comprehensive loss
Pension and other benefit liabilities (422 ) (532 )
Currency translation adjustment and cash flow hedges (469 ) (44 )
Total shareholders’ investment 16,231 16,558
Total liabilities and shareholders’ investment $ 44,553 $ 48,163

Common Stock Authorized 6,000,000,000 shares, $.0833 par value; 632,930,740 and 645,294,423 shares issued and outstanding at February 1, 2014 and February 2, 2013, respectively.

Preferred Stock Authorized 5,000,000 shares, $.01 par value; no shares were issued or outstanding at February 1, 2014 or February 2, 2013.

Subject to reclassification

TARGET CORPORATION
Consolidated Statements of Cash Flows
Twelve Months Ended
(millions) (unaudited) February 1, 2014 February 2, 2013
Operating activities
Net earnings $ 1,971 $ 2,999
Adjustments to reconcile net earnings to cash provided by operations
Depreciation and amortization 2,223 2,142
Share-based compensation expense 110 105
Deferred income taxes (254 ) (14 )
Bad debt expense(a) 41 206
Gain on receivables transaction (391 ) (161 )
Loss on debt extinguishment 445
Noncash losses/(gains) and other, net 82 14
Changes in operating accounts:
Accounts receivable originated at Target 157 (217 )
Proceeds on sale of accounts receivable originated at Target 2,703
Inventory (885 ) 15
Other current assets (267 ) (123 )
Other noncurrent assets 19 (98 )
Accounts payable 625 199
Accrued and other current liabilities (9 ) 138
Other noncurrent liabilities (50 ) 120
Cash provided by operations 6,520 5,325
Investing activities
Expenditures for property and equipment (3,453 ) (3,277 )
Proceeds from disposal of property and equipment 86 66
Change in accounts receivable originated at third parties 121 254
Proceeds from sale of accounts receivable originated at third parties 3,002
Cash paid for acquisitions, net of cash assumed (157 )
Other investments 130 102
Cash provided by/(required for) investing activities (271 ) (2,855 )
Financing activities
Change in commercial paper, net (890 ) 970
Reductions of short-term debt (1,500 )
Additions to long-term debt 1,971
Reductions of long-term debt (3,463 ) (1,529 )
Dividends paid (1,006 ) (869 )
Repurchase of stock (1,461 ) (1,875 )
Stock option exercises and related tax benefit 456 360
Other (16 )
Cash required for financing activities (6,364 ) (2,488 )
Effect of exchange rate changes on cash and cash equivalents 26 8
Net (decrease)/increase in cash and cash equivalents (89 ) (10 )
Cash and cash equivalents at beginning of period 784 794
Cash and cash equivalents at end of period $ 695 $ 784
(a) Includes net write-offs of credit card receivables prior to the sale of receivables on March 13, 2013, and bad debt expense on credit card receivables during the twelve months ended February 2, 2013.
Subject to reclassification
TARGET CORPORATION
U.S. Segment
Three Months Ended (a) Twelve Months Ended (a)
(millions) (unaudited) February 1, 2014 February 2, 2013 Change February 1, 2014 February 2, 2013 Change
Sales $ 20,893 $ 22,370 (6.6 )% $ 71,279 $ 71,960 (0.9 )%
Cost of sales 15,124 16,160 (6.4 ) 50,039 50,568 (1.0 )
Gross margin 5,769 6,210 (7.1 ) 21,240 21,392 (0.7 )
SG&A expenses(b) 3,848 3,881 (0.8 ) 14,285 13,759 3.8
EBITDA 1,921 2,329 (17.5 ) 6,955 7,633 (8.9 )
Depreciation and amortization 508 508 (0.1 ) 1,996 2,044 (2.4 )
EBIT $ 1,413 $ 1,821 (22.4 )% $ 4,959 $ 5,589 (11.3 )%
Note: Prior period results have been revised to reflect the combination of our historical U.S. Retail Segment and U.S. Credit Card Segment into one U.S. Segment.
(a)The three and twelve months ended February 1, 2014 consisted of 13 weeks and 52 weeks, respectively, compared with 14 weeks and 53 weeks in the comparable prior-year periods.
(b) SG&A includes credit card revenues and expenses for all periods presented prior to the March 2013 sale of our U.S. consumer credit card portfolio to TD Bank. For the three and twelve months ended February 1, 2014, SG&A also includes $182 million and $653 million, respectively, of profit sharing income from the arrangement with TD Bank.
EBITDA is earnings before interest expense, income taxes, depreciation and amortization.
EBIT is earnings before interest expense and income taxes.
Three Months Ended February 2, 2013 2013 U.S. Segment Change vs. 2012
(unaudited) Three MonthsEndedFebruary 1,2014 U.S. Segment,as revised Impact ofHistorical U.S.Credit CardSegment(a) HistoricalU.S. RetailSegment U.S. Segment,as revised HistoricalU.S. RetailSegment
Gross margin rate 27.6 % 27.8 % pp 27.8 % (0.2 )pp (0.2 )pp
SG&A expense rate 18.4 17.3 (0.7 ) 18.0 1.1 0.4
EBITDA margin rate 9.2 10.4 0.6 9.8 (1.2 ) (0.6 )
Depreciation and amortization expense rate 2.4 2.3 2.3 0.1 0.1
EBIT margin rate 6.8 8.1 0.6 7.5 (1.3 ) (0.7 )
Twelve Months Ended February 2, 2013 2013 U.S. Segment Change vs. 2012
(unaudited) Twelve MonthsEndedFebruary 1,2014 U.S. Segment,as revised Impact ofHistorical U.S.Credit CardSegment(a) HistoricalU.S. RetailSegment U.S. Segment,as revised HistoricalU.S. RetailSegment
Gross margin rate 29.8 % 29.7 % pp 29.7 % 0.1 pp 0.1 pp
SG&A expense rate 20.0 19.1 (0.8 ) 19.9 0.9 0.1
EBITDA margin rate 9.8 10.6 0.8 9.8 (0.8 )
Depreciation and amortization expense rate 2.8 2.8 2.8
EBIT margin rate 7.0 7.8 0.8 7.0 (0.8 )
Rate analysis metrics are computed by dividing the applicable amount by sales.
(a) Represents the impact of combining the historical U.S. Credit Card Segment and the U.S. Retail Segment into one U.S. Segment. Compared with the historical U.S. Retail Segment results for the same period, segment results, as revised, reflect lower SG&A rates and increased EBIT and EBITDA margin rates resulting from the inclusion of credit card profits, net of expenses, within SG&A compared with historical U.S. Segment results for the same period.
Three Months Ended Twelve Months Ended
(unaudited) February 1, 2014 February 2, 2013 February 1, 2014 February 2, 2013
Comparable sales change (2.5 )% 0.4 % (0.4 )% 2.7 %
Drivers of change in comparable sales:
Number of transactions (5.5 ) (1.0 ) (2.7 ) 0.5
Average transaction amount 3.2 1.4 2.3 2.3
Selling price per unit 2.0 0.6 1.6 1.3
Units per transaction 1.1 0.7 0.7 1.0
The comparable sales increases or decreases above are calculated by comparing sales in fiscal year periods with comparable prior-year periods of equivalent length.
Three Months Ended Twelve Months Ended
(unaudited) February 1, 2014 February 2, 2013 February 1, 2014 February 2, 2013
Target Credit Cards 10.0 % 8.5 % 9.3 % 7.9 %
Target Debit Card 10.9 7.0 9.9 5.7
Total REDcard Penetration 20.9 % 15.5 % 19.3 % 13.6 %
Represents the percentage of Target sales that are paid with REDcards.
Number of Stores Retail Square Feet(a)
(unaudited) February 1, 2014 February 2, 2013 February 1, 2014 February 2, 2013
General merchandise stores 289 391 33,843 46,584
Expanded food assortment stores 1,245 1,131 160,891 146,249
SuperTarget stores 251 251 44,500 44,500
CityTarget stores 8 5 820 514
Total 1,793 1,778 240,054 237,847
(a) In thousands: reflects total square feet, less office, distribution center and vacant space.
Subject to reclassification
TARGET CORPORATION
Canadian Segment
Three Months Ended (a) Twelve Months Ended (a)
(millions)(unaudited) February 1, 2014 February 2, 2013 Change February 1, 2014 February 2, 2013 Change
Sales $ 623 $ n/a % $ 1,317 $ n/a %
Cost of sales 596 n/a 1,121 n/a
Gross margin 27 n/a 196 n/a
SG&A expenses(b) 289 118 144.8 910 272 234.9
EBITDA (262 ) (118 ) 121.7 (714 ) (272 ) 162.6
Depreciation and amortization(c) 67 30 122.1 227 97 133.6
EBIT $ (329 ) $ (148 ) 121.8 % $ (941 ) $ (369 ) 155.0 %
(a) The three and twelve months ended February 1, 2014 consisted of 13 weeks and 52 weeks, respectively, compared with 14 weeks and 53 weeks in the comparable prior-year periods.
(b)SG&A expenses include start-up and operating expenses.
(c) Depreciation and amortization results from depreciation of capital lease assets and leasehold interests. The lease payment obligation gave rise to interest expense of $18 million and $20 million for the three months ended February 1, 2014 and February 2, 2013, respectively, and $77 million and $78 million of interest expense for the twelve months ended February 1, 2014 and February 2, 2013, respectively.
Canadian Segment Rate Analysis(unaudited) Three Months EndedFebruary 1, 2014 Twelve Months EndedFebruary 1, 2014
Gross margin rate 4.4 % 14.9 %
SG&A expense rate 46.4 69.1
EBITDA margin rate (42.0 ) (54.2 )
Depreciation and amortization expense rate 10.8 17.3
EBIT margin rate (52.8 ) (71.5 )
REDcard Penetration(unaudited) Three Months EndedFebruary 1, 2014 Twelve Months EndedFebruary 1, 2014
Target Credit Cards 1.6 % 1.4 %
Target Debit Card 1.7 1.5
Total REDcard Penetration 3.2 % 2.9 %
Represents the percentage of Target sales that are paid with REDcards.
Number of Stores Retail Square Feet(a)
Number of Stores and Retail Square Feet(unaudited) February 1, 2014 February 2, 2013 February 1, 2014 February 2, 2013
General merchandise stores 124 14,189
(a) In thousands; reflects total square feet, less office, distribution center and vacant space.
Subject to reclassification
TARGET CORPORATION
Reconciliation of Non-GAAP Financial Measures
Three Months Ended Twelve Months Ended
February 1, February 2, February 1, February 2,
(unaudited) 2014 2013 Change 2014 2013 Change
GAAP diluted earnings per share $ 0.81 $ 1.47 (44.5 )% $ 3.07 $ 4.52 (32.1 )%
Adjustments 0.49 0.18 1.31 0.24
Adjusted diluted earnings per share $ 1.30 $ 1.65 (21.2 )% $ 4.38 $ 4.76 (8.0 )%
Note: We have disclosed adjusted diluted earnings per share (“Adjusted EPS”), a non-GAAP financial measure, which excludes the impact of certain matters not related to our routine retail operations, including the impact of our Canadian market entry. Management believes that Adjusted EPS is meaningful in order to provide period-to-period comparisons of our operating results. A detailed reconciliation is provided below.
Three Months Ended February 1, 2014 Three Months Ended February 2, 2013
(millions, except per share data) (unaudited) Adjustments Adjustment pershare Adjustments Adjustment pershare
Total Canadian losses (a) $ 253 $ 0.40 $ 117 $ 0.18
Gain on receivables transaction (b) 4
Reduction of beneficial interest asset 16 0.02
Other (c) 64 0.06
Data Breach related costs, net of insurance receivable (d) 17 0.02
Resolution of income tax matters (6 ) (0.01 ) (2 )
Total adjustments $ 0.49 $ 0.18
Twelve Months Ended February 1, 2014 Twelve Months Ended February 2, 2013
(millions, except per share data) (unaudited) Adjustments Adjustment pershare Adjustments Adjustment pershare
Total Canadian losses (a) $ 723 $ 1.13 $ 315 $ 0.48
Loss on early retirement of debt 445 0.42
Gain on receivables transaction (b) (391 ) (0.38 ) (152 ) (0.15 )
Reduction of beneficial interest asset 98 0.09
Other (c) 64 0.06
Data Breach related costs, net of insurance receivable (d) 17 0.02
Resolution of income tax matters (16 ) (0.03 ) (58 ) (0.09 )
Total adjustments $ 1.31 $ 0.24
Note: With the exception of total Canadian losses, resolution of income tax matters and per share data, all adjustments exclude taxes. The sum of the non-GAAP adjustments may not equal the total adjustment amounts due to rounding.
(a)Total Canadian losses include interest expense of $18 and $20 million for the three months ended February 1, 2014 and February 2, 2013, respectively, and $77 million and $78 million for the twelve months ended February 1, 2014 and February 2, 2013. Total Canadian losses also include taxes allocated to the Canadian Segment based on income tax rates applicable to the operations of the Segment for the period. Tax benefits were $95 million and $51 million for the three months ended February 1, 2014 and February 2, 2013, respectively, and $295 million and $132 million for the twelve months ended February 1, 2014 and February 2, 2013.
(b) 2013 adjustment represents consideration received in the first quarter from the sale of our U.S. credit card receivables in excess of the recorded amount of the receivables. Consideration included a beneficial interest asset of $225 million. The 2012 adjustment represents the gain on receivables held for sale.
(c) For the three and twelve months ended, February 2, 2013, other items included a $23 million workforce-reduction charge primarily related to severance and benefits costs, a $22 million charge related to part-time team member health benefit changes, and $19 million in impairment charges related to certain parcels of undeveloped land.
(d) For the three and twelve months ended, February 2, 2013, we recorded $61 million of pretax Data Breach-related expenses, and expected insurance proceeds of $44 million, for net expenses of $17 million.
Subject to reclassification

SOURCE: Target Corporation

THE RETAIL DEATH RATTLE

“I was part of that strange race of people aptly described as spending their lives doing things they detest, to make money they don’t want, to buy things they don’t need, to impress people they don’t like.”Emile Gauvreau

If ever a chart provided unequivocal proof the economic recovery storyline is a fraud, the one below is the smoking gun. November and December retail sales account for 20% to 40% of annual retail sales for most retailers. The number of visits to retail stores has plummeted by 50% since 2010. Please note this was during a supposed economic recovery. Also note consumer spending accounts for 70% of GDP. Also note credit card debt outstanding is 7% lower than its level in 2010 and 16% below its peak in 2008. Retailers like J.C. Penney, Best Buy, Sears, Radio Shack and Barnes & Noble continue to report appalling sales and profit results, along with listings of store closings. Even the heavyweights like Wal-Mart and Target continue to report negative comp store sales. How can the government and mainstream media be reporting an economic recovery when the industry that accounts for 70% of GDP is in free fall? The answer is that 99% of America has not had an economic recovery. Only Bernanke’s 1% owner class have benefited from his QE/ZIRP induced stock market levitation.

Source: WSJ

The entire economic recovery storyline is a sham built upon easy money funneled by the Fed to the Too Big To Trust Wall Street banks so they can use their HFT supercomputers to drive the stock market higher, buy up the millions of homes they foreclosed upon to artificially drive up home prices, and generate profits through rigging commodity, currency, and bond markets, while reducing loan loss reserves because they are free to value their toxic assets at anything they please – compliments of the spineless nerds at the FASB. GDP has been artificially propped up by the Federal government through the magic of EBT cards, SSDI for the depressed and downtrodden, never ending extensions of unemployment benefits, billions in student loans to University of Phoenix prodigies, and subprime auto loans to deadbeats from the Government Motors financing arm – Ally Financial (85% owned by you the taxpayer). The country is being kept afloat on an ocean of debt and delusional belief in the power of central bankers to steer this ship through a sea of icebergs just below the surface.

The absolute collapse in retail visitor counts is the warning siren that this country is about to collide with the reality Americans have run out of time, money, jobs, and illusions. The most amazingly delusional aspect to the chart above is retailers continued to add 44 million square feet in 2013 to the almost 15 billion existing square feet of retail space in the U.S. That is approximately 47 square feet of retail space for every person in America. Retail CEOs are not the brightest bulbs in the sale bin, as exhibited by the CEO of Target and his gross malfeasance in protecting his customers’ personal financial information. Of course, the 44 million square feet added in 2013 is down 85% from the annual increases from 2000 through 2008. The exponential growth model, built upon a never ending flow of consumer credit and an endless supply of cheap fuel, has reached its limit of growth. The titans of Wall Street and their puppets in Washington D.C. have wrung every drop of faux wealth from the dying middle class. There are nothing left but withering carcasses and bleached bones.

The impact of this retail death spiral will be vast and far reaching. A few factoids will help you understand the coming calamity:

  • There are approximately 109,500 shopping centers in the United States ranging in size from the small convenience centers to the large super-regional malls.
  • There are in excess of 1 million retail establishments in the United States occupying 15 billion square feet of space and generating over $4.4 trillion of annual sales. This includes 8,700 department stores, 160,000 clothing & accessory stores, and 8,600 game stores.
  • U.S. shopping-center retail sales total more than $2.26 trillion, accounting for over half of all retail sales.
  • The U.S. shopping-center industry directly employed over 12 million people in 2010 and indirectly generated another 5.6 million jobs in support industries. Collectively, the industry accounted for 12.7% of total U.S. employment.
  • Total retail employment in 2012 totaled 14.9 million, lower than the 15.1 million employed in 2002.
  • For every 100 individuals directly employed at a U.S. regional shopping center, an additional 20 to 30 jobs are supported in the community due to multiplier effects.

The collapse in foot traffic to the 109,500 shopping centers that crisscross our suburban sprawl paradise of plenty is irreversible. No amount of marketing propaganda, 50% off sales, or hot new iGadgets is going to spur a dramatic turnaround. Quarter after quarter there will be more announcements of store closings. Macys just announced the closing of 5 stores and firing of 2,500 retail workers. JC Penney just announced the closing of 33 stores and firing of 2,000 retail workers. Announcements are imminent from Sears, Radio Shack and a slew of other retailers who are beginning to see the writing on the wall. The vacancy rate will be rising in strip malls, power malls and regional malls, with the largest growing sector being ghost malls. Before long it will appear that SPACE AVAILABLE is the fastest growing retailer in America.

The reason this death spiral cannot be reversed is simply a matter of arithmetic and demographics. While arrogant hubristic retail CEOs of public big box mega-retailers added 2.7 billion retail square feet to our already over saturated market, real median household income flat lined. The advancement in retail spending was attributable solely to the $1.1 trillion increase (68%) in consumer debt and the trillion dollars of home equity extracted from castles in the sky, that later crashed down to earth. Once the Wall Street created fraud collapsed and the waves of delusion subsided, retailers have been revealed to be swimming naked. Their relentless expansion, based on exponential growth, cannibalized itself, new store construction ground to a halt, sales and profits have declined, and the inevitable closing of thousands of stores has begun. With real median household income 8% lower than it was in 2008, the collapse in retail traffic is a rational reaction by the impoverished 99%. Americans are using their credit cards to pay their real estate taxes, income taxes, and monthly utilities, since their income is lower, and their living expenses rise relentlessly, thanks to Bernanke and his Fed created inflation.

The media mouthpieces for the establishment gloss over the fact average gasoline prices in 2013 were the second highest in history. The highest average price was in 2012 and the 3rd highest average price was in 2011. These prices are 150% higher than prices in the early 2000’s. This might not matter to the likes of Jamie Dimon and Jon Corzine, but for a middle class family with two parents working and making 7.5% less than they made in 2000, it has a dramatic impact on discretionary income. The fact oil prices have risen from $25 per barrel in 2003 to $100 per barrel today has not only impacted gas prices, but utility costs, food costs, and the price of any product that needs to be transported to your local Wally World. The outrageous rise in tuition prices has been aided and abetted by the Federal government and their doling out of loans so diploma mills like the University of Phoenix can bilk clueless dupes into thinking they are on their way to an exciting new career, while leaving them jobless in their parents’ basement with a loan payment for life.


The laughable jobs recovery touted by Obama, his sycophantic minions, paid off economist shills, and the discredited corporate legacy media can be viewed appropriately in the following two charts, that reveal the false storyline being peddled to the techno-narcissistic iGadget distracted masses. There are 247 million working age Americans between the ages of 18 and 64. Only 145 million of these people are employed. Of these employed, 19 million are working part-time and 9 million are self- employed. Another 20 million are employed by the government, producing nothing and being sustained by the few remaining producers with their tax dollars. The labor participation rate is the lowest it has been since women entered the workforce in large numbers during the 1980’s. We are back to levels seen during the booming Carter years. Those peddling the drivel about retiring Baby Boomers causing the decline in the labor participation rate are either math challenged or willfully ignorant because they are being paid to be so. Once you turn 65 you are no longer counted in the work force. The percentage of those over 55 in the workforce has risen dramatically to an all-time high, as the Me Generation never saved for retirement or saw their retirement savings obliterated in the Wall Street created 2008 financial implosion.

To understand the absolute idiocy of retail CEOs across the land one must parse the employment data back to 2000. In the year 2000 the working age population of the U.S. was 213 million and 136.9 million of them were working, a record level of 64.4% of the population. There were 70 million working age Americans not in the labor force. Fourteen years later the number of working age Americans is 247 million and only 144.6 million are working. The working age population has risen by 16% and the number of employed has risen by only 5.6%. That’s quite a success story. Of course, even though median household income is 7.5% lower than it was in 2000, the government expects you to believe that 22 million Americans voluntarily left the labor force because they no longer needed a job. While the number of employed grew by 5.6% over fourteen years, the number of people who left the workforce grew by 31.1%. Over this same time frame the mega-retailers that dominate the landscape added almost 3 billion square feet of selling space, a 25% increase. A critical thinking individual might wonder how this could possibly end well for the retail genius CEOs in glistening corporate office towers from coast to coast.

This entire materialistic orgy of consumerism has been sustained solely with debt peddled by the Wall Street banking syndicate. The average American consumer met their Waterloo in 2008. Bernanke’s mission was to save bankers, billionaires and politicians. It was not to save the working middle class. You’ve been sacrificed at the altar of the .1%. The 0% interest rates were for Jamie Dimon and Lloyd Blankfein. Your credit card interest rate remained between 13% and 21%. So, while you struggle to pay bills with your declining real income, the Wall Street bankers are again generating record profits and paying themselves record bonuses. Profits are so good, they can afford to pay tens of billions in fines for their criminal acts, and still be left with billions to divvy up among their non-prosecuted criminal executives.

Bernanke and his financial elite owners have been able to rig the markets to give the appearance of normalcy, but they cannot rig the demographic time bomb that will cause the death and destruction of our illusory retail paradigm. Demographics cannot be manipulated or altered by the government or mass media. The best they can do is ignore or lie about the facts. The life cycle of a human being is utterly predictable, along with their habits across time. Those under 25 years old have very little income, therefore they have very little spending. Once a job is attained and income levels rise, spending rises along with the increased income. As the person enters old age their income declines and spending on stuff declines rapidly. The media may be ignoring the fact that annual expenditures drop by 40% for those over 65 years old from the peak spending years of 45 to 54, but it doesn’t change the fact. They also cannot change the fact that 10,000 Americans will turn 65 every day for the next sixteen years. They also can’t change the fact the average Baby Boomer has less than $50,000 saved for retirement and is up to their grey eye brows in debt.

With over 15% of all 25 to 34 year olds living in their parents’ basement and those under 25 saddled with billions in student loan debt, the traditional increase in income and spending is DOA for the millennial generation. The hardest hit demographic on the job front during the 2008 through 2014 ongoing recession has been the 45 to 54 year olds in their peak earning and spending years. Combine these demographic developments and you’ve got a perfect storm for over-built retailers and their egotistical CEOs.

The media continues to peddle the storyline of on-line sales saving the ancient bricks and mortar retailers. Again, the talking head pundits are willfully ignoring basic math. On-line sales account for 6% of total retail sales. If a dying behemoth like JC Penney announces a 20% decline in same store sales and a 20% increase in on-line sales, their total change is still negative 17.6%. And they are still left with 1,100 decaying stores, 100,000 employees, lease payments, debt payments, maintenance costs, utility costs, inventory costs, and pension costs. Their future is so bright they gotta wear a toe tag.

The decades of mal-investment in retail stores was enabled by Greenspan, Bernanke, and their Federal Reserve brethren. Their easy money policies enabled Americans to live far beyond their true means through credit card debt, auto debt, mortgage debt, and home equity debt. This false illusion of wealth and foolish spending led mega-retailers to ignore facts and spread like locusts across the suburban countryside. The debt fueled orgy has run out of steam. All that is left is the largest mountain of debt in human history, a gutted and debt laden former middle class, and thousands of empty stores in future decaying ghost malls haunting the highways and byways of suburbia.

The implications of this long and winding road to ruin are far reaching. Store closings so far have only been a ripple compared to the tsunami coming to right size the industry for a future of declining spending. Over the next five to ten years, tens of thousands of stores will be shuttered. Companies like JC Penney, Sears and Radio Shack will go bankrupt and become historical footnotes. Considering retail employment is lower today than it was in 2002 before the massive retail expansion, the future will see in excess of 1 million retail workers lose their jobs. Bernanke and the Feds have allowed real estate mall owners to roll over non-performing loans and pretend they are generating enough rental income to cover their loan obligations. As more stores go dark, this little game of extend and pretend will come to an end. Real estate developers will be going belly-up and the banking sector will be taking huge losses again. I’m sure the remaining taxpayers will gladly bailout Wall Street again. The facts are not debatable. They can be ignored by the politicians, Ivy League economists, media talking heads, and the willfully ignorant masses, but they do not cease to exist.

“Facts do not cease to exist because they are ignored.”Aldous Huxley

ARE YOU SEEING WHAT I’M SEEING?

Is it just me, or are the signs of consumer collapse as clear as a Lowes parking lot on a Saturday afternoon? Sometimes I wonder if I’m just seeing the world through my pessimistic lens, skewing my point of view. My daily commute through West Philadelphia is not very enlightening, as the squalor, filth and lack of legal commerce remain consistent from year to year. This community is sustained by taxpayer subsidized low income housing, taxpayer subsidized food stamps, welfare payments, and illegal drug dealing. The dependency attitude, lifestyles of slothfulness and total lack of commerce has remained constant for decades in West Philly. It is on the weekends, cruising around a once thriving suburbia, where you perceive the persistent deterioration and decay of our debt fixated consumer spending based society.

The last two weekends I’ve needed to travel the highways of Montgomery County, PA going to a family party and purchasing a garbage disposal for my sink at my local Lowes store. Montgomery County is the typical white upper middle class suburb, with tracts of McMansions dotting the landscape. The population of 800,000 is spread over a 500 square mile area. Over 81% of the population is white, with the 9% black population confined to the urban enclaves of Norristown and Pottstown.

The median age is 38 and the median household income is $75,000, 50% above the national average. The employers are well diversified with an even distribution between education, health care, manufacturing, retail, professional services, finance and real estate. The median home price is $300,000, also 50% above the national average. The county leans Democrat, with Obama winning 60% of the vote in 2008. The 300,000 households were occupied by college educated white collar professionals. From a strictly demographic standpoint, Montgomery County appears to be a prosperous flourishing community where the residents are living lives of relative affluence. But, if you look closer and connect the dots, you see fissures in this façade of affluence that spread more expansively by the day. The cheap oil based, automobile dependent, mall centric, suburban sprawl, sanctuary of consumerism lifestyle is showing distinct signs of erosion. The clues are there for all to see and portend a bleak future for those mentally trapped in the delusions of a debt dependent suburban oasis of retail outlets, chain restaurants, office parks and enclaves of cookie cutter McMansions. An unsustainable paradigm can’t be sustained.

The first weekend had me driving along Ridge Pike, from Collegeville to Pottstown. Ridge Pike is a meandering two lane road that extends from Philadelphia, winds through Conshohocken, Plymouth Meeting, Norristown, past Ursinus College in Collegeville, to the farthest reaches of Montgomery County, at least 50 miles in length. It served as a main artery prior to the introduction of the interstates and superhighways that now connect the larger cities in eastern PA. Except for morning and evening rush hours, this road is fairly sedate. Like many primary routes in suburbia, the landscape is engulfed by strip malls, gas stations, automobile dealerships, office buildings, fast food joints, once thriving manufacturing facilities sitting vacant and older homes that preceded the proliferation of cookie cutter communities that now dominate what was once farmland.

Telltale Signs


I should probably be keeping my eyes on the road, but I can’t help but notice the telltale signs of an economic system gone haywire. As you drive along, the number of For Sale signs in front of homes stands out. When you consider how bad the housing market has been, the 40% decline in national home prices since 2007, the 30% of home dwellers underwater on their mortgage, and declining household income, you realize how desperate a home seller must be to try and unload a home in this market. The reality of the number of For Sale signs does not match the rhetoric coming from the NAR, government mouthpieces, CNBC pundits, and other housing recovery shills about record low inventory and home price increases.

The Federal Reserve/Wall Street/U.S. Treasury charade of foreclosure delaying tactics and selling thousands of properties in bulk to their crony capitalist buddies at a discount is designed to misinform the public. My local paper lists foreclosures in the community every Monday morning. In 2009 it would extend for four full pages. Today, it still extends four full pages. The fact that Wall Street bankers have criminally forged mortgage documents, people are living in houses for two years without making mortgage payments, and the Federal Government backing 97% of all mortgages while encouraging 3.5% down financing does not constitute a true housing recovery. Show me the housing recovery in these charts.

Existing home sales are at 1998 levels, with 45 million more people living in the country today.

New single family homes under construction are below levels in 1969, when there were 112 million less people in the country.

Another observation that can be made as you cruise through this suburban mecca of malaise is the overall decay of the infrastructure, appearances and disinterest or inability to maintain properties. The roadways are potholed with fading traffic lines, utility poles leaning and rotting, and signage corroding and antiquated. Houses are missing roof tiles, siding is cracked, gutters astray, porches sagging, windows cracked, a paint brush hasn’t been utilized in decades, and yards are inundated with debris and weeds. Not every house looks this way, but far more than you would think when viewing the overall demographics for Montgomery County. You wonder how many number among the 10 million vacant houses in the country today. The number of dilapidated run down properties paints a picture of the silent, barely perceptible Depression that grips the country today. With such little sense of community in the suburbs, most people don’t even know their neighbors. With the electronic transfer of food stamps, unemployment compensation, and other welfare benefits you would never know that your neighbor is unemployed and hasn’t made the mortgage payment on his house in 30 months. The corporate fascist ruling plutocracy uses their propaganda mouthpieces in the mainstream corporate media and government agency drones to misinform and obscure the truth, but the data and anecdotal observational evidence reveal the true nature of our societal implosion.

A report by the Census Bureau this past week inadvertently reveals data that confirms my observations on the roadways of my suburban existence. Annual household income fell in 2011 for the fourth straight year, to an inflation-adjusted $50,054. The median income — meaning half earned more, half less — now stands 8.9% lower than the all-time peak of $54,932 in 1999. It is far worse than even that dreadful result. Real median household income is lower than it was in 1989. When you understand that real household income hasn’t risen in 23 years, you can connect the dots with the decay and deterioration of properties in suburbia. A vast swath of Americans cannot afford to maintain their residences. If the choice is feeding your kids and keeping the heat on versus repairing the porch, replacing the windows or getting a new roof, the only option is survival.

US GDP vs. Median Household Income

All races have seen their income fall, with educational achievement reflected in the much higher incomes of Whites and Asians. It is interesting to note that after a 45 year War on Poverty the median household income for black families is only up 19% since 1968.
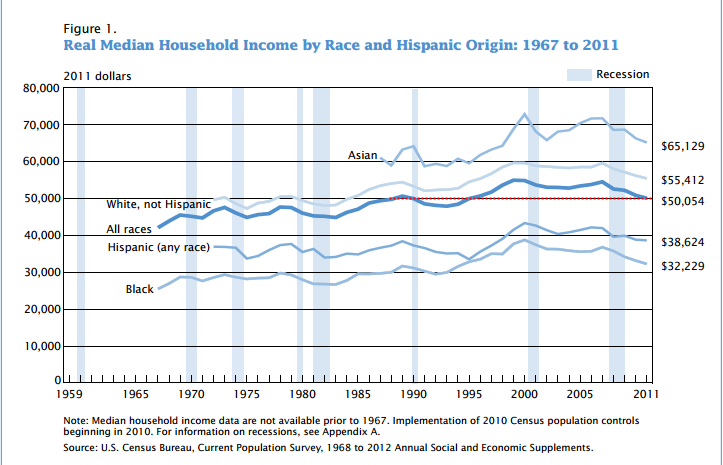
real household income

Now for the really bad news. Any critical thinking person should realize the Federal Government has been systematically under-reporting inflation since the early 1980’s in an effort to obscure the fact they are debasing the currency and methodically destroying the lives of middle class Americans. If inflation was calculated exactly as it was in 1980, the GDP figures would be substantially lower and inflation would be reported 5% higher than it is today. Faking the numbers does not change reality, only the perception of reality. Calculating real median household income with the true level of inflation exposes the true picture for middle class America. Real median household income is lower than it was in 1970, just prior to Nixon closing the gold window and unleashing the full fury of a Federal Reserve able to print fiat currency and politicians to promise the earth, moon and the sun to voters. With incomes not rising over the last four decades is it any wonder many of our 115 million households slowly rot and decay from within like an old diseased oak tree. The slightest gust of wind can lead to disaster.

Eliminating the last remnants of fiscal discipline on bankers and politicians in 1971 accomplished the desired result of enriching the top 0.1% while leaving the bottom 90% in debt and desolation. The Wall Street debt peddlers, Military Industrial arms dealers, and job destroying corporate goliaths have reaped the benefits of financialization (money printing) while shoveling the costs, their gambling losses, trillions of consumer debt, and relentless inflation upon the working tax paying middle class. The creation of the Federal Reserve and implementation of the individual income tax in 1913, along with leaving the gold standard has rewarded the cabal of private banking interests who have captured our economic and political systems with obscene levels of wealth, while senior citizens are left with no interest earnings ($400 billion per year has been absconded from savers and doled out to bankers since 2008 by Ben Bernanke) and the middle class has gone decades seeing their earnings stagnate and their purchasing power fall precipitously.


The facts exposed in the chart above didn’t happen by accident. The system has been rigged by those in power to enrich them, while impoverishing the masses. When you gain control over the issuance of currency, issuance of debt, tax system, political system and legal apparatus, you’ve essentially hijacked the country and can funnel all the benefits to yourself and costs to the math challenged, government educated, brainwashed dupes, known as the masses. But there is a problem for the 0.1%. Their sociopathic personalities never allow them to stop plundering and preying upon the sheep. They have left nothing but carcasses of the once proud hard working middle class across the country side. There are only so many Lear jets, estates in the Hamptons, Jaguars, and Rolexes the 0.1% can buy. There are only 152,000 of them. Their sociopathic looting and pillaging of the national wealth has destroyed the host. When 90% of the population can barely subsist, collapse and revolution beckon.

Extend, Pretend & Depend

As I drove further along Ridge Pike we passed the endless monuments to our spiral into the depths of materialism, consumerism, and the illusion that goods purchased on credit represented true wealth. Mile after mile of strip malls, restaurants, gas stations, and office buildings rolled by my window. Anyone who lives in the suburbs knows what I’m talking about. You can’t travel three miles in any direction without passing a Dunkin Donuts, KFC, McDonalds, Subway, 7-11, Dairy Queen, Supercuts, Jiffy Lube or Exxon Station. The proliferation of office parks to accommodate the millions of paper pushers that make our service economy hum has been unprecedented in human history. Never have so many done so little in so many places. Everyone knows what a standard American strip mall consists of – a pizza place, a Chinese takeout, beer store, a tanning, salon, a weight loss center, a nail salon, a Curves, karate studio, Gamestop, Radioshack, Dollar Store, H&R Block, and a debt counseling service. They are a reflection of who we’ve become – an obese drunken species with excessive narcissistic tendencies that prefers to play video games while texting on our iGadgets as our debt financed lifestyles ultimately require professional financial assistance.

What you can’t ignore today is the number of vacant storefronts in these strip malls and the overwhelming number of SPACE AVAILABLE, FOR LEASE, and FOR RENT signs that proliferate in front of these dying testaments to an unsustainable economic system based upon debt fueled consumer spending and infinite growth assumptions. The booming sign manufacturer is surely based in China. The officially reported national vacancy rates of 11% are already at record highs, but anyone with two eyes knows these self-reported numbers are a fraud. Vacancy rates based on my observations are closer to 30%. This is part of the extend and pretend strategy that has been implemented by Ben Bernanke, Tim Geithner, the FASB, and the Wall Street banking cabal. The fraud and false storyline of a commercial real estate recovery is evident to anyone willing to think critically. The incriminating data is provided by the Federal Reserve in their Quarterly Delinquency Report.

The last commercial real estate crisis occurred in 1991. Mall vacancy rates were at levels consistent with today.

The current reported office vacancy rates of 17.5% are only slightly below the 19% levels of 1991.

As reported by the Federal Reserve, delinquency rates on commercial real estate loans in 1991 were 12%, leading to major losses among the banks that made those imprudent loans. Amazingly, after the greatest financial collapse in history, delinquency rates on commercial loans supposedly peaked at 8.8% in the 2nd quarter of 2010 and have now miraculously plummeted to pre-collapse levels of 4.9%. This is while residential loan delinquencies have resumed their upward trajectory, the number of employed Americans has fallen by 414,000 in the last two months, 9 million Americans have left the labor force since 2008, and vacancy rates are at or near all-time highs. This doesn’t pass the smell test. The Federal Reserve, owned and controlled by the Wall Street, instructed these banks to extend all commercial real estate loans, pretend they will be paid, and value them on their books at 100% of the original loan amount. Real estate developers pretend they are collecting rent from non-existent tenants, Wall Street banks pretend they are being paid by the developers, and their highly compensated public accounting firm pretends the loans aren’t really delinquent. Again, the purpose of this scam is to shield the Wall Street bankers from accepting the losses from their reckless behavior. Ben rewards them with risk free income on their deposits, propped up by mark to fantasy accounting, while they reward themselves with billions in bonuses for a job well done. The master plan requires an eventual real recovery that isn’t going to happen. Press releases and fake data do not change the reality on the ground.

I have two strip malls within three miles of my house that opened in 1990. When I moved to the area in 1995, they were 100% occupied and a vital part of the community. The closest center has since lost its Genuardi grocery store, Sears Hardware, Blockbuster, Donatos, Sears Optical, Hollywood Tans, hair salon, pizza pub and a local book store. It is essentially a ghost mall, with two banks, a couple chain restaurants and empty parking spaces. The other strip mall lost its grocery store anchor and sporting goods store. This has happened in an outwardly prosperous community. The reality is the apparent prosperity is a sham. The entire tottering edifice of housing, autos, and retail has been sustained by ever increasing levels of debt for the last thirty years and the American consumer has hit the wall. From 1950 through the early 1980s, when the working middle class saw their standard of living rise, personal consumption expenditures accounted for between 60% and 65% of GDP. Over the last thirty years consumption has relentlessly grown as a percentage of GDP to its current level of 71%, higher than before the 2008 collapse.

If the consumption had been driven by wage increases, then this trend would not have been a problem. But, we already know real median household income is lower than it was in 1970. The thirty years of delusion were financed with debt – peddled, hawked, marketed, and pushed by the drug dealers on Wall Street. The American people got hooked on debt and still have not kicked the habit. The decline in household debt since 2008 is solely due to the Wall Street banks writing off $800 billion of mortgage, credit card, and auto loan debt and transferring the cost to the already drowning American taxpayer.
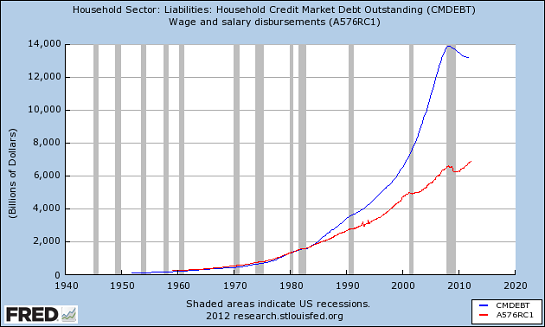
The powers that be are desperately attempting to keep this unsustainable, dysfunctional debt choked scheme from disintegrating by doling out more subprime auto debt, subprime student loan debt, low down payment mortgages, and good old credit card debt. It won’t work. The consumer is tapped out. Last week’s horrific retail sales report for August confirmed this fact. Declining household income and rising costs for energy, food, clothing, tuition, taxes, health insurance, and the other things needed to survive in the real world, have broken the spirit of Middle America. The protracted implosion of our consumer society has only just begun. There are thousands of retail outlets to be closed, hundreds of thousands of jobs to be eliminated, thousands of malls to be demolished, and billions of loan losses to be incurred by the criminal Wall Street banks.

The Faces of Failure & Futility

My fourteen years working in key positions for big box retailer IKEA has made me particularly observant of the hubris and foolishness of the big chain stores that dominate the retail landscape.  There are 1.1 million retail establishments in the United States, but the top 25 mega-store national chains account for 25% of all the retail sales in the country. The top 100 retailers operate 243,000 stores and account for approximately $1.6 trillion in sales, or 36% of all the retail sales in the country. Their misconceived strategic plans assumed 5% same store growth for eternity, economic growth of 3% per year for eternity, a rising market share, and ignorance of the possible plans of their competitors. They believed they could saturate a market without over cannibalizing their existing stores. Wal-Mart, Target, Best Buy, Home Depot and Lowes have all hit the limits of profitable expansion. Each incremental store in a market results in lower profits.

My trip to my local Lowes last weekend gave me a glimpse into a future of failure and futility. Until 2009, I had four choices of Lowes within 15 miles of my house. There was a store 8 miles east, 12 miles west, 15 miles north, and 15 miles south of my house. In an act of supreme hubris, Lowes opened a store smack in the middle of these four stores, four miles from my house. The Hatfield store opened in early 2009 and I wrote an article detailing how Lowes was about to ruin their profitability in Montgomery County. It just so happens that I meet a couple of my old real estate buddies from IKEA at a local pub every few months. In 2009 one of them had a real estate position with Lowes and we had a spirited discussion about the prospects for the Lowes Hatfield store. He assured me it would be a huge success. I insisted it would be a dud and would crush the profitability of the market by cannibalizing the other four stores. We met at that same pub a few months ago. Lowes had laid him off and he admitted to me the Hatfield store was a disaster.

I pulled into the Lowes parking lot at 11:30 am on a Saturday. Big Box retailers do 50% of their business on the weekend. The busiest time frame is from 11:00 am to 2:00 pm on Saturday. Big box retailers build enough parking spots to handle this peak period. The 120,000 square feet Hatfield Lowes has approximately 1,000 parking spaces. I pulled into the spot closest to the entrance during their supposed peak period. There were about 70 cars in the parking lot, with most probably owned by Lowes workers. It is a pleasure to shop in this store, with wide open aisles, and an employee to customer ratio of four to one. The store has 14 checkout lanes and at peak period on a Saturday, there was ONE checkout lane open, with no lines. This is a corporate profit disaster in the making, but the human tragedy far overrides the declining profits of this mega-retailer.

As you walk around this museum of tools and toilets you notice the looks on the faces of the workers. These aren’t the tattooed, face pierced freaks you find in many retail establishments these days. They are my neighbors. They are the beaten down middle class. They are the middle aged professionals who got cast aside by the mega-corporations in the name of efficiency, outsourcing, right sizing, stock buybacks, and executive stock options. The irony of this situation is lost on those who have gutted the American middle class. When you look into the eyes of these people, you see sadness, confusion and embarrassment. They know they can do more. They want to do more. They know they’ve been screwed, but they aren’t sure who to blame. They were once the very customers propelling Lowes’ growth, buying new kitchens, appliances, and power tools. Now they can’t afford a can of paint on their $10 per hour, no benefit retail careers. As depressing as this portrait appears, it is about to get worse.

This Lowes will be shut down and boarded up within the next two years. The parking lot will become a weed infested eyesore occupied by 14 year old skateboarders. One hundred and fifty already down on their luck neighbors will lose their jobs, the township will have a gaping hole in their tax revenue, and the CEO of Lowes will receive a $50 million bonus for his foresight in announcing the closing of 100 stores that he had opened five years before. This exact scenario will play out across suburbia, as our unsustainable system comes undone. Our future path will parallel the course of the labor participation rate. Just as the 9 million Americans who have “left” the labor force since 2008 did not willfully make that choice, the debt burdened American consumer will be dragged kicking and screaming into the new reality of a dramatically reduced standard of living.

Connecting the dots between my anecdotal observations of suburbia and a critical review of the true non-manipulated data bestows me with a not optimistic outlook for the coming decade. Is what I’m seeing just the view of a pessimist, or are you seeing the same thing?

A few powerful men have hijacked our economic, financial and political structure. They aren’t socialists or capitalists. They’re criminals. They created the culture of materialism, greed and debt, sustained by prodigious levels of media propaganda. Our culture has been led to believe that debt financed consumption over morality and justice is the path to success. In reality, we’ve condemned ourselves to a slow painful death spiral of debasement and despair.

“A culture that does not grasp the vital interplay between morality and power, which mistakes management techniques for wisdom, and fails to understand that the measure of a civilization is its compassion, not its speed or ability to consume, condemns itself to death.” – Chris Hedges

order non hybrid seeds

EXTEND & PRETEND COMING TO AN END

The real world revolves around cash flow. Families across the land understand this basic concept. Cash flows in from wages, investments and these days from the government. Cash flows out for food, gasoline, utilities, cable, cell phones, real estate taxes, income taxes, payroll taxes, clothing, mortgage payments, car payments, insurance payments, medical bills, auto repairs, home repairs, appliances, electronic gadgets, education, alcohol (necessary in this economy) and a countless other everyday expenses. If the outflow exceeds the inflow a family may be able to fund the deficit with credit cards for awhile, but ultimately running a cash flow deficit will result in debt default and loss of your home and assets. Ask the millions of Americans that have experienced this exact outcome since 2008 if you believe this is only a theoretical exercise. The Federal government, Federal Reserve, Wall Street banks, regulatory agencies and commercial real estate debtors have colluded since 2008 to pretend cash flow doesn’t matter. Their plan has been to “extend and pretend”, praying for an economic recovery that would save them from their greedy and foolish risk taking during the 2003 – 2007 Caligula-like debauchery.

I wrote an article called Extend and Pretend is Wall Street’s Friend about one year ago where I detailed what I saw as the moneyed interest’s master plan to pretend that hundreds of billions in debt would be repaid, despite the fact that declining developer cash flow and plunging real estate prices would make that impossible. Here are a couple pertinent snippets from that article:

“A systematic plan to create the illusion of stability and provide no-risk profits to the mega-Wall Street banks was implemented in early 2009 and continues today. The plan was developed by Ben Bernanke, Hank Paulson, Tim Geithner and the CEOs of the criminal Wall Street banking syndicate. The plan has been enabled by the FASB, SEC, IRS, FDIC and corrupt politicians in Washington D.C. This master plan has funneled hundreds of billions from taxpayers to the banks that created the greatest financial collapse in world history.

Part two of the master cover-up plan has been the extending of commercial real estate loans and pretending that they will eventually be repaid. In late 2009 it was clear to the Federal Reserve and the Treasury that the $1.2 trillion in commercial loans maturing between 2010 and 2013 would cause thousands of bank failures if the existing regulations were enforced. The Treasury stepped to the plate first. New rules at the IRS weren’t directly related to banking, but allowed commercial loans that were part of investment pools known as Real Estate Mortgage Investment Conduits, or REMICs, to be refinanced without triggering tax penalties for investors.

The Federal Reserve, which is tasked with making sure banks loans are properly valued, instructed banks throughout the country to “extend and pretend” or “amend and pretend,” in which the bank gives a borrower more time to repay a loan. Banks were “encouraged” to modify loans to help cash strapped borrowers. The hope was that by amending the terms to enable the borrower to avoid a refinancing that would have been impossible, the lender would ultimately be able to collect the balance due on the loan. Ben and his boys also pushed banks to do “troubled debt restructurings.” Such restructurings involved modifying an existing loan by changing the terms or breaking the loan into pieces. Bank, thrift and credit-union regulators very quietly gave lenders flexibility in how they classified distressed commercial mortgages. Banks were able to slice distressed loans into performing and non-performing loans, and institutions were able to magically reduce the total reserves set aside for non-performing loans.

If a mall developer has 40% of their mall vacant and the cash flow from the mall is insufficient to service the loan, the bank would normally need to set aside reserves for the entire loan. Under the new guidelines they could carve the loan into two pieces, with 60% that is covered by cash flow as a good loan and the 40% without sufficient cash flow would be classified as non-performing. The truth is that billions in commercial loans are in distress right now because tenants are dropping like flies. Rather than writing down the loans, banks are extending the terms of the debt with more interest reserves included so they can continue to classify the loans as “performing.” The reality is that the values of the property behind these loans have fallen 43%. Banks are extending loans that they would never make now, because borrowers are already grossly upside-down.”

Master Plan Malfunction

You have to admire the resourcefulness of the vested interests in disguising disaster and pretending that time will alleviate the consequences of their insatiable greed, blatant criminality and foolish risk taking. Extending bad loans and pretending they will be repaid does not create the cash flow necessary to actually pay the interest and principal on the debt. The chart below reveals the truth of what happened between 2005 and 2008 in the commercial real estate market. There was an epic feeding frenzy of overbuilding shopping centers, malls, office space, industrial space and apartments. During the sane 1980’s and 1990’s, commercial real estate loan issuance stayed consistently in the $500 billion to $700 billion range. The internet boom led to a surge to $1.1 trillion in 2000, with the resultant pullback to $900 billion by 2004. But thanks to easy Al and helicopter Ben, the bubble was re-inflated with easy money and zero regulatory oversight. Commercial real estate loan issuance skyrocketed to $1.6 trillion per year by 2008. Bankers sure have a knack for doing the exact opposite of what they should be doing at the exact wrong time. They doled out a couple trillion of loans to delusional developers at peak prices just prior to a historic financial cataclysm.

The difference between bad retail mortgage loans and bad commercial loans is about 25 years. Commercial real estate loans usually have five to seven year maturities. This meant that an avalanche of loans began maturing in 2010 and will not peak until 2013. With $1.2 trillion of loans coming due between 2010 and 2013, disaster for the Wall Street Too Big To Fail banks awaited if the properties were valued honestly. A perfect storm of declining property values and plunging cash flows for developers should have resulted in enormous losses for Wall Street banks and their shareholders, resulting in executives losing not only their obscene bonuses but even their jobs. Imagine the horror for the .01%.

The fact is that commercial property prices are currently 42% below the 2007 – 2008 peak. The slight increase in the national index is solely due to strong demand for apartments, as millions of Americans have been kicked out of their homes by Wall Street bankers using fraudulent loan documentation to foreclose on them. The national index has recently resumed its fall. Industrial and retail properties are leading the descent in prices according to Moodys. The master plan of extend and pretend was implemented in 2009 and three years later commercial real estate prices are 10% lower, after the official end of the recession.

Part one of the “extend and pretend” plan has failed. Part two anticipated escalating developer cash flows as the economy recuperated, Americans resumed spending like drunken sailors and retailers began to rake in profits at record levels again. Reality has interfered with their desperate last ditch gamble. Office vacancies remain at 17.3%, close to 20 year highs, as 12.3 million square feet of new space came to market in 2011. Vacancies are higher today than they were at the end of the recession in December 2009. The recovery in cash flow has failed to materialize for commercial developers. Strip mall vacancies at 11% remain stuck at 20 year highs. Regional mall vacancies at 9.2% linger near all-time highs. Vacancies remain elevated, with no sign of decreasing. Despite these figures, an additional 4.9 million square feet of new retail space was opened in 2011. The folly of this continued expansion will be revealed as bricks and mortar retailers are forced to close thousands of stores in the next five years.

It is clear the plan put into place three years ago has failed. Extending and pretending doesn’t service the debt. Only cash flow can service debt.

Now What?

Extending and pretending that hundreds of millions in commercial loans were payable for the last three years is now colliding with a myriad of other factors to create a perfect storm in 2012 and 2013. The extension of maturities has now set up a far more catastrophic scenario as described by Chris Macke, senior real estate strategist at CoStar Group:

“As banks and property owners continue to partake in loan extensions amid a softening economy, commercial banks continue to “delay and pray” that property values will rise. Many loans are piled up and concentrated in this year, and at the same time, the economy is slowing. This dilemma has resulted in the widening of what is commonly termed the “loan maturity cliff,” which is attributed to the so called extend-and-pretend loans. During the market downturn, lenders extended the maturity dates of loans with properties that had current values below their balances. Instead, however the practice has resulted in a race for property values to try to catch up with the loan maturity dates.”

The Federal Reserve, Wall Street banks, Mortgage Bankers Association and the rest of the confederates of collusion will continue the Big Lie for as long as possible. They point to declining commercial default rates as proof of improvement. The chart below details the 4th quarter default rates for real estate loans over the last six years. Default rates in the 4th quarter of 2009 peaked for all real estate loan types. Still, today’s default rate is 450% higher than the rate in 2006. A critical thinker might ask how commercial default rates could fall from 8.75% to 6.12% when commercial vacancies have increased and commercial property values have fallen. It’s amazing how low default rates can fall when a bank doesn’t require payments or collateral to back up the loan and can utilize accounting gimmicks to avoid write-offs.


Real estate loans

All

Booked in domestic offices

Residential 

Commercial 

Farmland

2011:4

8.22

9.86

6.12

3.26

2010:4

9.07

10.11

7.98

3.61

2009:4

9.55

10.45

8.75

3.43

2008:4

6.03

6.64

5.49

2.28

2007:4

2.90

3.07

2.75

1.51

2006:4

1.70

1.95

1.32

1.41

The reality as detailed by honest analysts is much different than the numbers presented by Ben Bernanke and his banker cronies. A recent article from the Urban Land Institute provides some insight into the current state of the market:

 Ann Hambly, who previously ran the commercial servicing departments at Prudential, Bank of New York, Nomura, and Bank of America said a wave of defaults is coming in commercial mortgage–backed securities (CMBS). And Carl Steck, a principal in MountainSeed Appraisal Management, an Atlanta-based firm that deals in the commercial real estate space, said property values are still falling.

Noting that CMBS investors booked $6 billion in real losses in 2011 and have already taken on $2 billion more in losses so far this year, Hambly told reporters in a private briefing that “it’s going to take a miracle” for many borrowers to refinance their deals when they come due between now and 2017.

Carl Steck said that lenders who are taking over the portfolios of failed institutions are finding that the values of the loans “are coming in a lot lower than they ever thought they would.” And as a result, he thinks a “fire sale” of commercial loans is just over the horizon.

Analysts expect 2012 to be a record-setting year for commercial real estate defaults. Last week delinquencies for office and retail loans hit their highest-ever levels, according to Fitch Ratings. The value of all delinquent commercial loans is now $57.7 billion, according to Trepp, LLC. If you think the criminal Wall Street banks limited their robo-signing fraud to just poor homeowners, you would be mistaken. The fraud uncovered in the commercial lending orbit will dwarf the residential swindle. Research by Harbinger Analytics Group shows the widespread use of inaccurate, fraudulent documents for land title underwriting of commercial real estate financing. According to the report:

This fraud is accomplished through inaccurate and incomplete filings of statutorily required records (commercial land title surveys detailing physical boundaries, encumbrances, encroachments, etc.) on commercial properties in California, many other western states and possibly throughout most of the United States. In the cases studied by Harbinger, the problems are because banks accepted the work of land surveyors who “have committed actual and/or constructive fraud by knowingly failing to conduct accurate boundary surveys and/or failing to file the statutorily required documentation in public records.”


Your Ad Here

The Wall Street geniuses bundled commercial real estate mortgages and re-sold them as securities around the world. The suckers holding those securities, already staggering from the overabundance of empty office space, will be devastated if it turns out they have no claim to the properties. They will rightly sue the lenders for falsely representing the properties. Mortgage holders in these cases may also turn to their title insurance to cover any losses. It is unknown if the title insurance companies have the wherewithal to withstand enormous claims on costly commercial properties. It looks like that light at the end of the tunnel is bullet train headed our way.

One of the fingers in the dyke of the “extend and pretend” dam has been removed by the FASB. The new leak threatens to turn into a gusher.


Andy Miller, cofounder of Miller Frishman Group, and one of the few analysts who saw the real estate crash coming two years before it surprised Bernanke and the CNBC cheerleaders sees a flood of defaults on the horizon. In a recent interview with The Casey Report Miller details a dramatic turn for the worse in the commercial real estate market he has witnessed in the last few months. His company deals with distressed commercial real estate. This segment of his business was booming in 2009 and into the middle of 2010. Then magically, there was no more distress as the “extend and pretend” plan was implemented by the governing powers. The distressed market dried up completely until November 2011. Miller describes what happened next:

“All of a sudden, right after Thanksgiving in 2011, the floodgates opened again. In the last six weeks we probably picked up seven or eight receiverships – and we’re now seeing some really big-ticket properties with major loans on them that have gone into distress, and they’re all sharing some characteristics in common. In 2008 and 2009, these borrowers were put on a workout or had a forbearance agreement put into place with their lenders. In 2009, their lenders were thinking, “Let’s do a two- or three-year workout with these guys. I’m sure by 2012 this market is going to get a lot better.” Well, 2012 is here now, and guess what? It’s not any better. In fact I would argue that it’s still deteriorating.”

Why the sudden surge in distressed properties coming to market in late 2011? It seems the FASB finally decided to grow a pair of balls after being neutered by Bernanke and Geithner in 2009 regarding mark to market accounting. They issued an Accounting Standards Update (ASU) that went into effect for all periods after June 15, 2011called Clarifications to Accounting for Troubled Debt Restructurings by Creditors. Essentially, if a lender is involved in a troubled debt restructuring with a debtor, including a forbearance agreement or a workout, the property MUST be marked to market. Andy Miller understands this is the beginning of the end for “extend and pretend”:

“I believe it’s a huge deal because it means you don’t have carte blanche anymore to kick the can down the road. After all, kicking the can down the road was a way to avoid taking a big hit to your capital. Well, you can’t do that anymore. It forces you to cut through the optical illusions by writing this asset to its fair market value.”

Ben Bernanke and the Wall Street banks are running out tricks in their bag of deception. Wall Street banks created billions in profits by using accounting entries to reduce their loan loss reserves. They’ve delayed mortgage foreclosures for two years to avoid taking the losses on their loan portfolios. They’ve pretended their commercial loan portfolios aren’t worth 50% less than their current carrying value. Bernanke has stuffed his Federal Reserve balance sheet with billions in worthless commercial mortgage backed securities. The Illusion of Recovery is being revealed as nothing more than a two bit magician’s trick. In the end it always comes back to cash flow. The debt cannot be serviced and must be written off. Thinking the American consumer will ride to the rescue is a delusional flight of the imagination.

Apocalypse Now – The Future of Retailers & Mall Owners


When I moved to my suburban community in 1995 there were two thriving shopping centers within three miles of my home and a dozen within a ten mile radius. Seventeen years later the population has increased dramatically in this area, and these two shopping centers are in their final death throes. The shopping center closest to my house has a vacant Genuardi grocery store(local chain bought out and destroyed by Safeway), vacant Blockbuster, vacant Sears Hardware, vacant Donatos restaurant, vacant book store, and soon to be vacant Pizza Pub. It’s now anchored by a near bankrupt Rite Aid and a Dollar store. This ghost-like strip mall is in the midst of a fairly thriving community. Anyone with their eyes open as they drive around today would think Space Available is the hot new retailer. According to the ICSC there are 105,000 shopping centers in the U.S., occupying 7.3 billion square feet of space. Total retail square feet in the U.S. tops 14.2 billion, or 46 square feet for every man, woman and child in the country. There are more than 1.1 million retail establishments competing for every discretionary dollar from consumers.

Any retailer, banker, politician, or consumer who thinks we will be heading back to the retail glory days of 2007 is delusional. Retail sales reached a peak of $375 billion per month in mid 2008. Today, retail sales have reached a new “nominal” peak of $400 billion per month. Even using the highly questionable BLS inflation figures, real retail sales are still below the 2008 peak. Using the inflation rate provided by John Williams at Shadowstats, as measured the way it was in 1980, real retail sales are 15% below the 2008 peak. The unvarnished truth is revealed in the declining profitability of major retailers and the bankruptcies and store closings plaguing the industry. National retail statistics and recent retailer earnings reports paint a bleak picture, and it’s about to get bleaker.

Retail sales in 1992 totaled $2.0 trillion. By 2011 they had grown to $4.7 trillion, a 135% increase in nineteen years. A full 64% of this rise is solely due to inflation, as measured by the BLS. In reality, using the true inflation figures, the entire increase can be attributed to inflation. Over this time span the U.S. population has grown from 255 million to 313 million, a 23% increase. Median household income has grown by a mere 8% over this same time frame. The increase in retail sales was completely reliant upon the American consumers willing to become a debt slaves to the Wall Street bank slave masters. It is obvious we have learned to love our slavery. Credit card debt grew from $265 billion in 1992 to a peak of $972 billion in September of 2008, when the financial system collapsed. The 267% increase in debt allowed Americans to live far above their means and enriched the Wall Street banking cabal. The decline to the current level of $800 billion was exclusively due to write-offs by the banks, fully funded by the American taxpayer.

Credit cards are currently being used far less as a way to live beyond your means, and more to survive another day. This can be seen in the details underlying the monthly retail sales figures. On a real basis, with inflation on the things we need to live like energy, food and clothing rising at a 10% clip, retail sales are declining. Gasoline, food and medicine are the drivers of retail today. The surge in automobile sales is just another part of the “extend and pretend” plan, as Bernanke provides free money to banks and finance companies so they can make seven year 0% interest loans to subprime borrowers. Easy credit extended to deadbeats will not create the cash flow needed to repay the debt. The continued penetration of on-line retailers does not bode well for the dying bricks and mortar zombie retailers like Sears, JC Penny, Macys and hundreds of other dead retailers walking. With gas prices soaring, the economy headed back into recession and the Federal Reserve out of ammunition, Andy Miller sums up the situation nicely:

“Well, I think we’re headed into an economy right now where there’s just not a lot of upside. Do we think, for example, in the shopping center business, that retail and consumer spending is going to go way up? Certainly not. I think that as times get tougher and unemployment remains high, it’s going to have a negative impact on consumer spending. In almost in any city in America right now, it doesn’t take a genius to see how much retail space has been constructed and is sitting there empty. Vacancy rates are as high as I’ve seen them in almost every venue that I visit. I’m very concerned about the retail business, and I think it’s extremely dangerous right now.”

The major big box retailers have been reporting their annual results in the last week. The results have been weak and even those whose results are being spun as positive by the mainstream media are performing dreadfully compared to 2007. A few examples are in order:

  • Home Depot was praised for their fantastic 2011 result of $70 billion in sales and $6.7 billion of income. The MSM failed to mention that sales are $7 billion lower than 2007, despite having 18 more stores and profit exceeded $7.2 billion in 2007. Sales per square foot have declined from $335 to $296, a 12% decline in four years.
  • Target made $2.9 billion on revenue of $67 billion in 2011. $953 million of this profit was generated from their credit card this year versus $744 million last year because they reduced their loan loss reserve by $260 million. Target is supposedly a retailer, but 33% of their bottom line comes from a credit card they desperately tried to sell in 2009. They have increased their store count from 1,600 to 1,800 since 2007 and their profit is flat. Sales per square foot have declined from $307 to $280 since 2007.
  • J.C. Penney is a bug in search of a windshield. Their sales have declined from $20 billion in 2007 to $17 billion in 2011 despite increasing their store count from 1,067 to 1,114. Their profits have plunged from $1.1 billion to a loss of $152 million. Their sales per square foot have plunged by 14% since 2007. Turning to a former Apple marketing guru as their new CEO will fail. Everyday low pricing is not going to work on Americans trained like monkeys to salivate at the word SALE.
  • The death spiral of Sears/Kmart is a sight to see. As the anchor in hundreds of dying malls across the land, this retail artifact will be joining Montgomery Ward on the scrap heap of retail history in the next few years. Its eventual bankruptcy and liquidation will leave over 4,000 rotting carcasses to spoil our landscape. The one-time genius and heir to the Warren Buffett mantle – Eddie Lampert – has proven to be as talented at retailing as his buddy Jim Cramer is at picking stocks. He has managed to decrease sales by $10 billion, from $53 billion to $43 billion in the space of four years despite opening 247 new stores. That is not an easy feat to accomplish. At least he was able to reduce profits from $1.5 billion to $133 million and drive the sales per square foot in his stores down by 15%.
  • Widely admired Best Buy has screwed the pooch along with the other foolish retailers that have massively over expanded in the last decade. They have increased their domestic sales from $31 billion to $37 billion, a 19% increase in four years. This increase only required a 444 store expansion, from 873 stores to 1,317 stores. A 51% increase in store count for a 19% increase in sales seems to be a bad trade-off. Their chief competitor – Circuit City – went belly-up during this time frame, making the relative sales increase even more pathetic. The $6 billion increase in sales resulted in a $100 million decline in profits and a 13% decrease in sales per square foot since 2007. It might behoove the geniuses running this company to stop building new stores.
  • The retailer that committed the greatest act of suicide in the last decade is Lowes. Their act of hubris, as Home Depot struggled in the mid 2000’s, is coming home to roost today. They increased their store count from 1,385 to 1,749 over four years. This 26% increase in store count resulted in an increase in sales from $47 billion to $49 billion, a 4% boost. Profitability has plunged from over $3 billion to under $2 billion over this same time frame. They’ve won the efficiency competition by seeing their sales per square feet fall by an astounding 21% over the last four years. I’ve witnessed their ineptitude as they opened four stores within 10 miles of each other in Montgomery County, PA and cannibalized themselves to death. The newest store, three miles from my house, is a pleasure to shop as there is generally more staff than customers even on a Saturday afternoon. This beautiful new store will be vacant rotting hulk within three years.

Do the results of these retail giants jive with the retail recovery stories being spun by the corporate mainstream media? When you see some stock shill on CNBC touting one of these retailers, realize he is blowing smoke up your ass. These six struggling retailers account for over 1.1 billion square feet of retail space in the U.S. One or more of them anchor every mall in America. Wal-Mart (600 million square feet in the U.S.) and Kohl’s (82 million square feet) continue to struggle as their lower middle class customers can barely make ends meet. The perfect storm is developing and very few people see it coming. Extend and pretend has failed. Americans are tapped out. Home prices continue to fall. Energy and food prices continue to rise. Wages are stagnant. Job growth is weak. Middle and lower class Americans are using credit cards just to pay their basic living expenses. The 99% are not about to go on a spending binge.

As consumers reduce consumption, retailers lose profits and will be forced to close stores. It is likely that at least 150,000 retail stores will need to close in the next five years. Less stores means less rent for mall developers. Less rent means the inability to service their debt as the value of their property declines with the outcome of Ghost Malls haunting your community. Maybe good old American ingenuity will come to the rescue as we convert ghost malls into FEMA prison camps for uncharged Ron Paul supporters, Obamacare death panel implementation centers, TSA groping educational facilities, housing for the millions kicked out of their homes by the Wall Street .01%ers, and bomb shelters for the imminent Iranian invasion.

Debt default means huge losses for the Wall Street criminal banks. Of course the banksters will just demand another taxpayer bailout from the puppet politicians. This repeat scenario gives new meaning to the term shop until you drop. Extending and pretending can work for awhile as accounting obfuscation, rolling over bad debts, and praying for a revival of the glory days can put off the day of reckoning for a couple years. Ultimately it comes down to cash flow, whether you’re a household, retailer, developer, bank or government. America is running on empty and extending and pretending is coming to an end.